Qwen3.5 0.8B — MTP Enabled
server model id:
qwen3.5-0.8b-mtpthinkingKV F16ctx 32k0.8B params
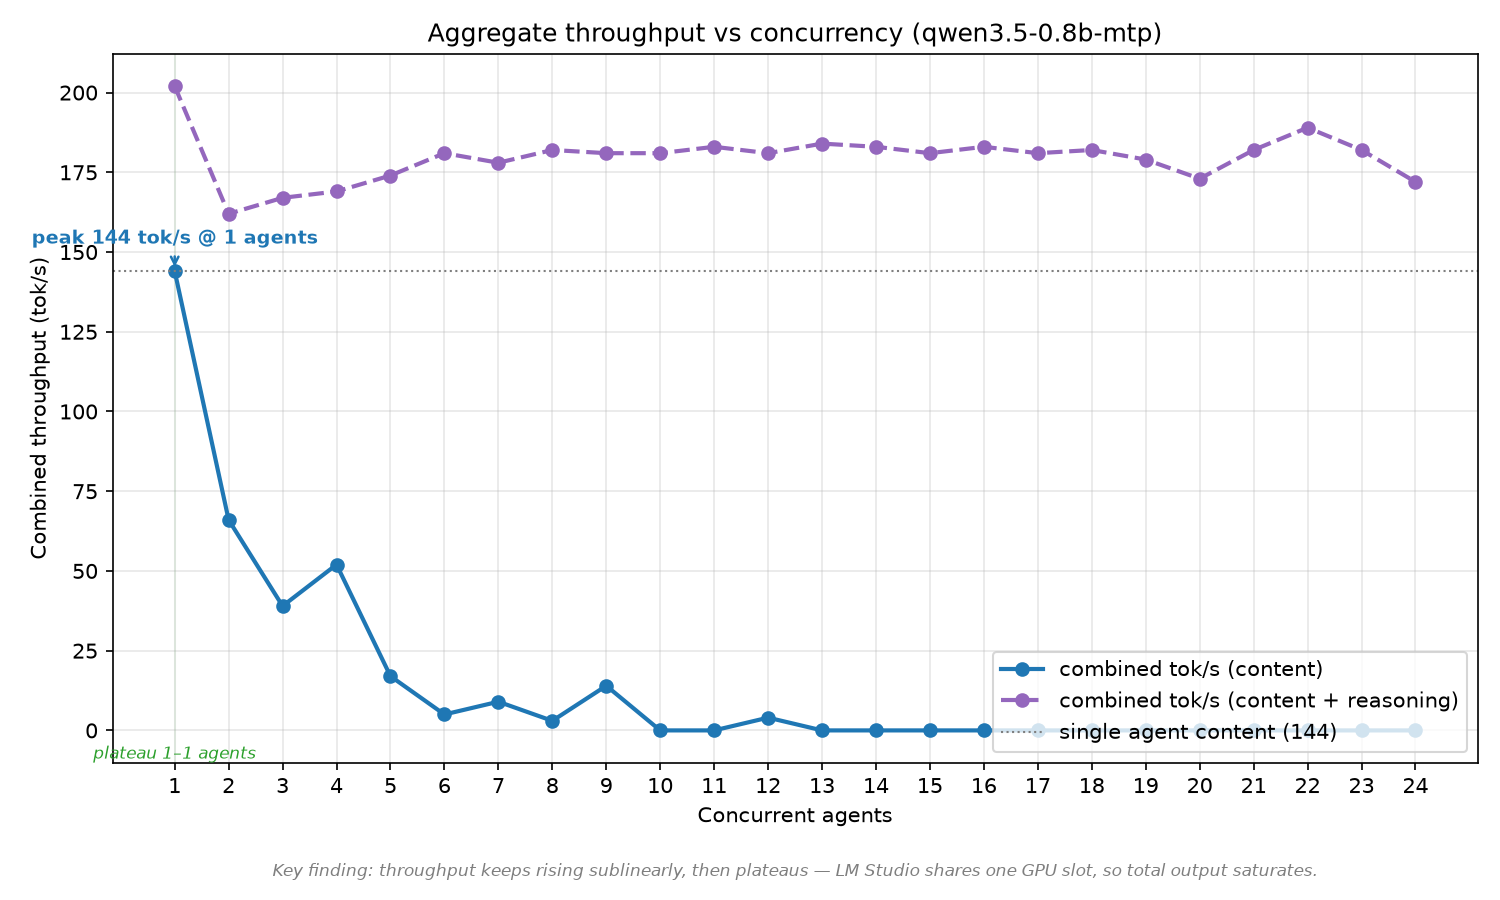
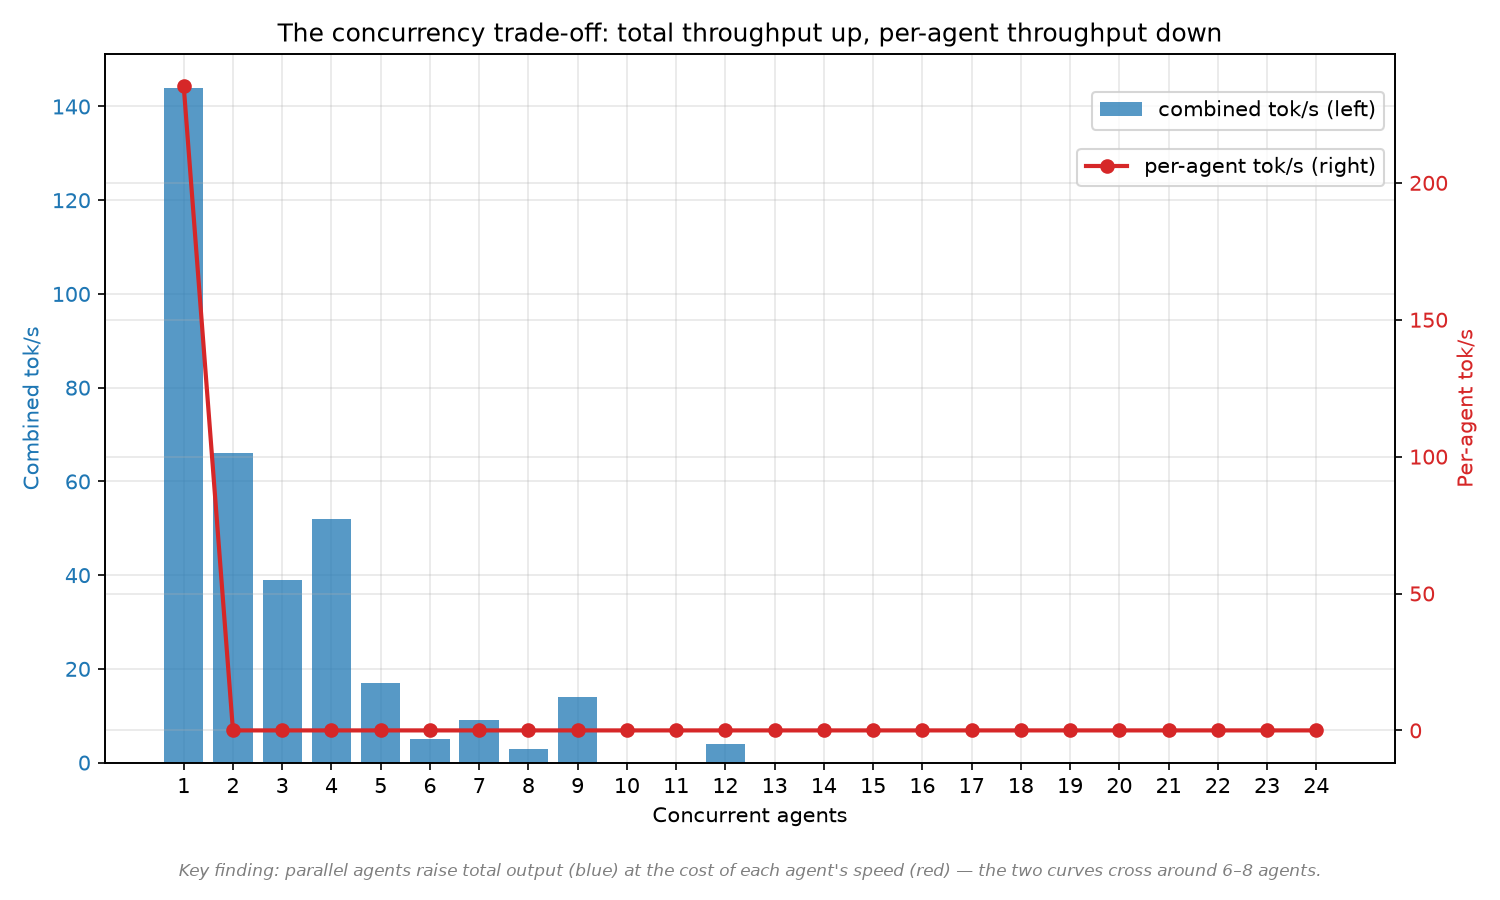
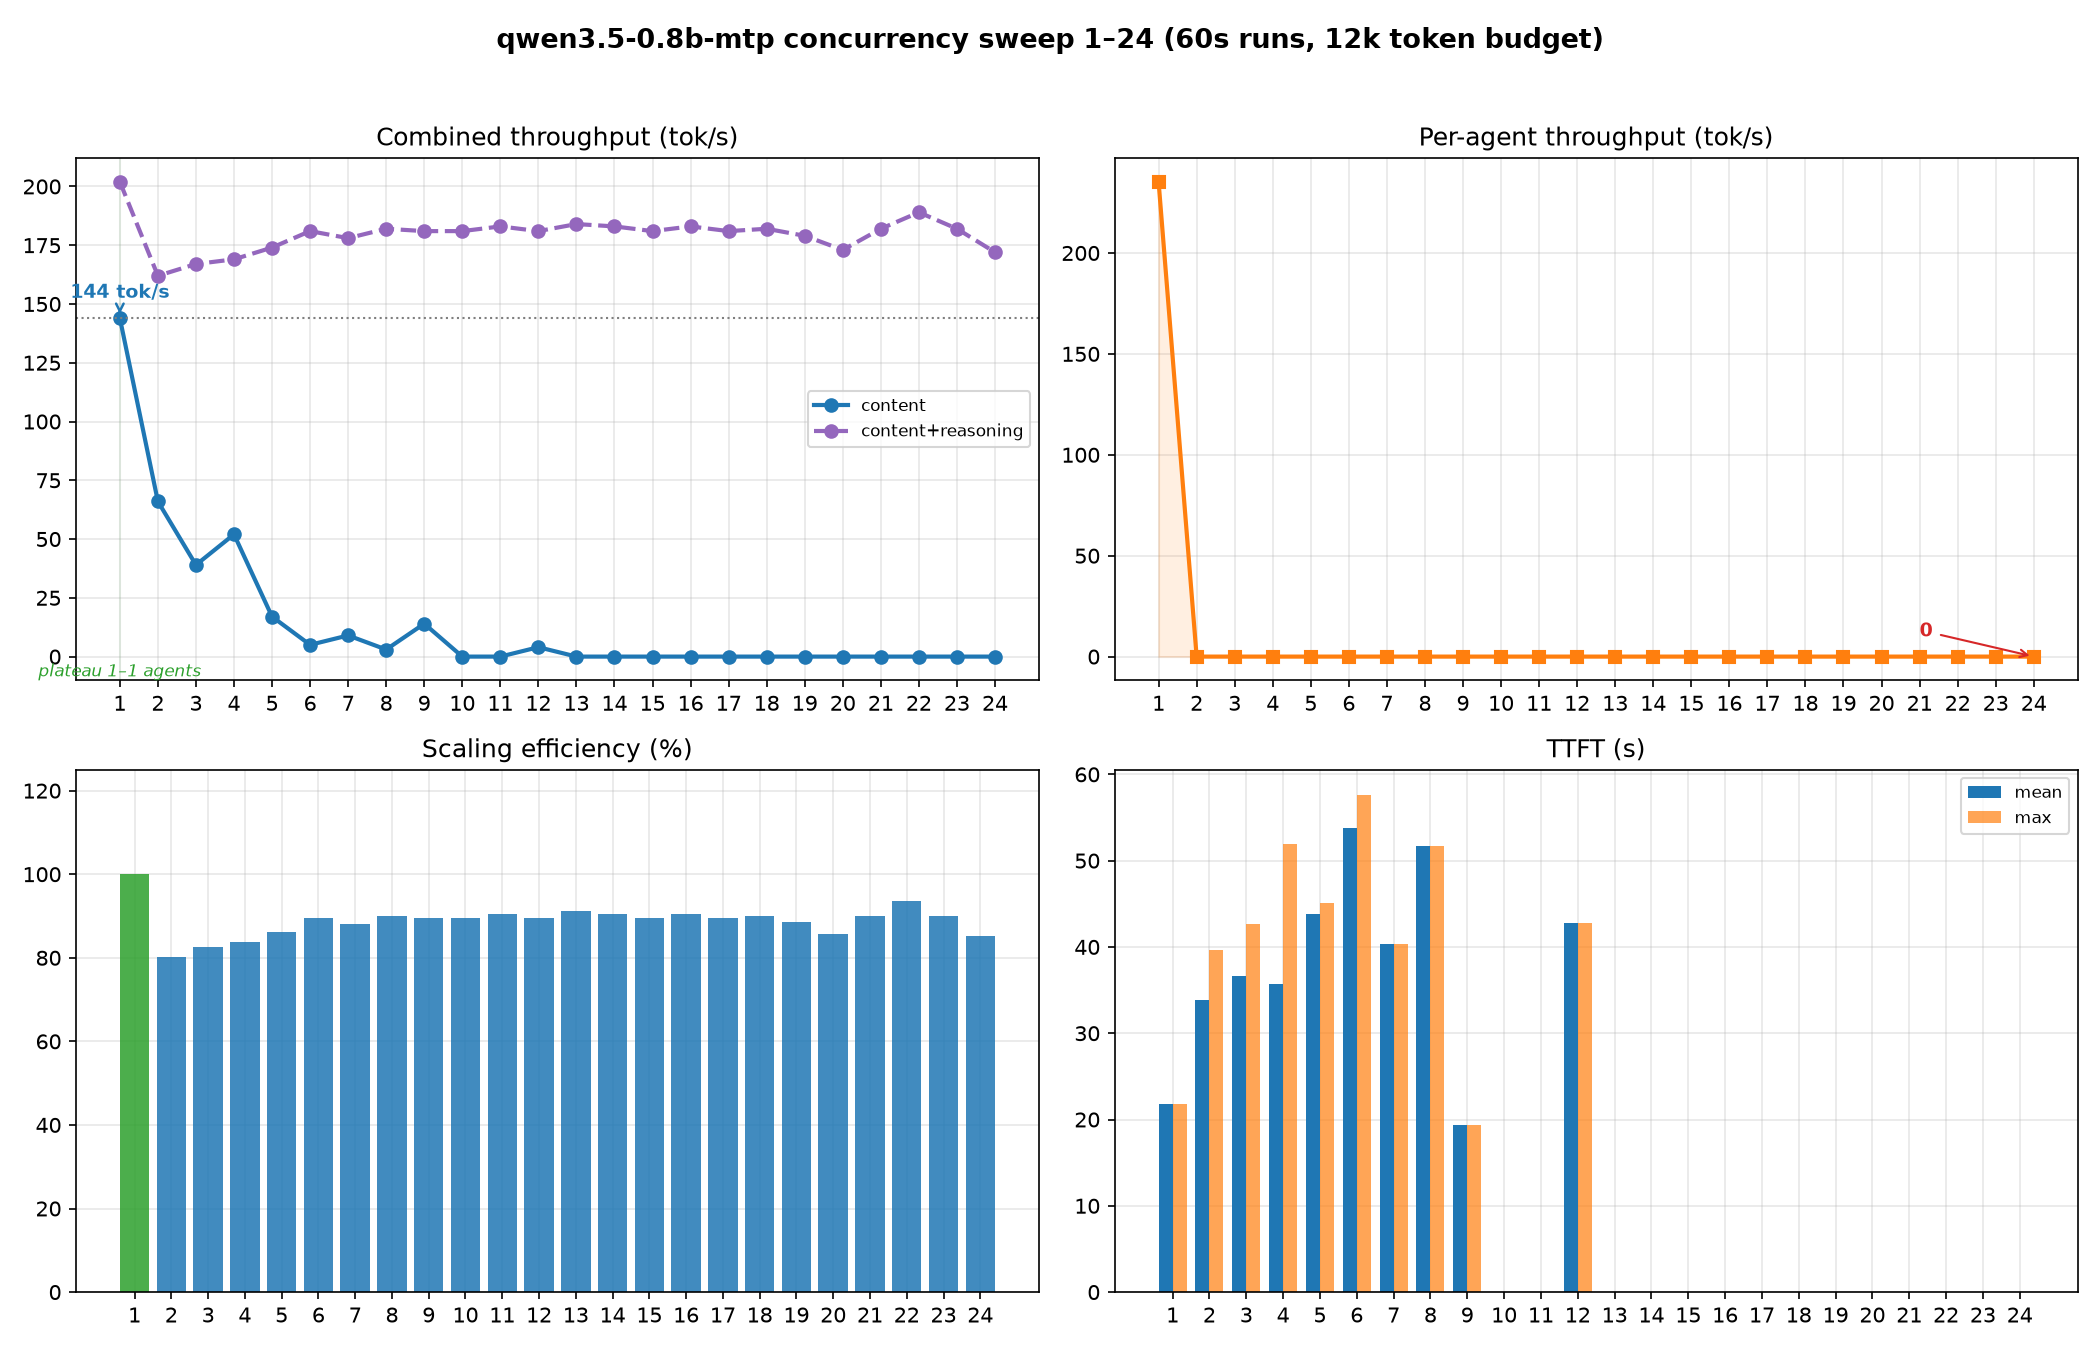
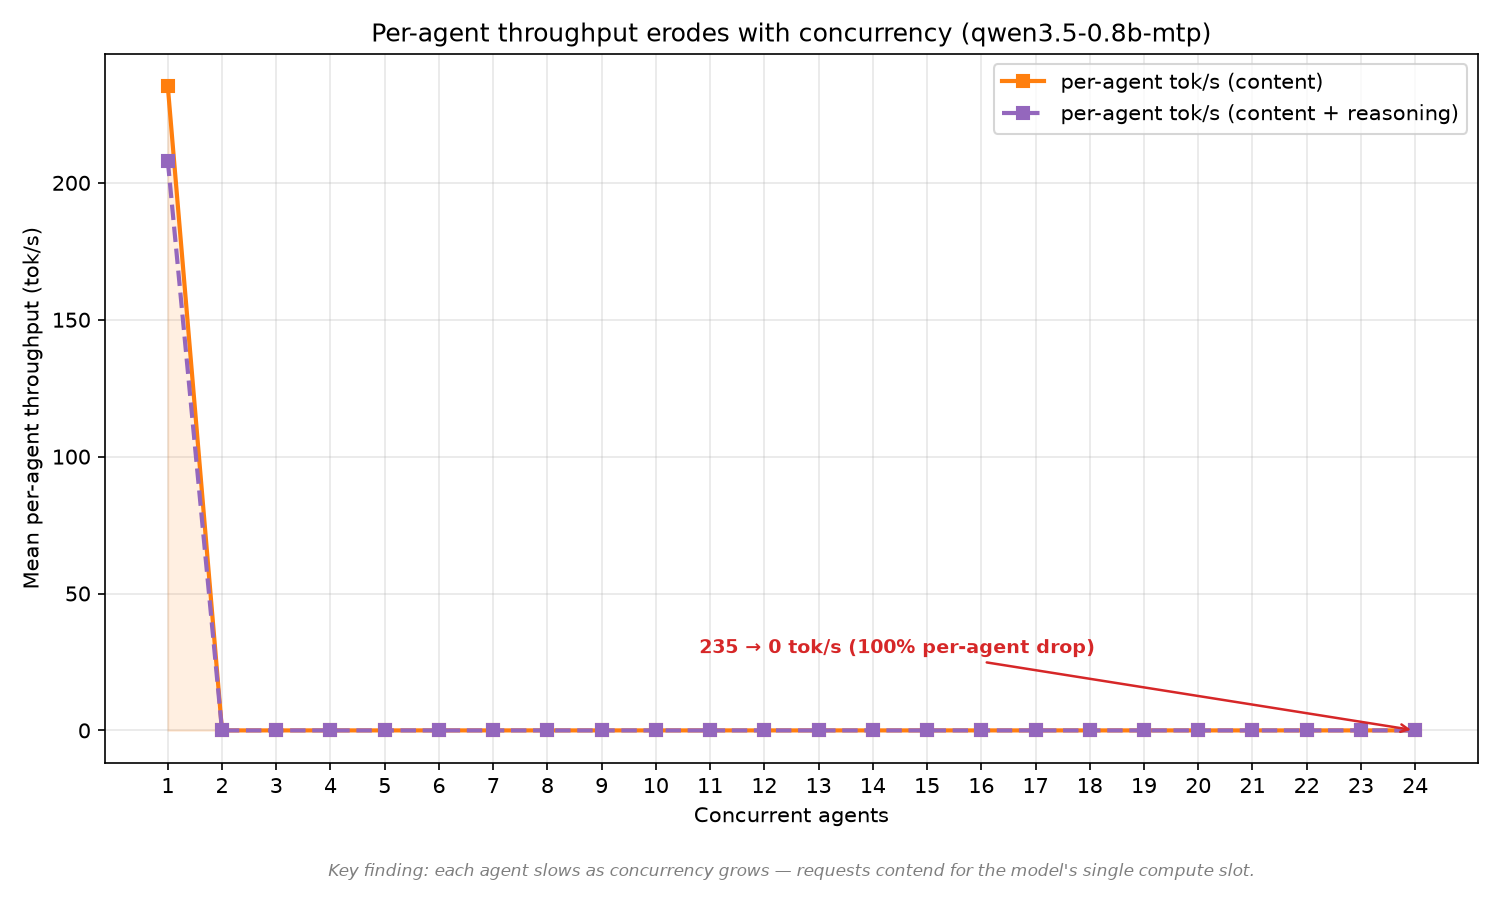
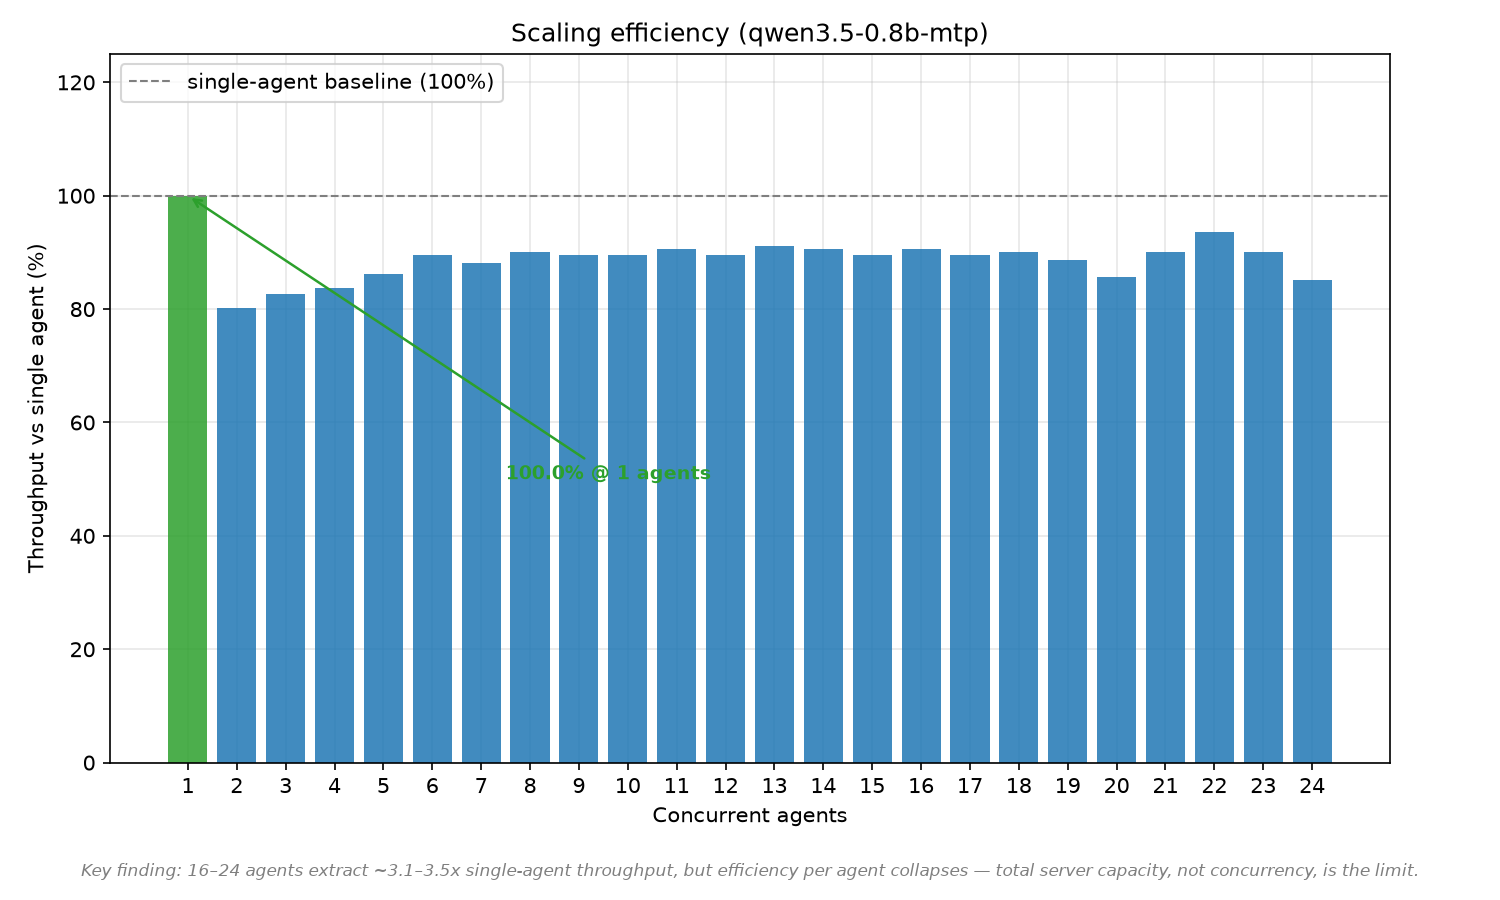
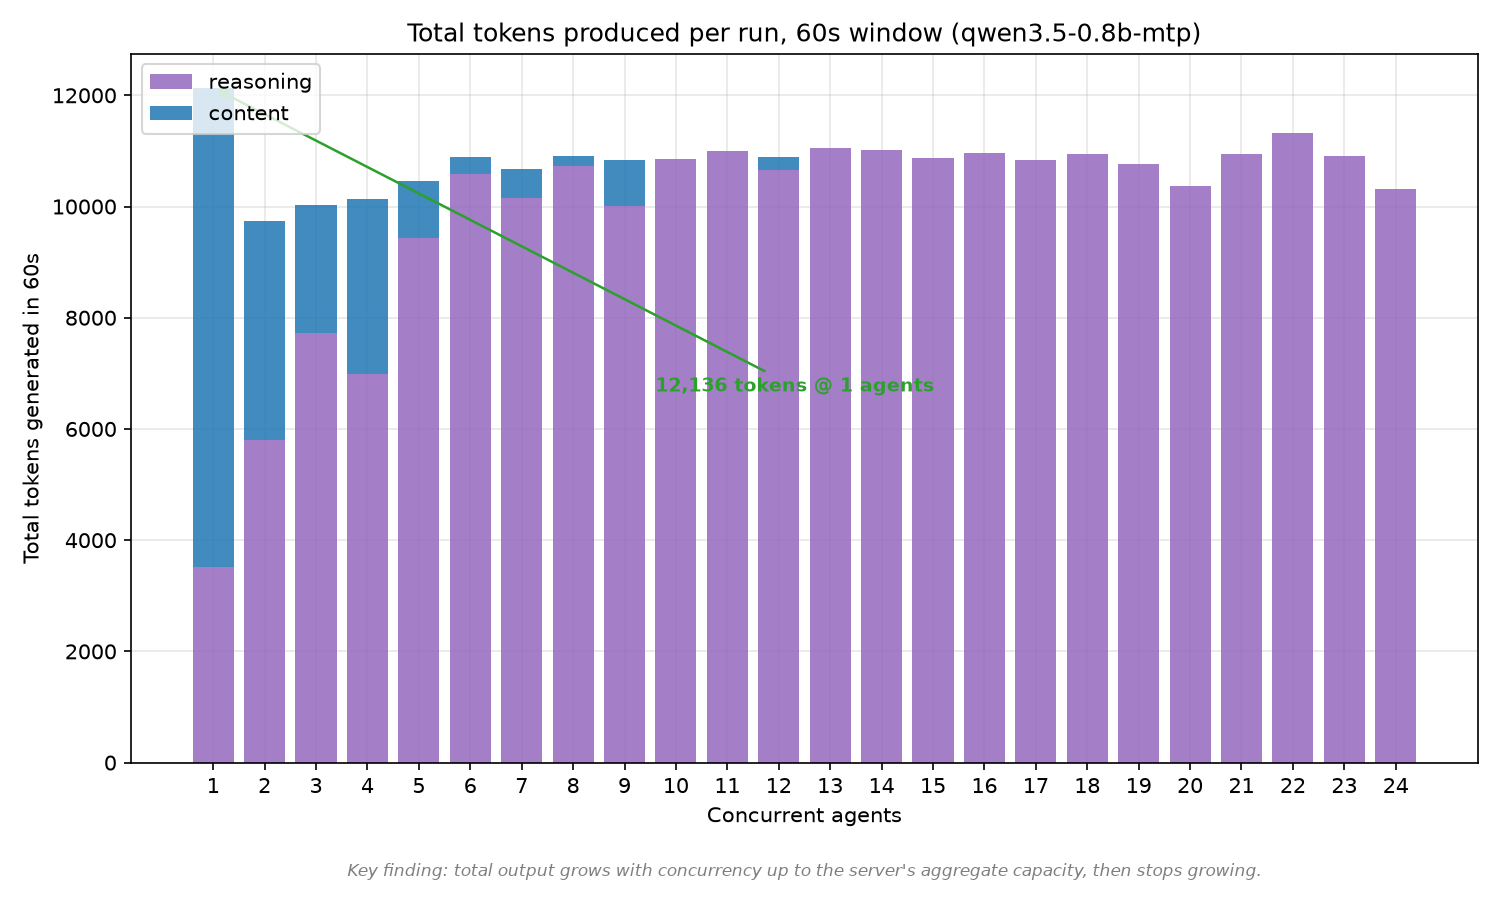
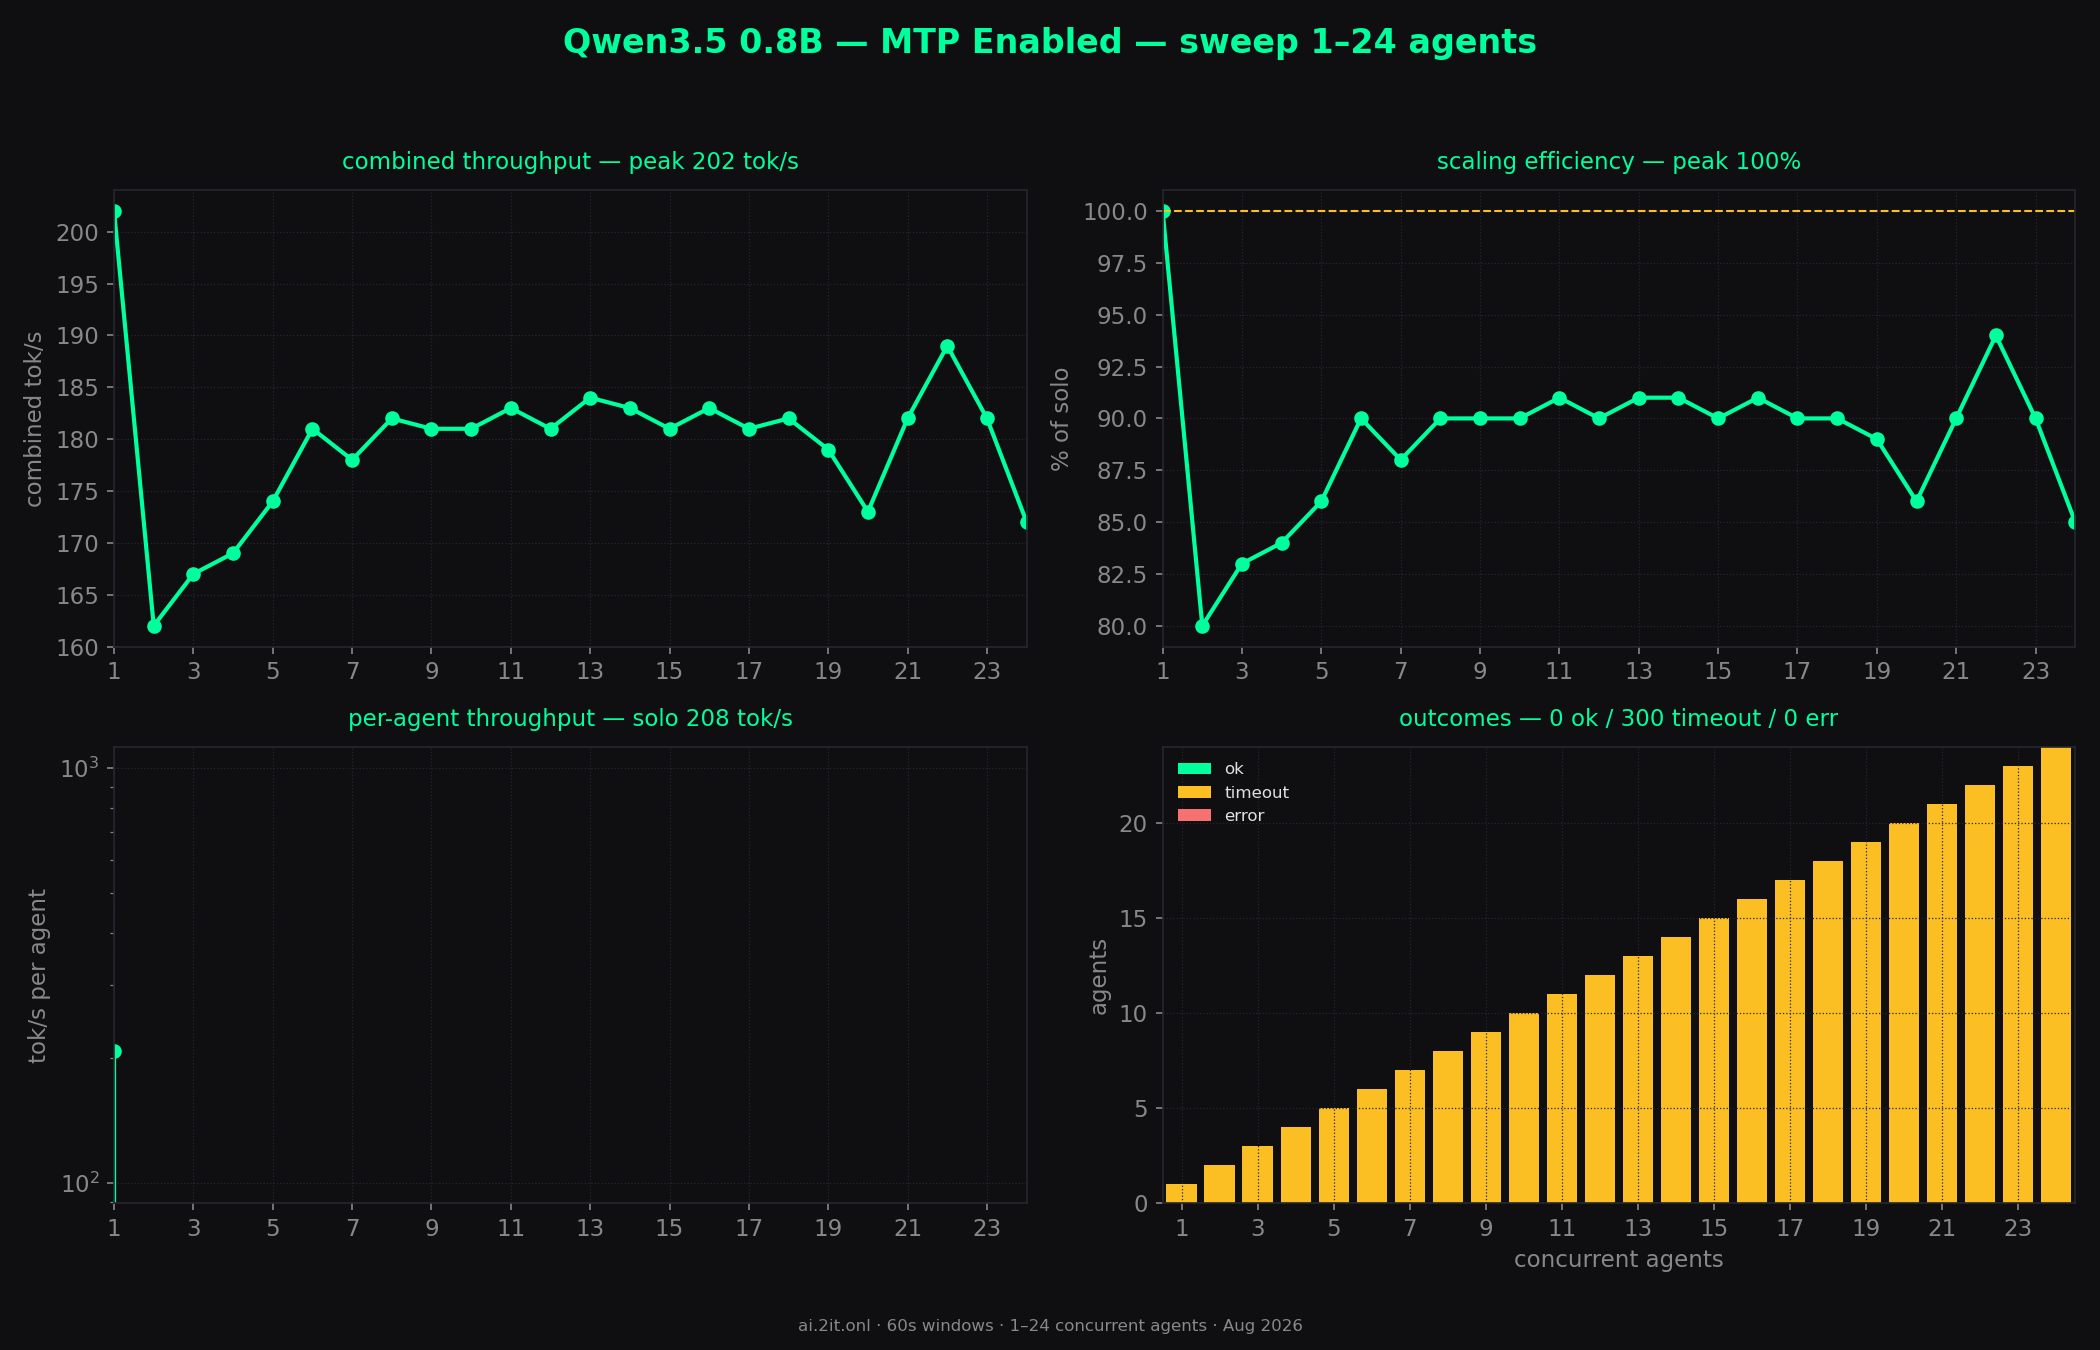
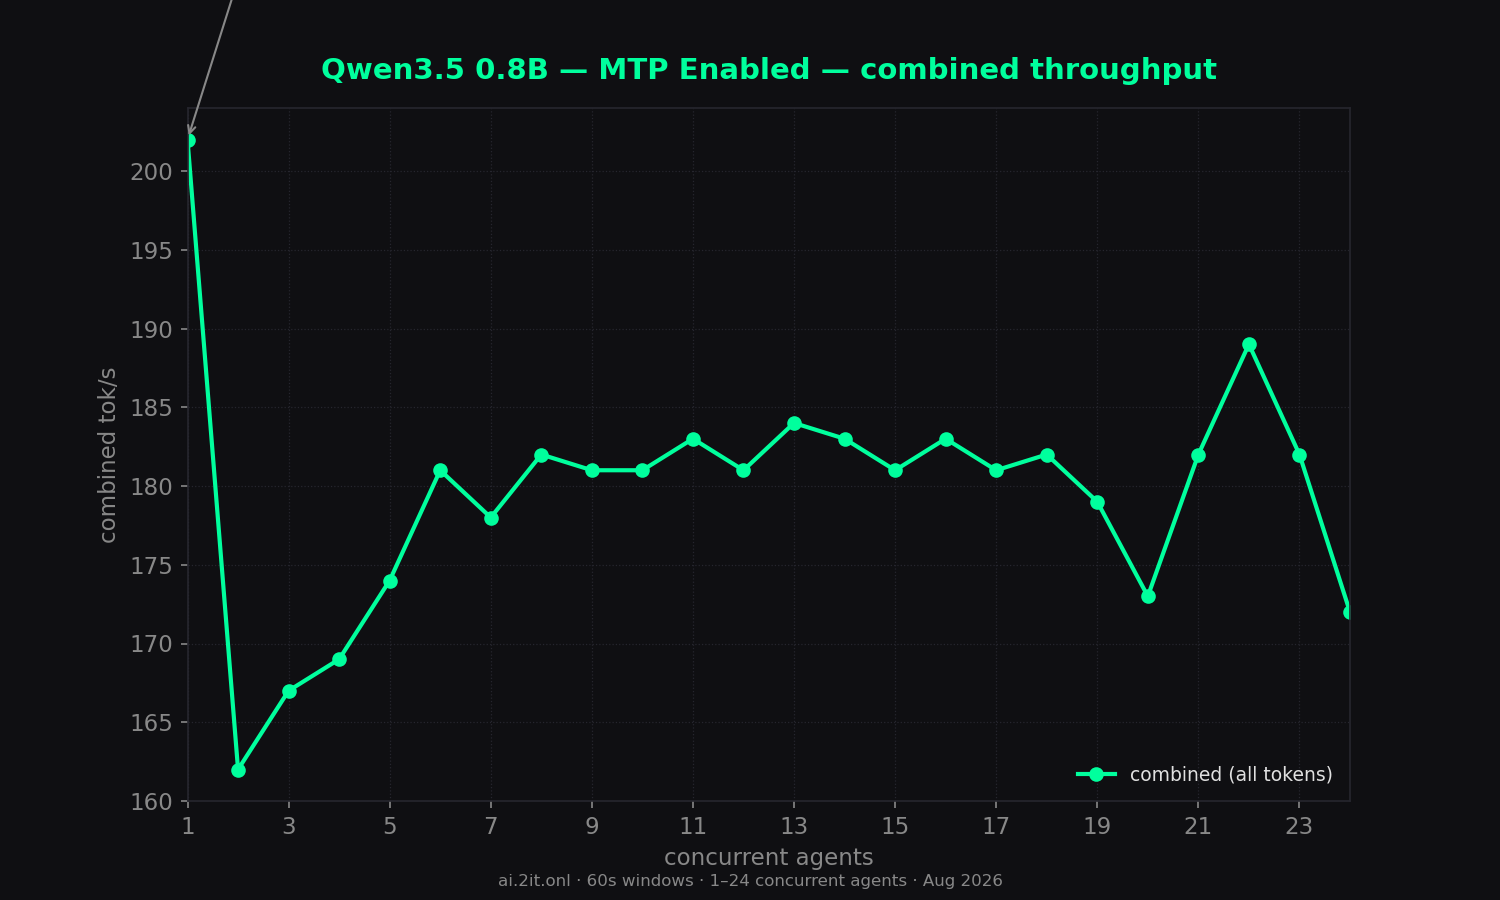
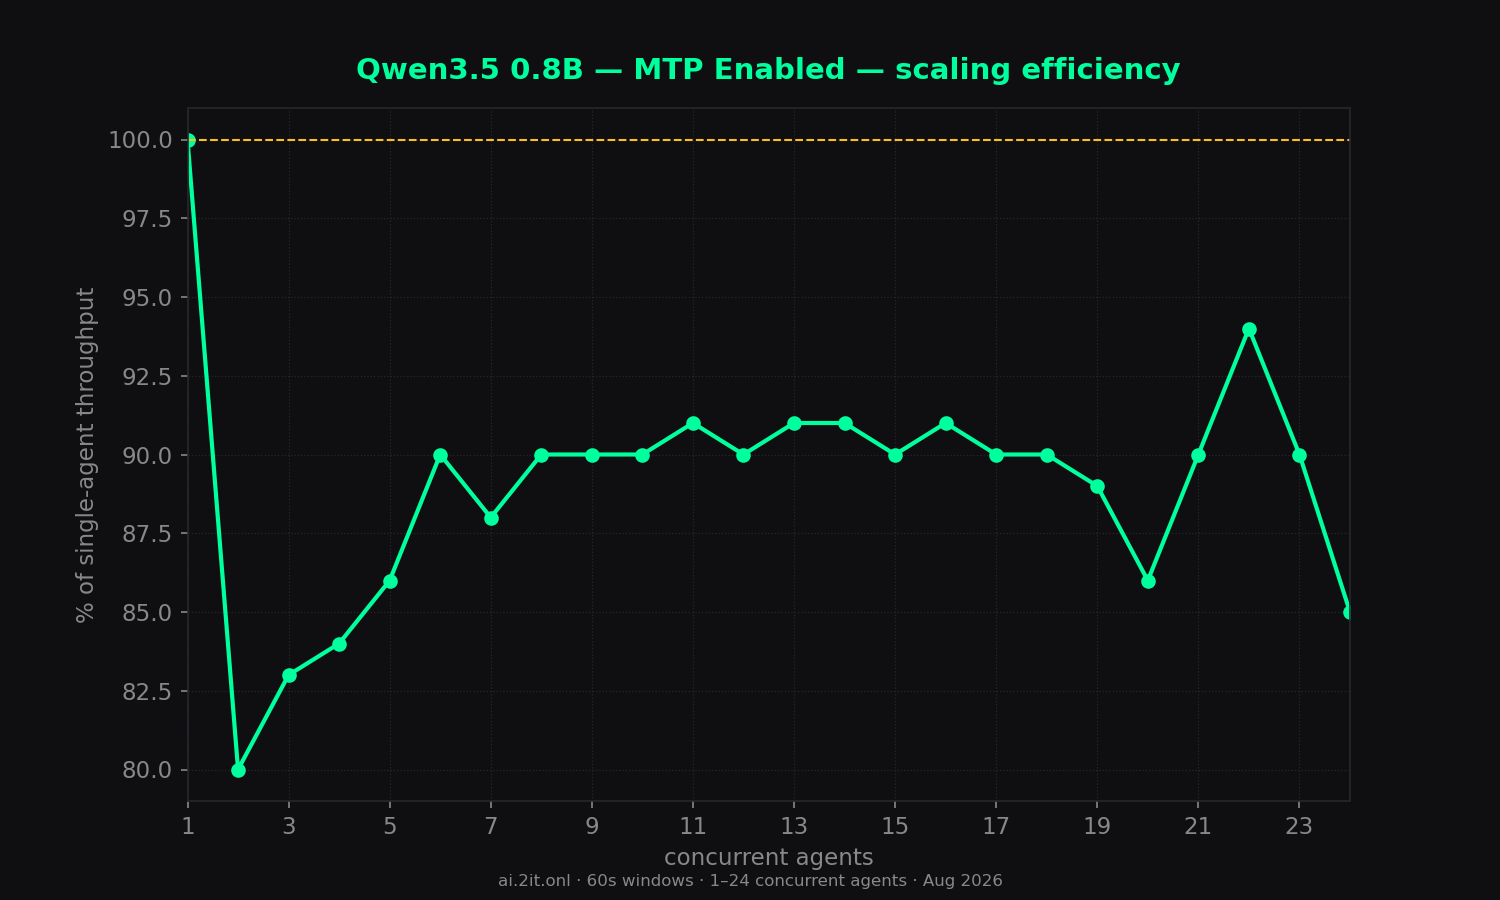
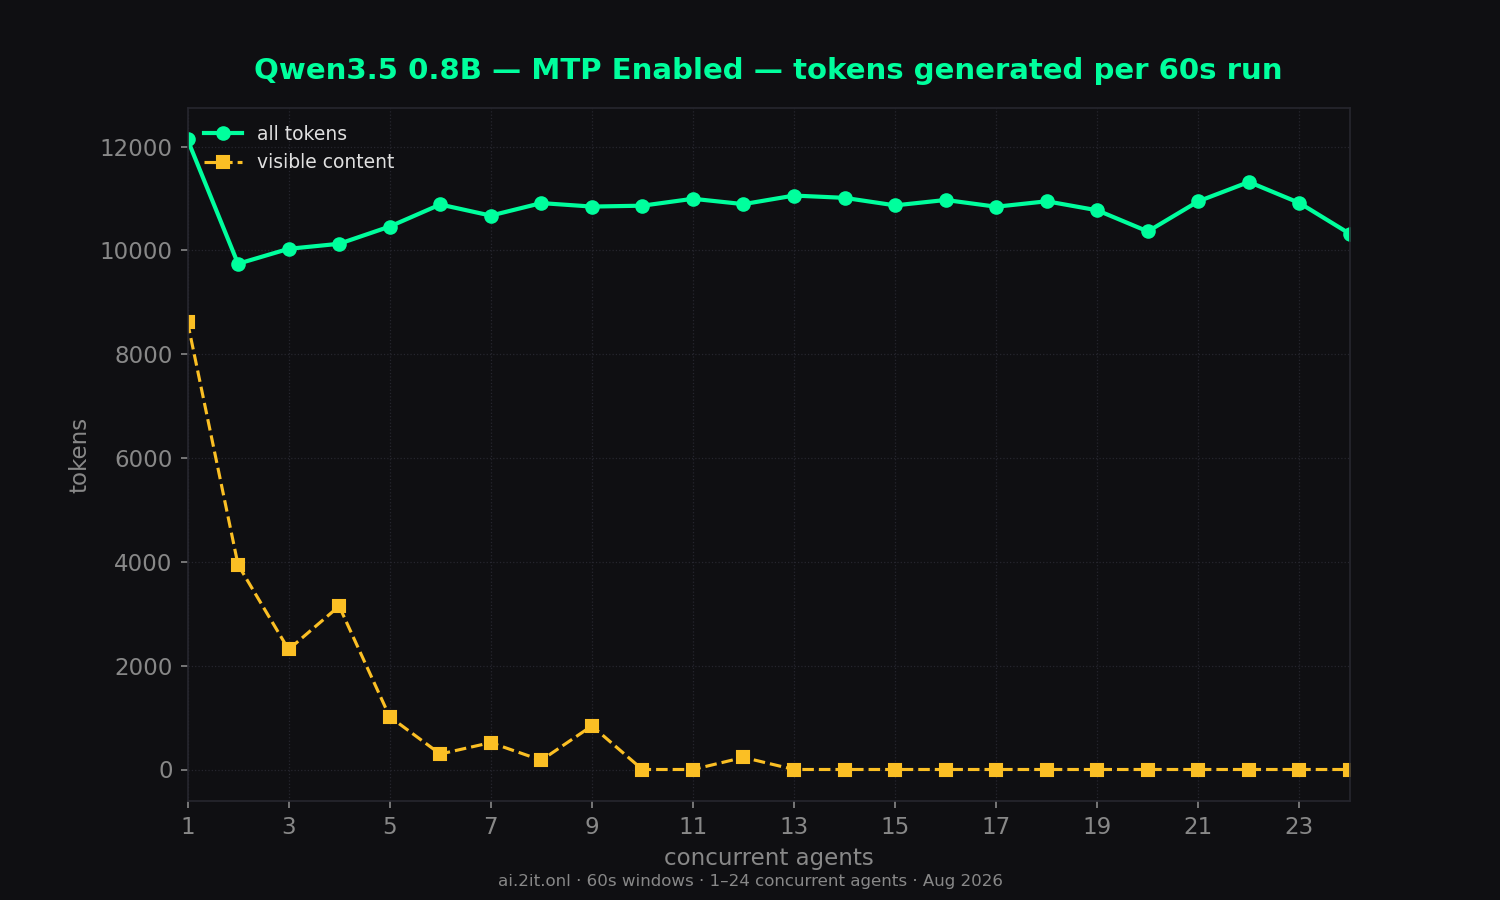
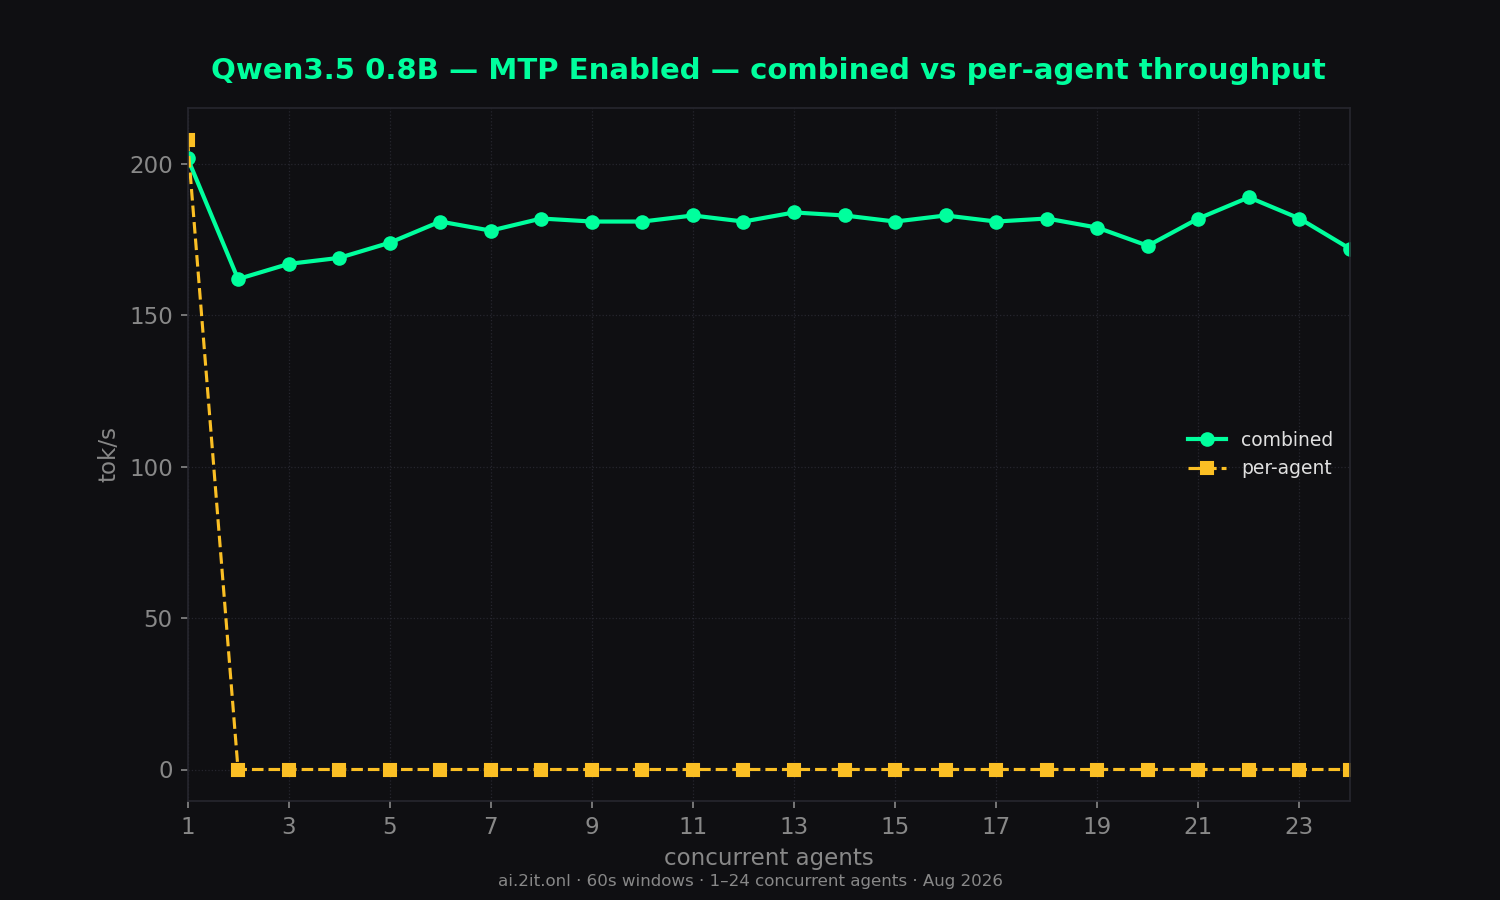
The cautionary tale: MTP serializes requests — flat ~180 tok/s at any concurrency and zero visible content from 10 agents up.
Key findings
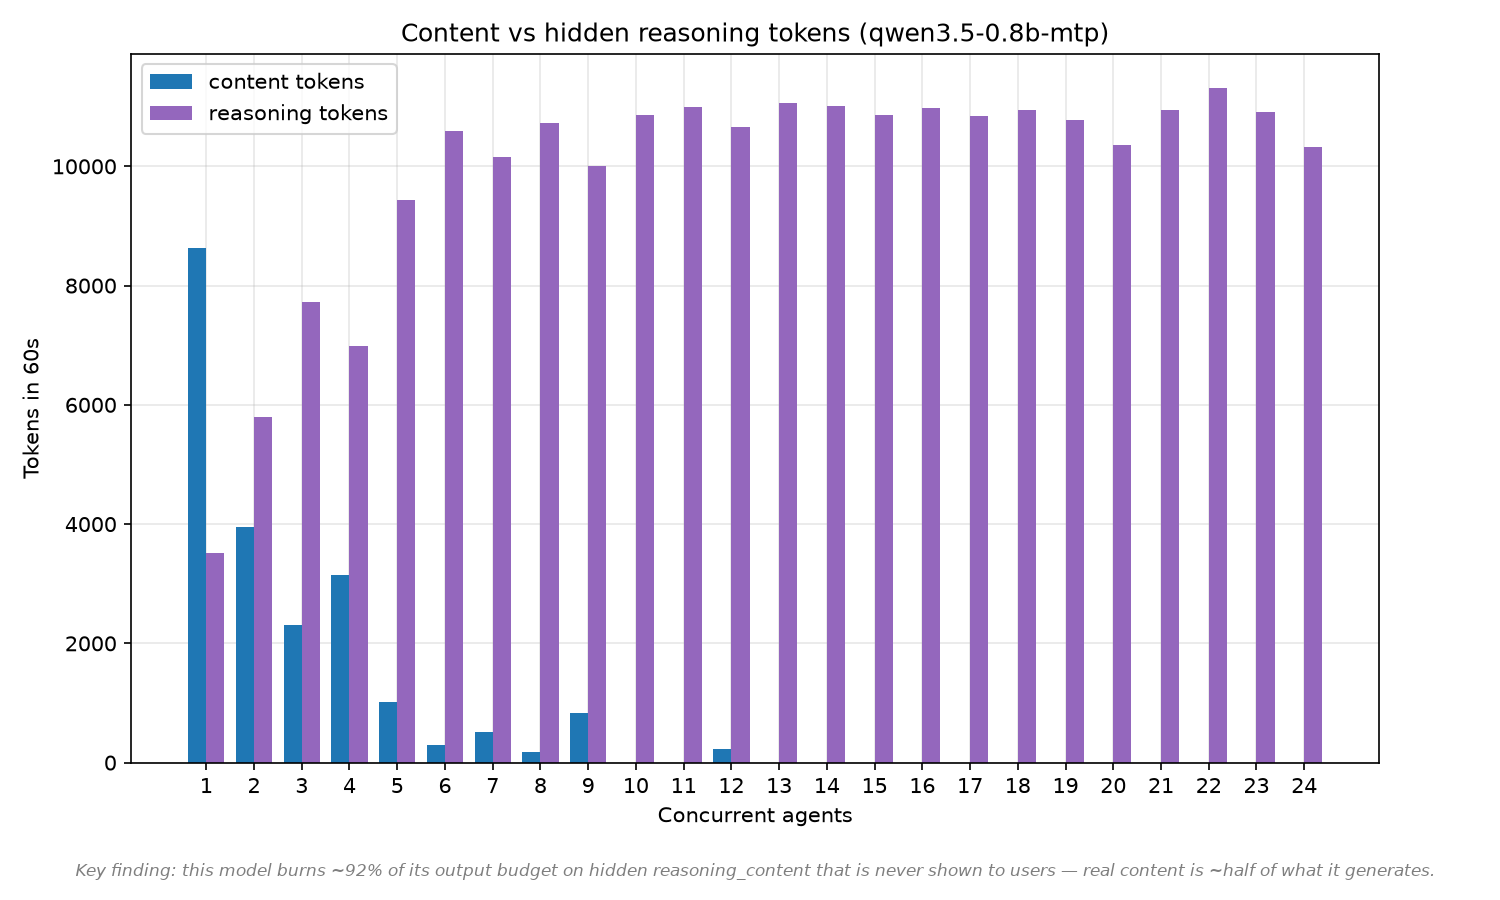
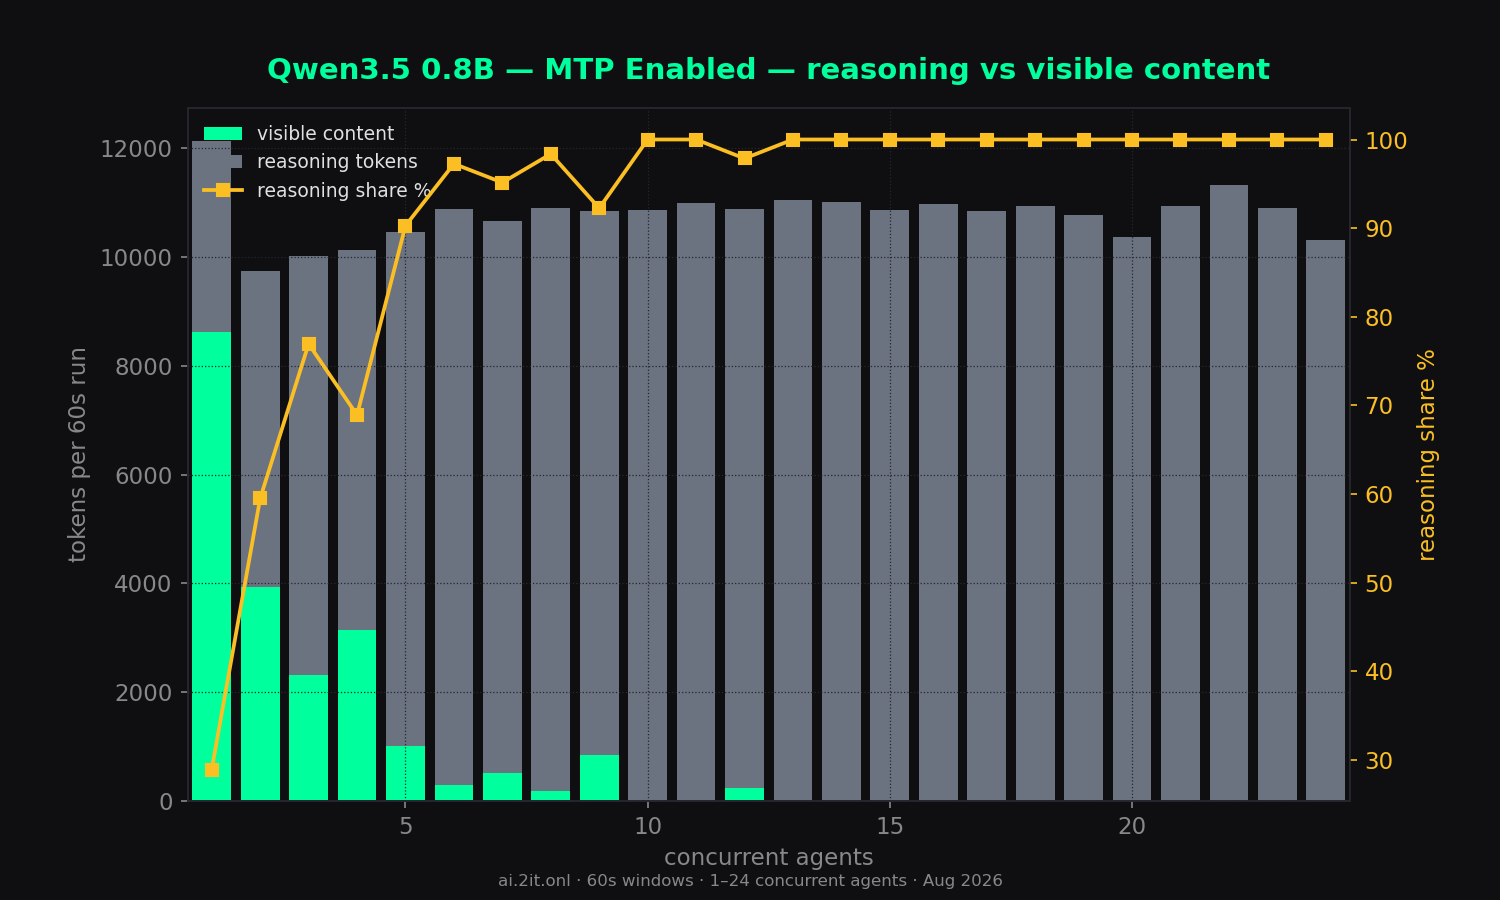
- No visible output under load: from concurrency ~10 up, agents produce zero content tokens in 60s — the entire budget goes to
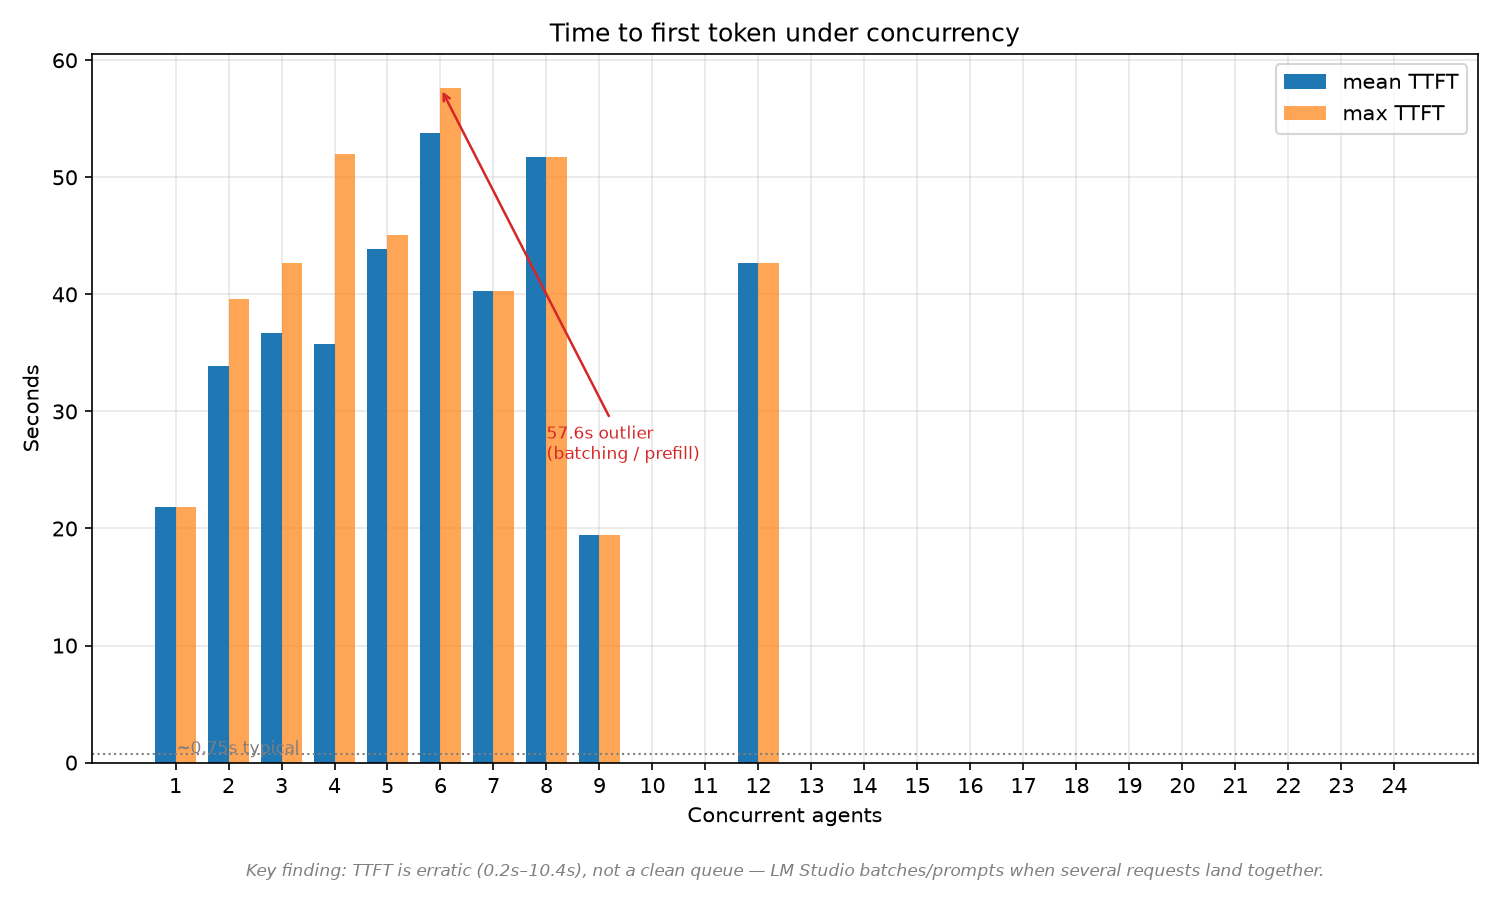
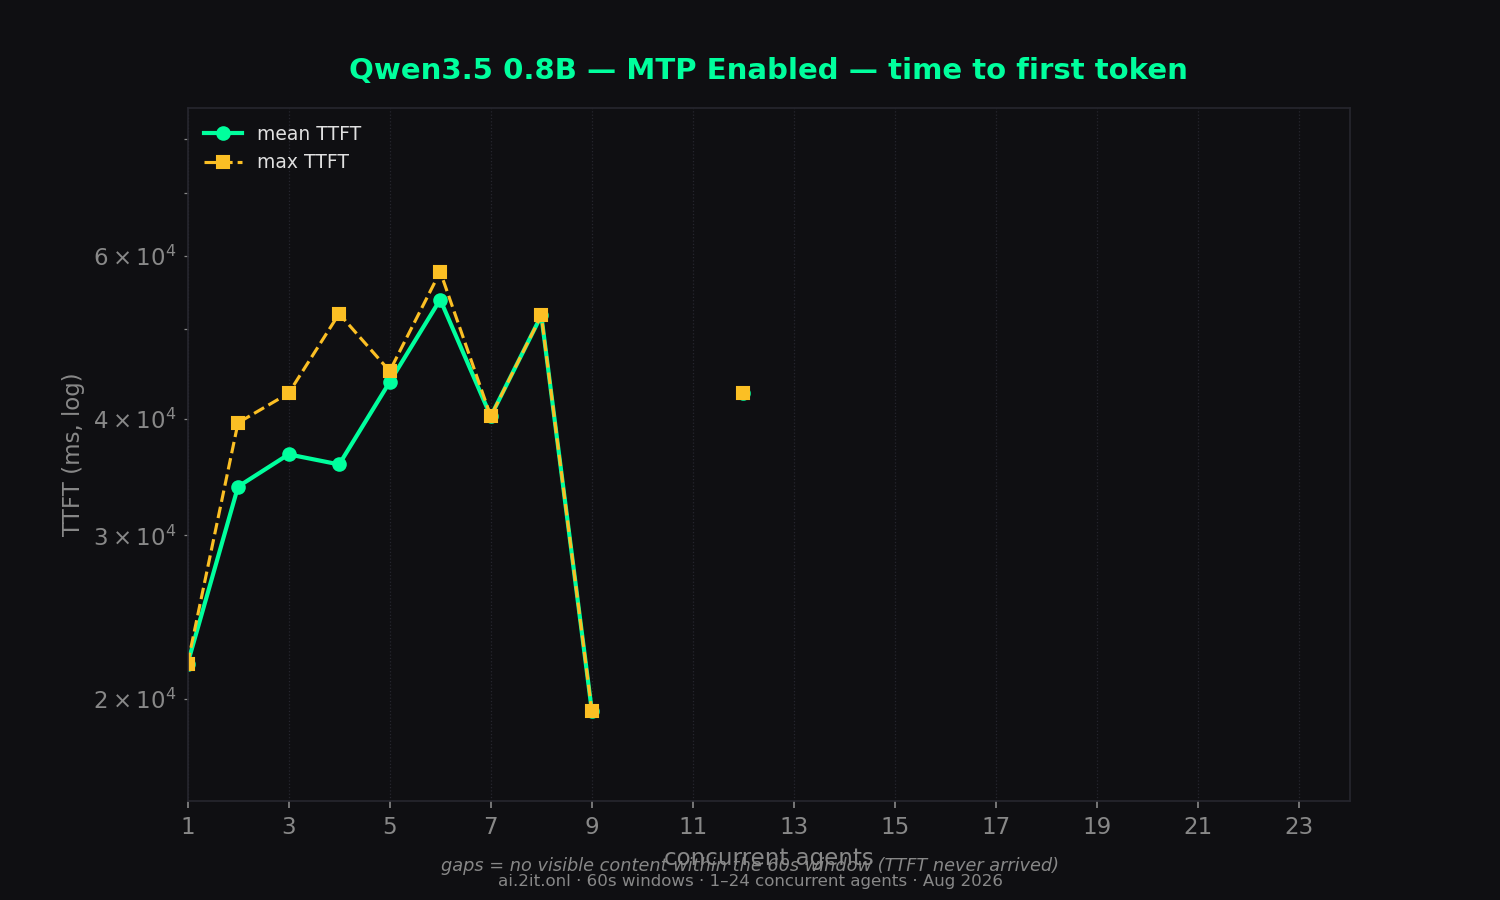
reasoning_content(all 10k+ tokens). Even the TTFT-to-first-content never arrives. - Massive reasoning preamble: even solo, first visible content takes ~22s and only appears after ~3.5k reasoning tokens. Probing a fresh request returned
content: ''with 100% reasoning. - Flat throughput — no concurrency scaling: combined (all-token) throughput is ~180 tok/s from 2 to 24 agents (202 solo). Total per run ≈ one stream's worth (~10–11k tokens). This is the signature of request serialization — consistent with MTP (multi-token prediction) using a decode path that LM Studio cannot batch, so every request queues on one slot. Concurrency adds only latency (TTFT 20–53s), never throughput.
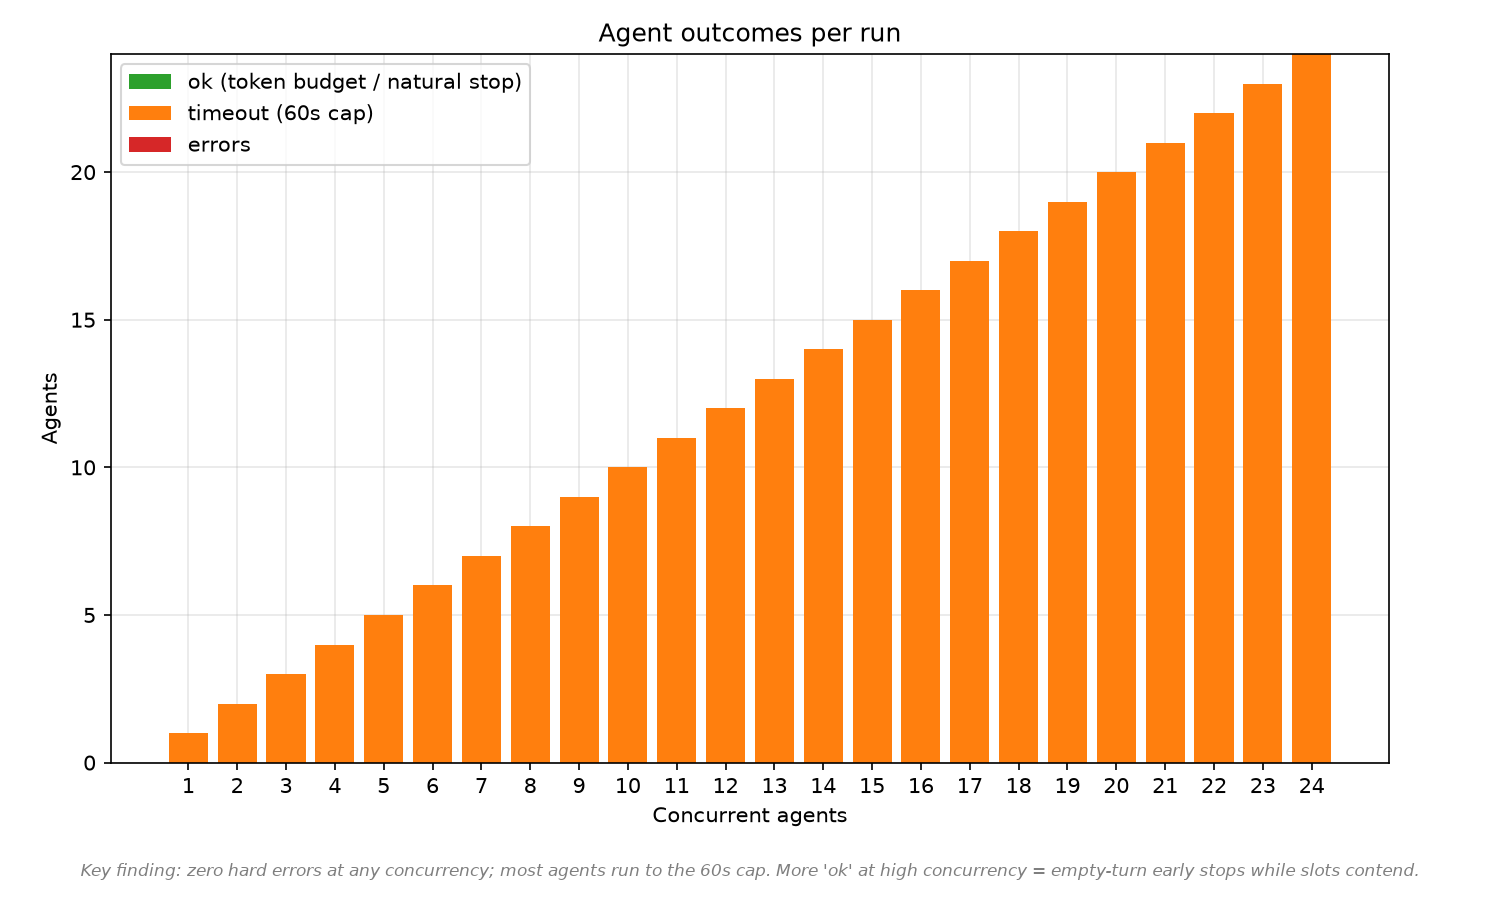
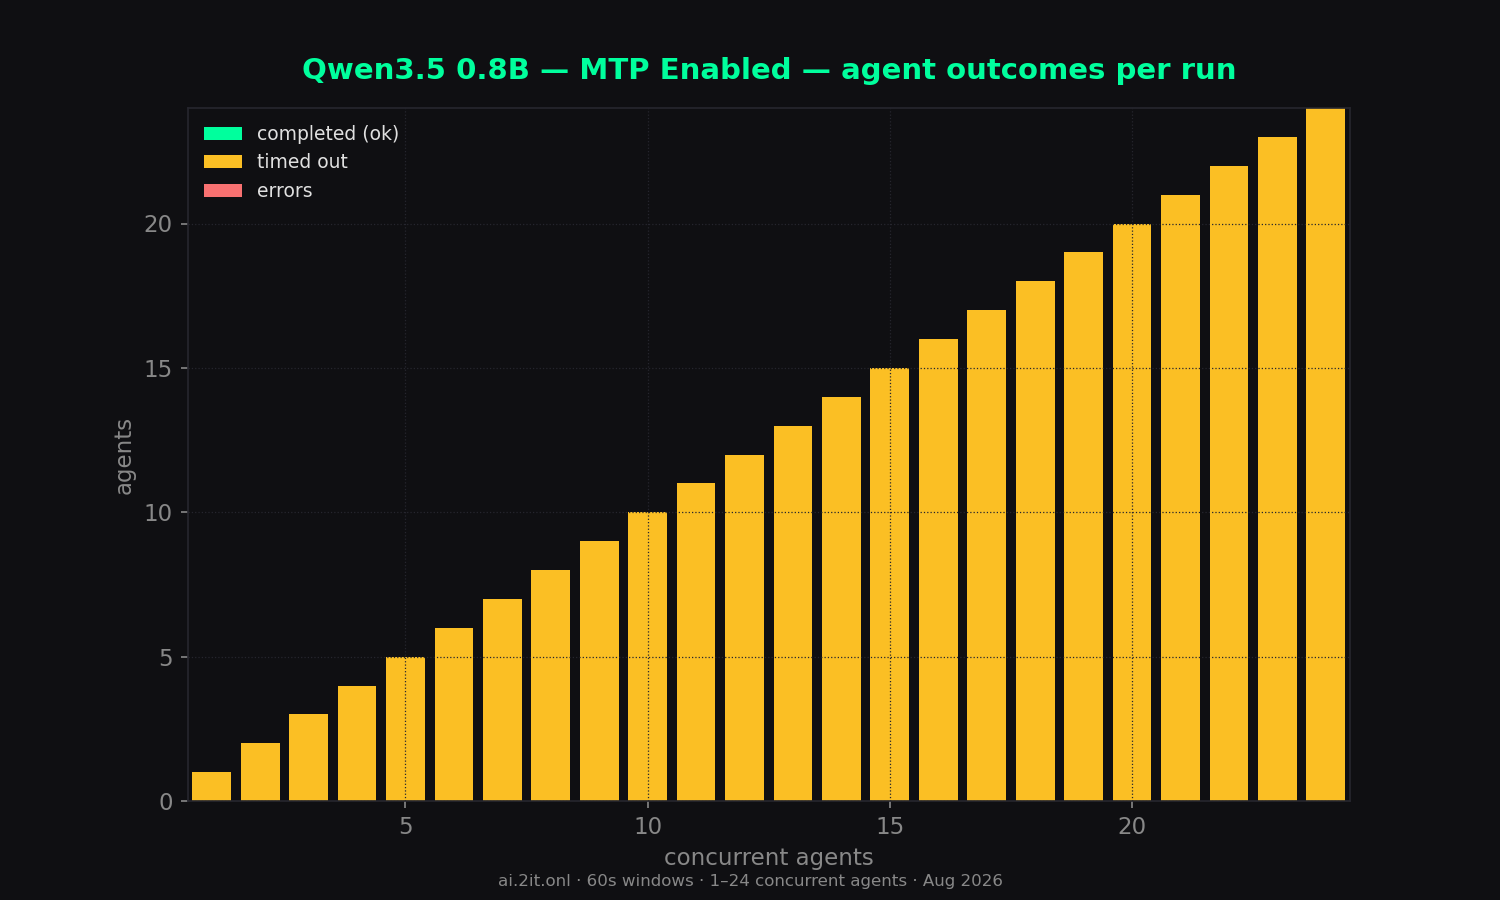
- Errors: 0 across all 24 runs — but the model is effectively unusable for the NPC/controller workload as served.
Sweep — total concurrency 1–24
| agents | wall (s) | content | reason | total | comb tok/s | comb all | per-agent | per-agent all | scale % | TTFT mean | TTFT max | ok | timeout | err |
|---|---|---|---|---|---|---|---|---|---|---|---|---|---|---|
| 1 peak | 60.0 | 8,623 | 3,513 | 12,136 | 144 | 202 | 235.3 | 208.1 | 100% | 21.8s | 21.8s | 0 | 1 | 0 |
| 2 | 60.0 | 3,944 | 5,798 | 9,742 | 66 | 162 | 0.0 | 0.0 | 80% | 33.8s | 39.6s | 0 | 2 | 0 |
| 3 | 60.0 | 2,312 | 7,718 | 10,030 | 39 | 167 | 0.0 | 0.0 | 83% | 36.7s | 42.7s | 0 | 3 | 0 |
| 4 | 60.0 | 3,147 | 6,980 | 10,127 | 52 | 169 | 0.0 | 0.0 | 84% | 35.8s | 52.0s | 0 | 4 | 0 |
| 5 | 60.0 | 1,017 | 9,442 | 10,459 | 17 | 174 | 0.0 | 0.0 | 86% | 43.9s | 45.1s | 0 | 5 | 0 |
| 6 | 60.0 | 298 | 10,586 | 10,884 | 5 | 181 | 0.0 | 0.0 | 90% | 53.8s | 57.7s | 0 | 6 | 0 |
| 7 | 60.0 | 518 | 10,152 | 10,670 | 9 | 178 | 0.0 | 0.0 | 88% | 40.3s | 40.3s | 0 | 7 | 0 |
| 8 | 60.0 | 178 | 10,733 | 10,911 | 3 | 182 | 0.0 | 0.0 | 90% | 51.7s | 51.7s | 0 | 8 | 0 |
| 9 | 60.0 | 840 | 10,004 | 10,844 | 14 | 181 | 0.0 | 0.0 | 90% | 19.4s | 19.4s | 0 | 9 | 0 |
| 10 | 60.0 | 0 | 10,861 | 10,861 | 0 | 181 | 0.0 | 0.0 | 90% | — | — | 0 | 10 | 0 |
| 11 | 60.0 | 0 | 10,994 | 10,994 | 0 | 183 | 0.0 | 0.0 | 91% | — | — | 0 | 11 | 0 |
| 12 | 60.0 | 233 | 10,658 | 10,891 | 4 | 181 | 0.0 | 0.0 | 90% | 42.7s | 42.7s | 0 | 12 | 0 |
| 13 | 60.0 | 0 | 11,056 | 11,056 | 0 | 184 | 0.0 | 0.0 | 91% | — | — | 0 | 13 | 0 |
| 14 | 60.0 | 0 | 11,012 | 11,012 | 0 | 183 | 0.0 | 0.0 | 91% | — | — | 0 | 14 | 0 |
| 15 | 60.0 | 0 | 10,867 | 10,867 | 0 | 181 | 0.0 | 0.0 | 90% | — | — | 0 | 15 | 0 |
| 16 | 60.0 | 0 | 10,971 | 10,971 | 0 | 183 | 0.0 | 0.0 | 91% | — | — | 0 | 16 | 0 |
| 17 | 60.0 | 0 | 10,841 | 10,841 | 0 | 181 | 0.0 | 0.0 | 90% | — | — | 0 | 17 | 0 |
| 18 | 60.0 | 0 | 10,946 | 10,946 | 0 | 182 | 0.0 | 0.0 | 90% | — | — | 0 | 18 | 0 |
| 19 | 60.0 | 0 | 10,772 | 10,772 | 0 | 179 | 0.0 | 0.0 | 89% | — | — | 0 | 19 | 0 |
| 20 | 60.0 | 0 | 10,365 | 10,365 | 0 | 173 | 0.0 | 0.0 | 86% | — | — | 0 | 20 | 0 |
| 21 | 60.0 | 0 | 10,946 | 10,946 | 0 | 182 | 0.0 | 0.0 | 90% | — | — | 0 | 21 | 0 |
| 22 | 60.0 | 0 | 11,318 | 11,318 | 0 | 189 | 0.0 | 0.0 | 94% | — | — | 0 | 22 | 0 |
| 23 | 60.0 | 0 | 10,913 | 10,913 | 0 | 182 | 0.0 | 0.0 | 90% | — | — | 0 | 23 | 0 |
| 24 | 60.0 | 0 | 10,317 | 10,317 | 0 | 172 | 0.0 | 0.0 | 85% | — | — | 0 | 24 | 0 |
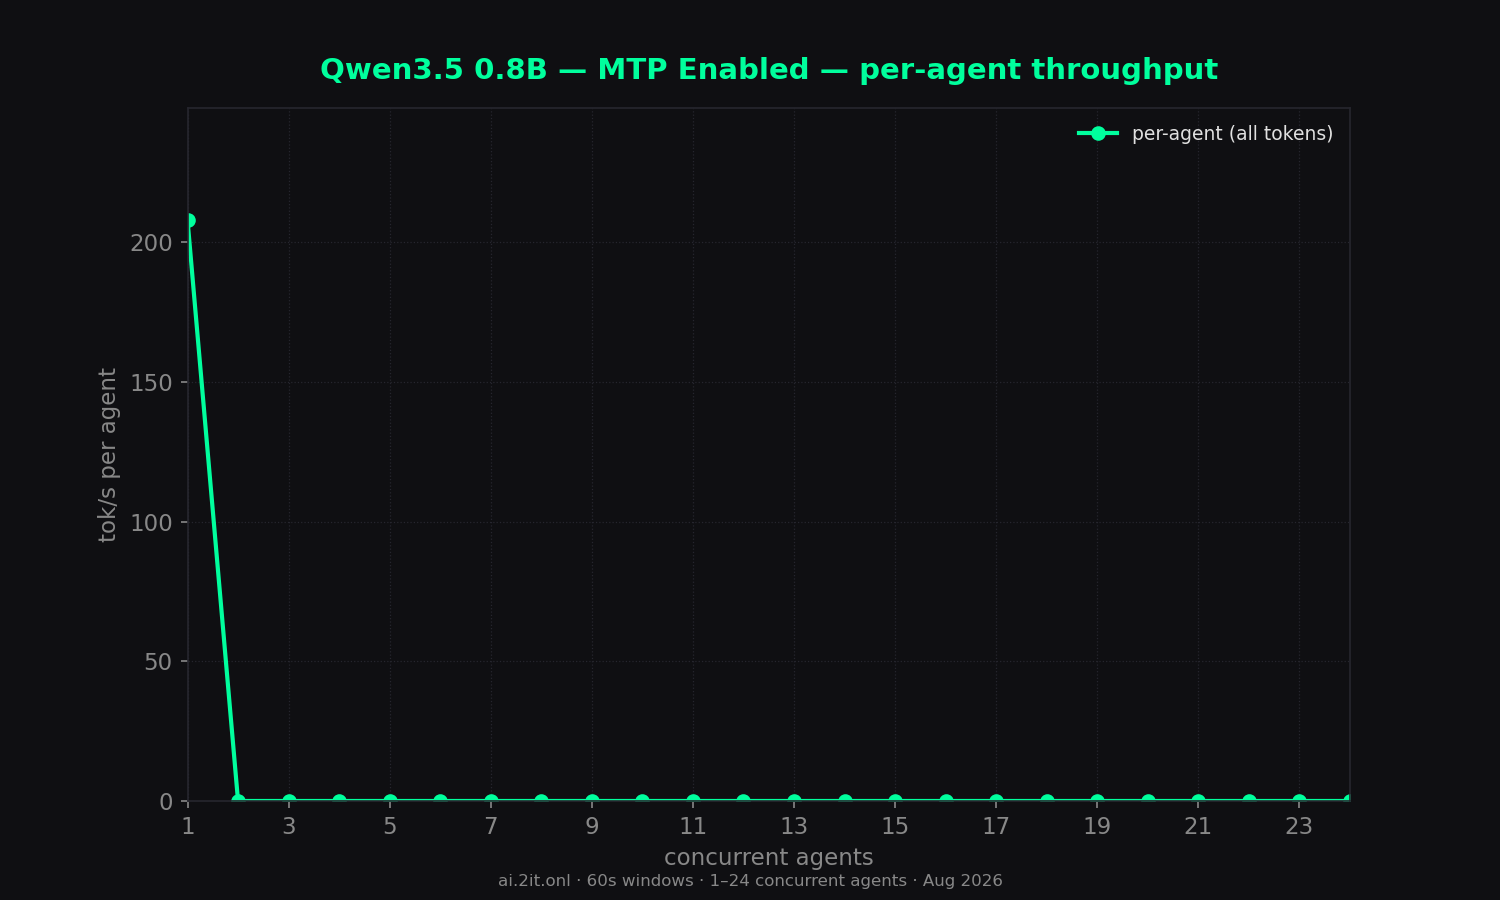
* burst artifact — agents queued ~11–16s then generated in a short burst; the per-agent timer inflates the number. Trust combined throughput and TTFT columns. Peak row = highest combined (all-token) throughput.
Charts
Raw data & downloads
- report.md6 KB
- sweep-summary.csv2 KB
- sweep-summary.json10 KB
- combined_throughput.png118 KB · original matplotlib export
- combined_vs_per_agent.png83 KB · original matplotlib export
- dashboard_1_24.png157 KB · original matplotlib export
- outcome_breakdown.png57 KB · original matplotlib export
- per_agent_throughput.png93 KB · original matplotlib export
- reasoning_vs_content.png60 KB · original matplotlib export
- scaling_efficiency.png77 KB · original matplotlib export
- time_to_first_token.png67 KB · original matplotlib export
- total_tokens_generated.png79 KB · original matplotlib export