Qwen-DeepSeek 1.5B Agentic Distill
server model id:
qwen-deepseek-1.5b-agentic-distillthinkingKV F16ctx 32k1.5B params
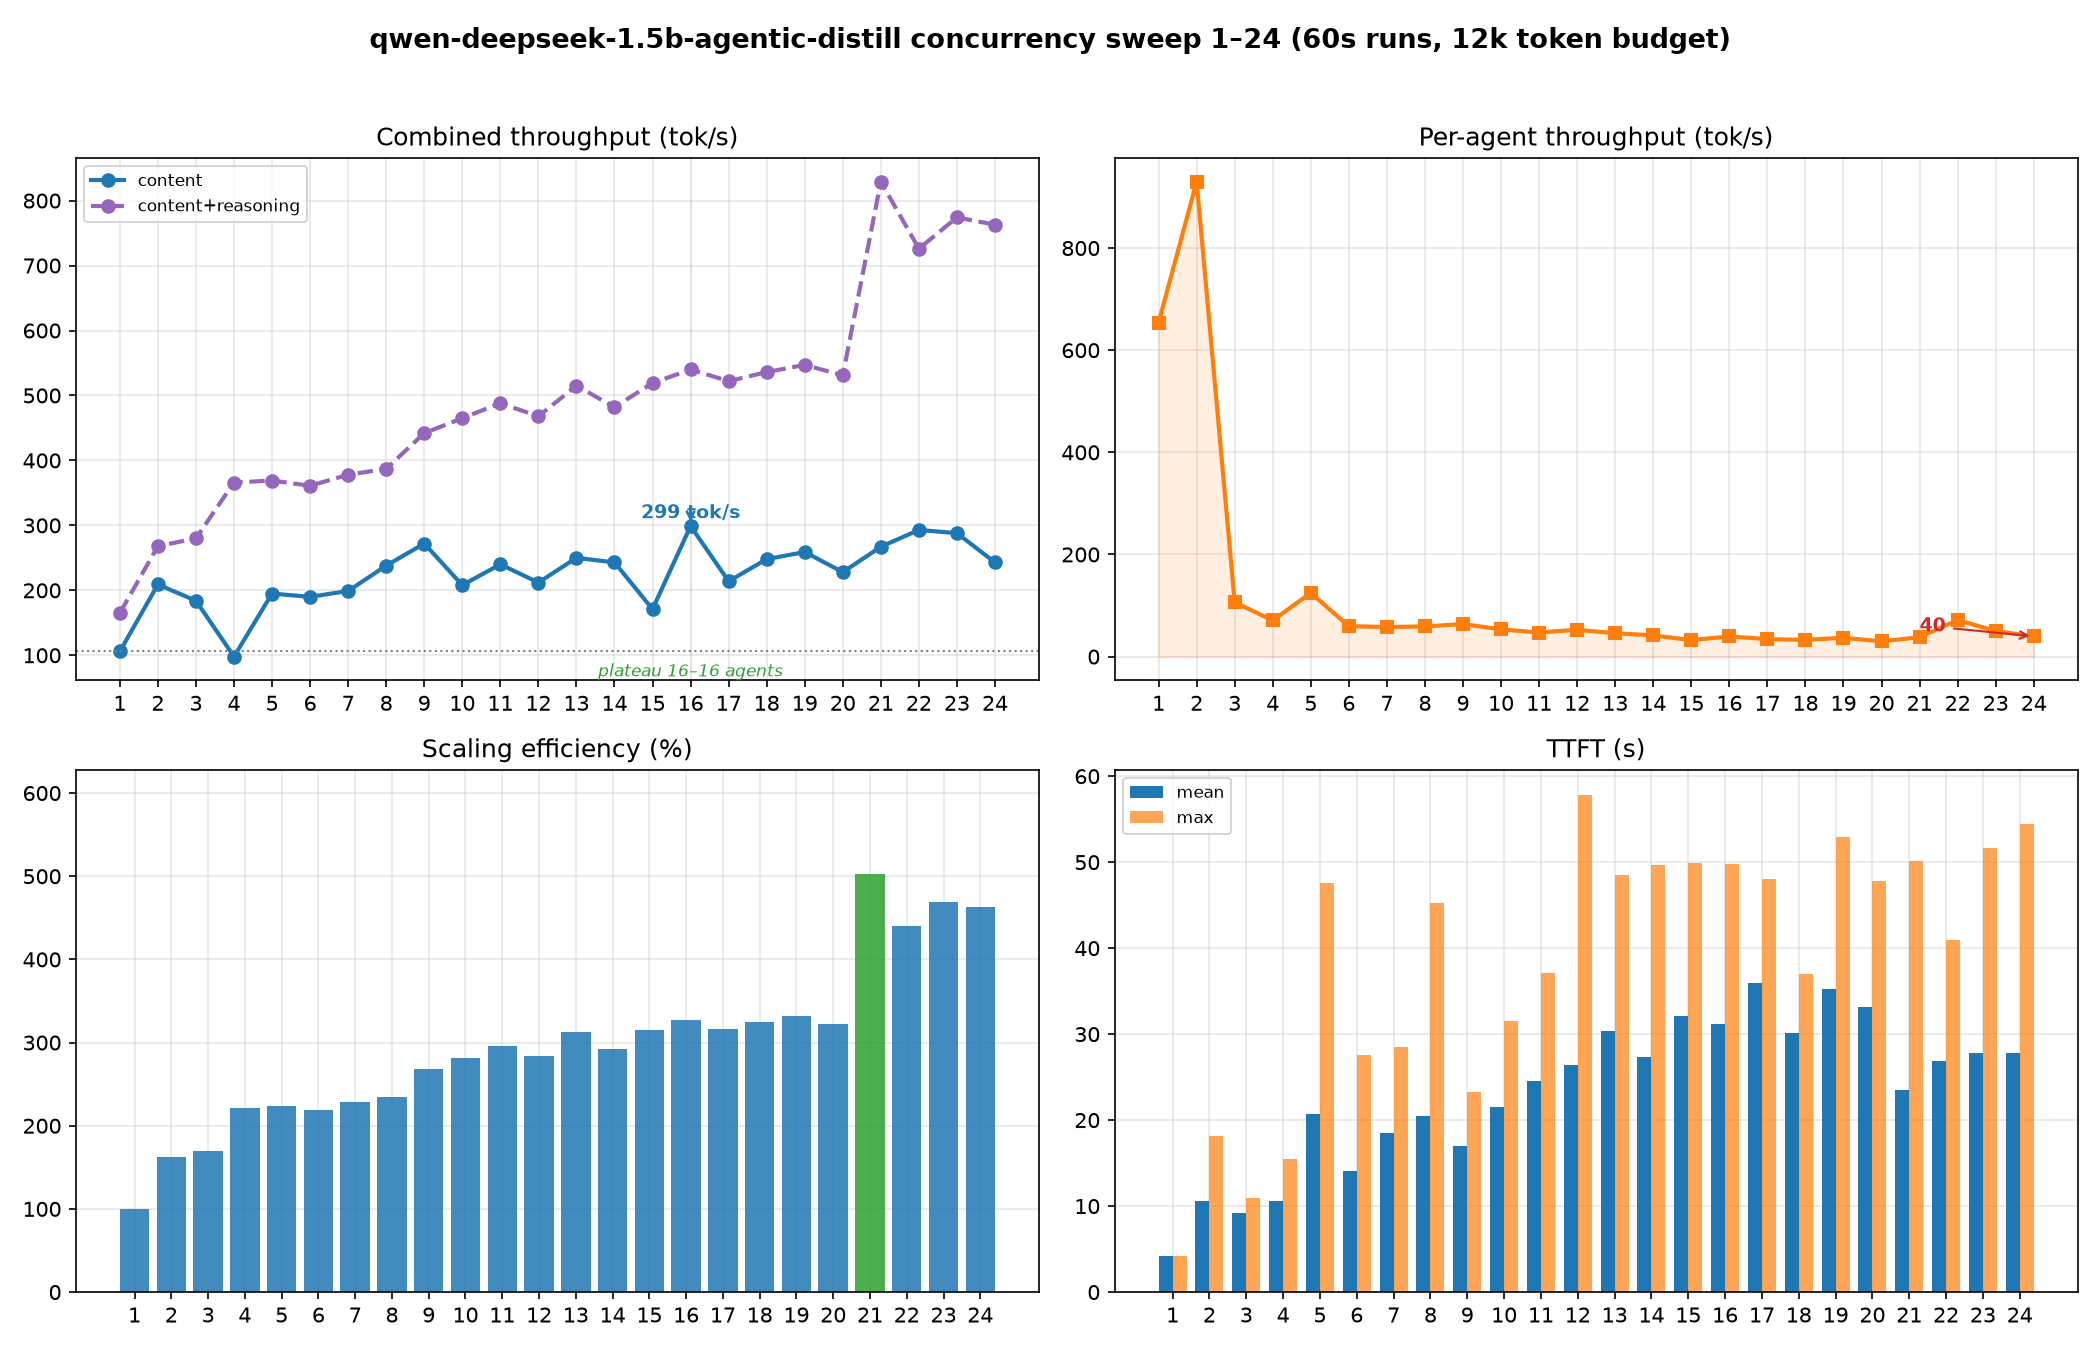
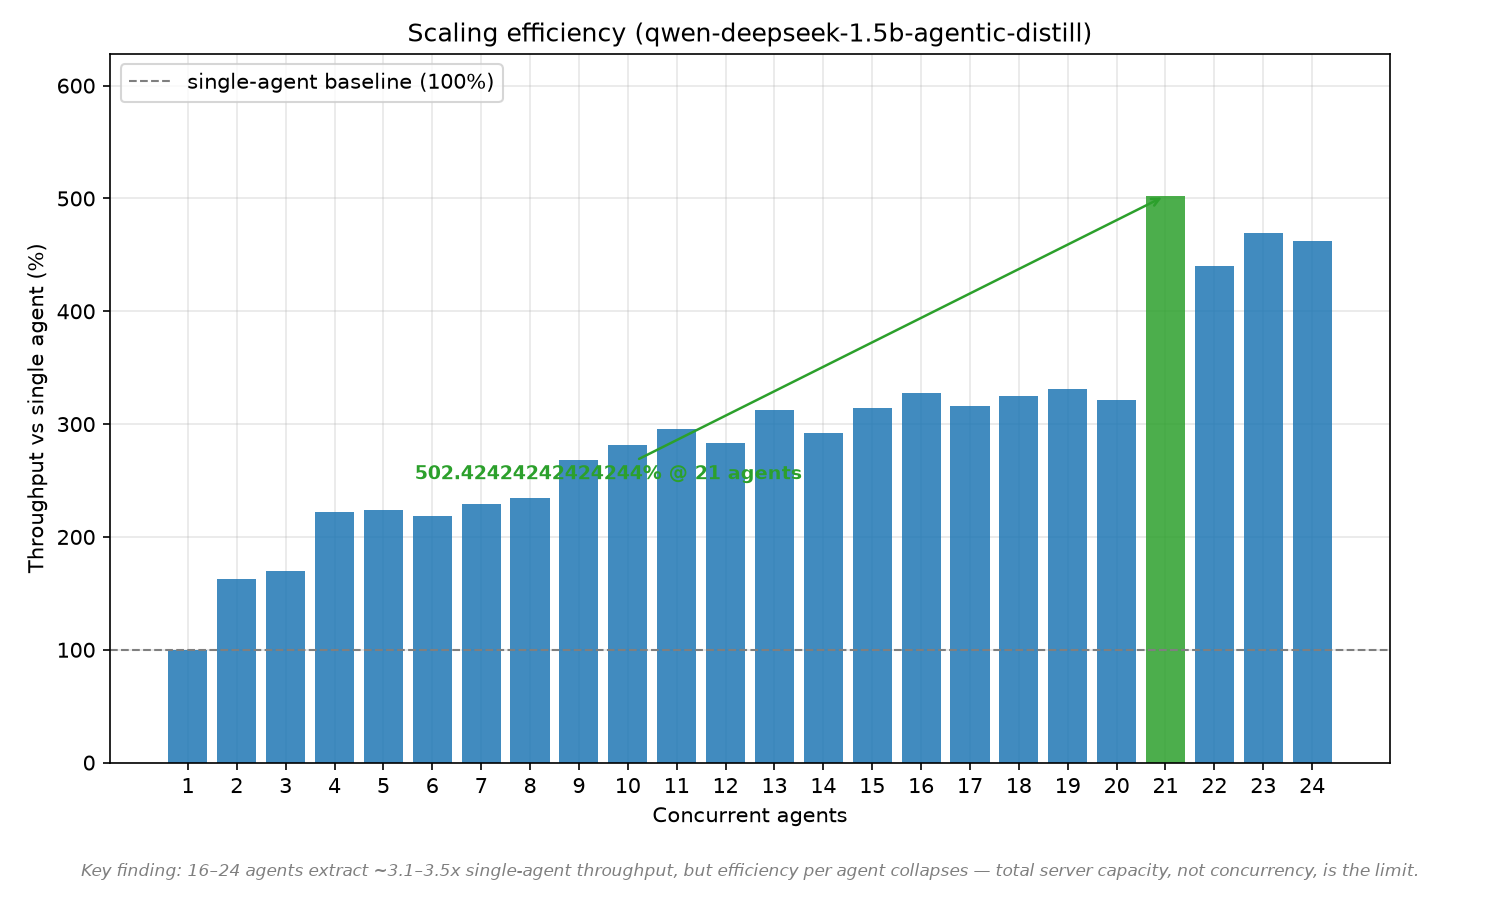
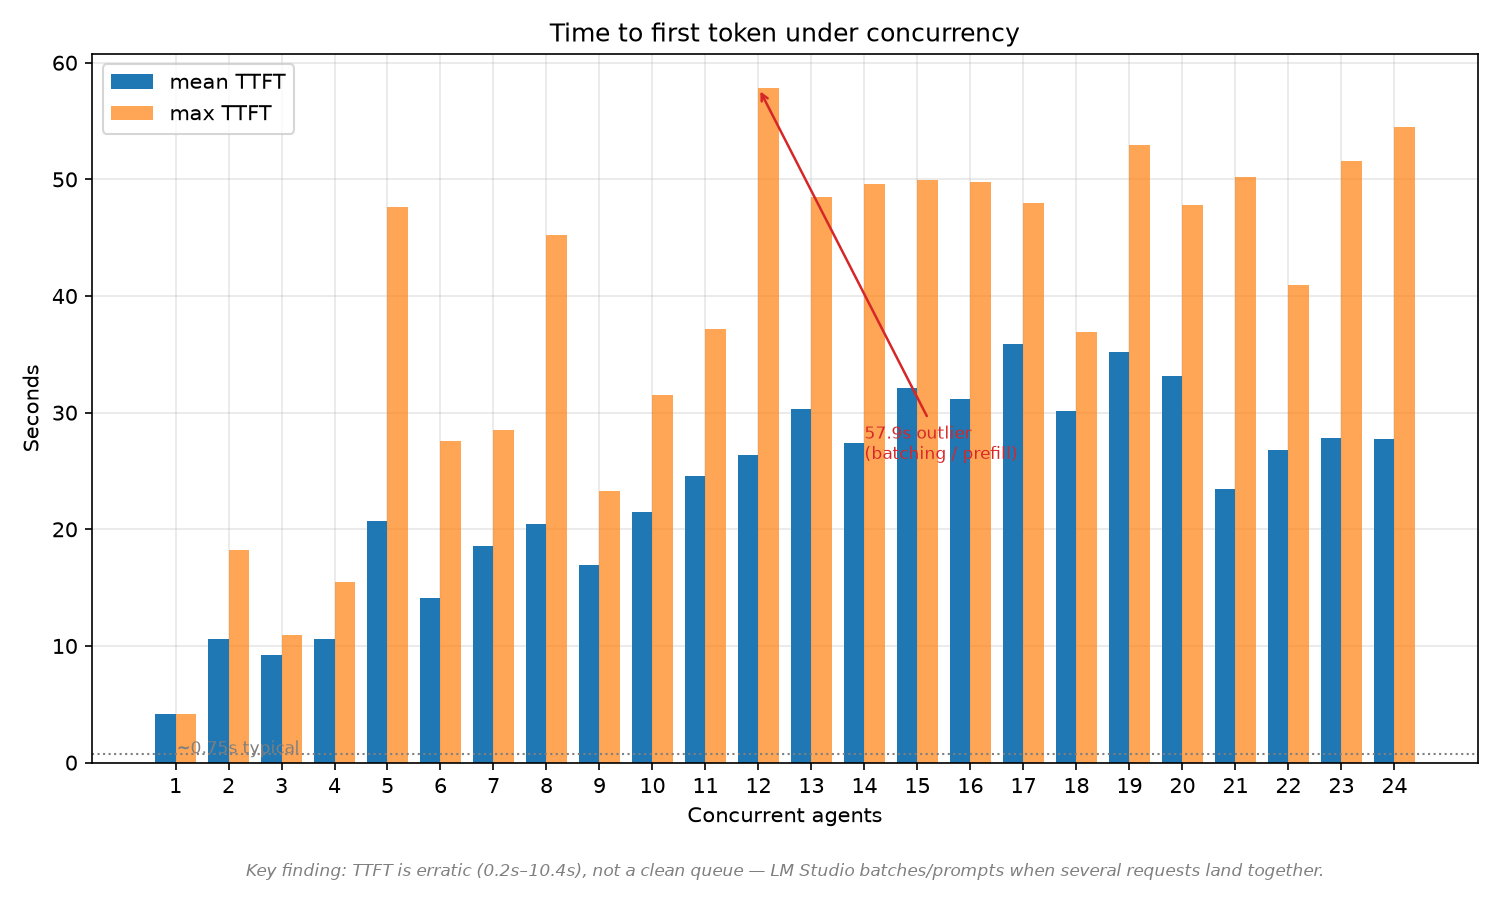
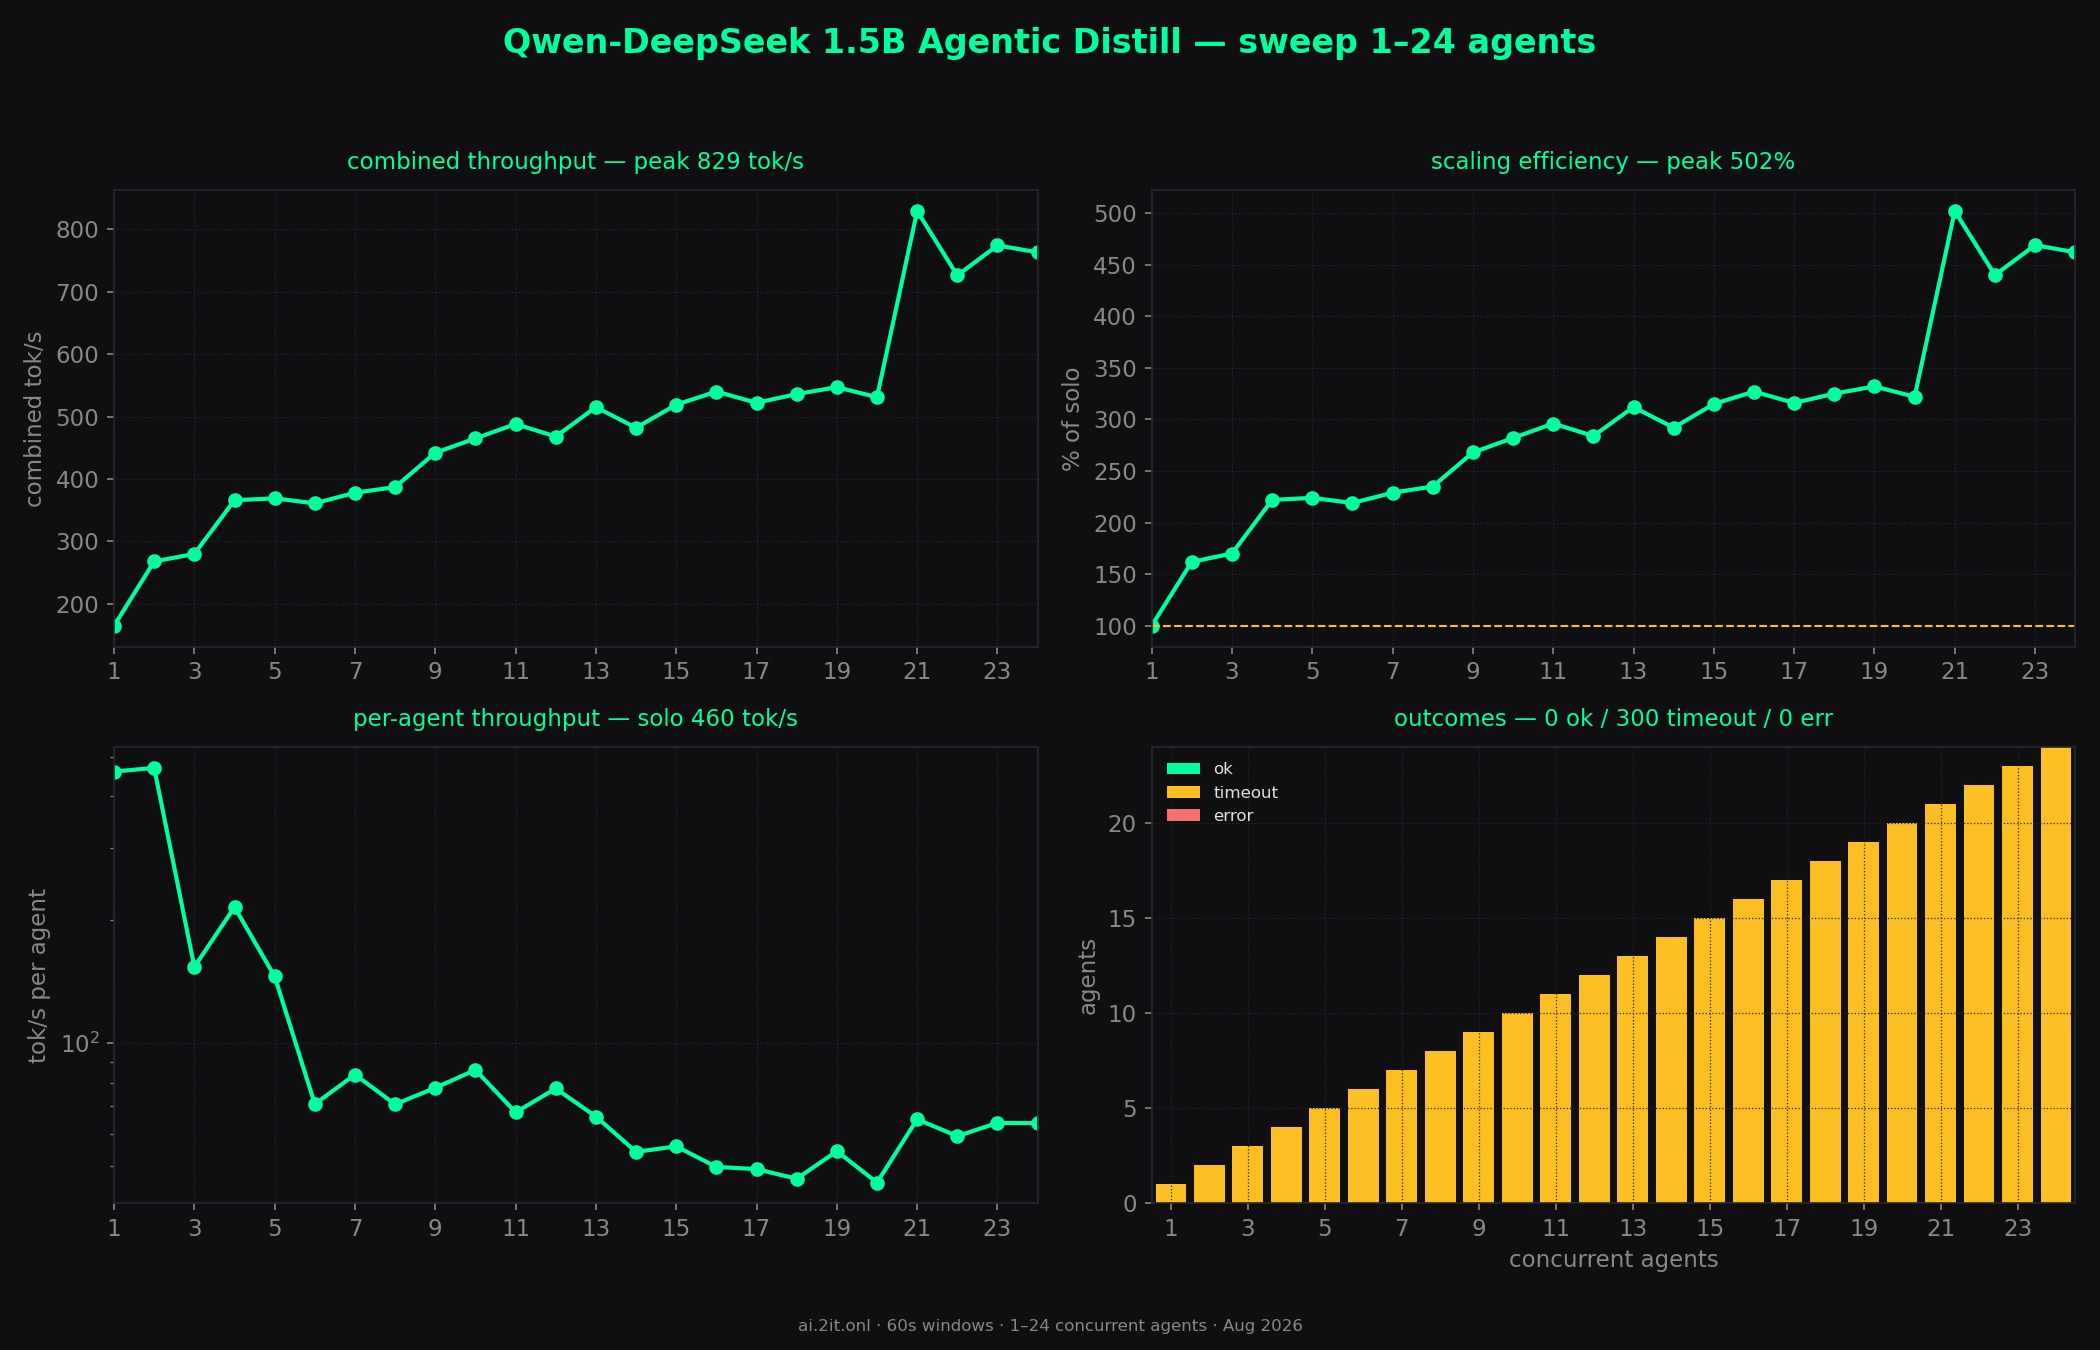
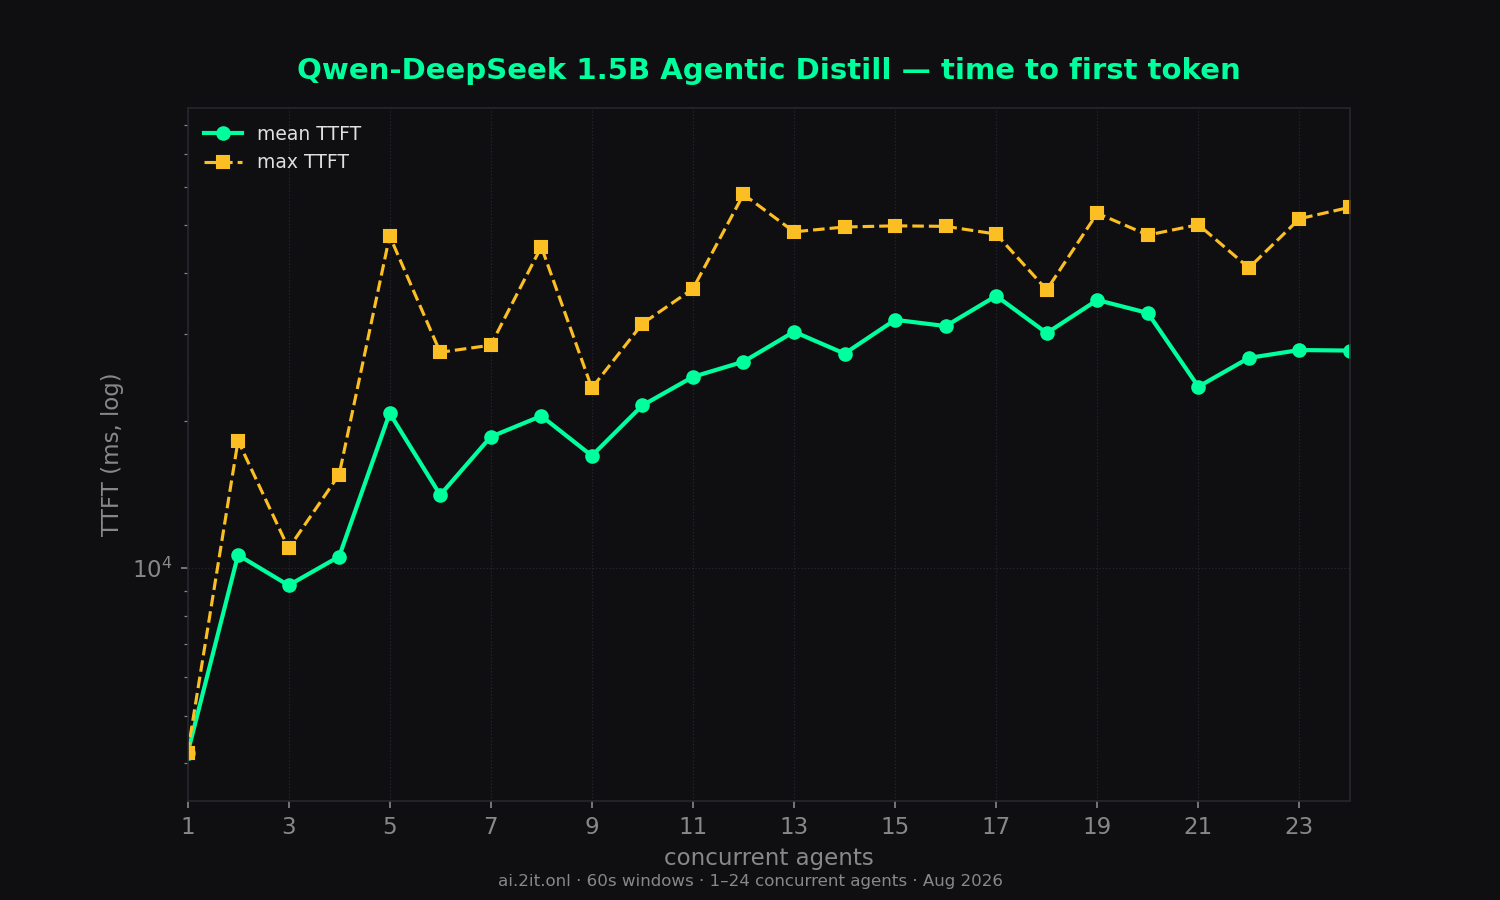
Best scaling efficiency (5.0x) but the worst TTFT profile — 20–58s to first token under load.
Key findings
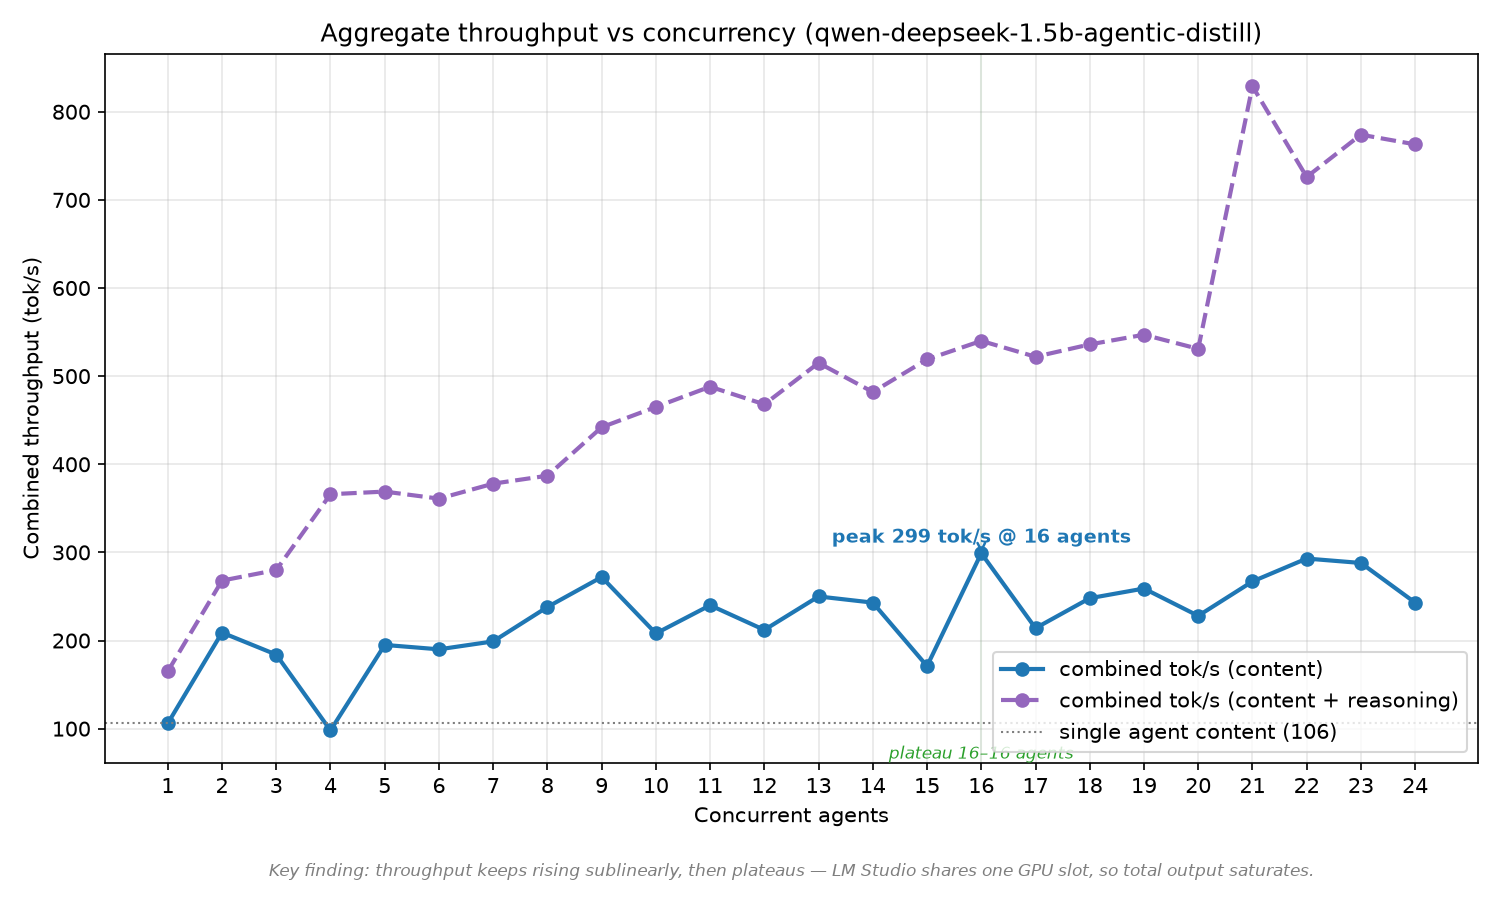
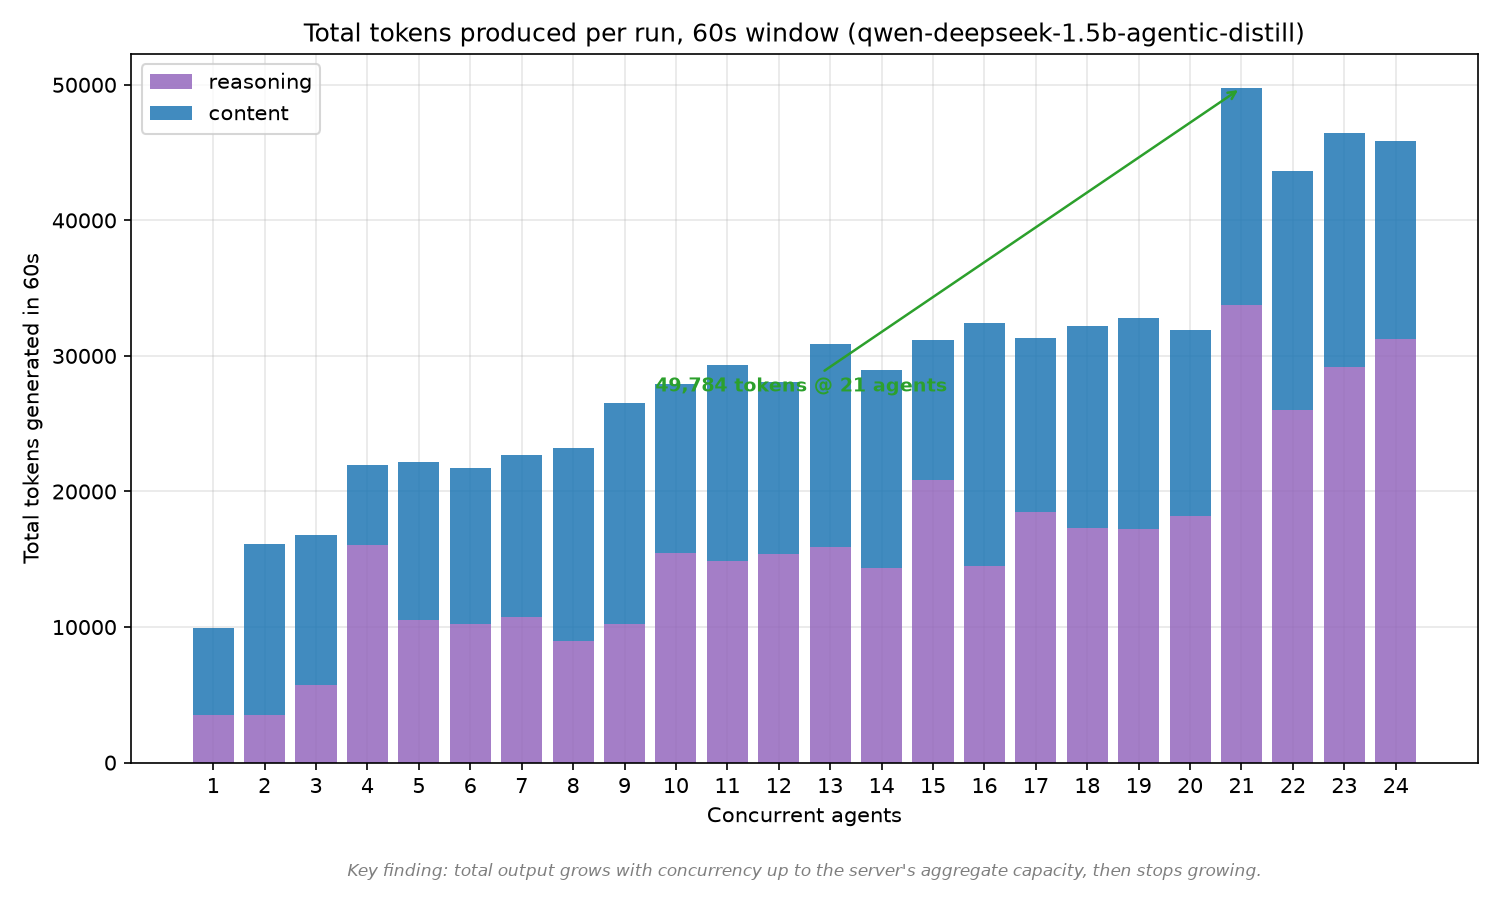
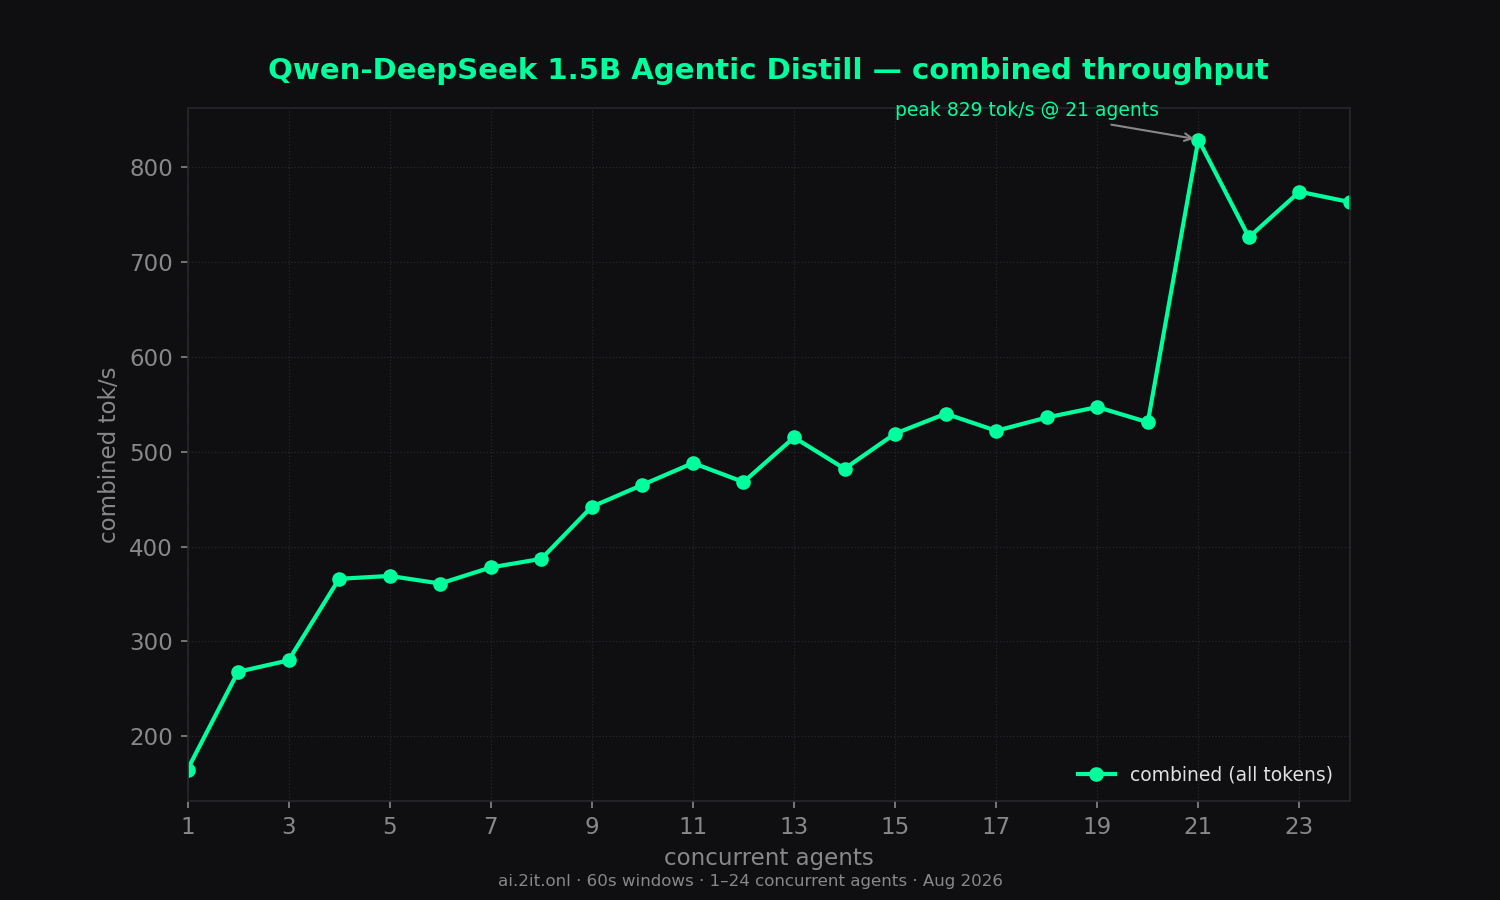
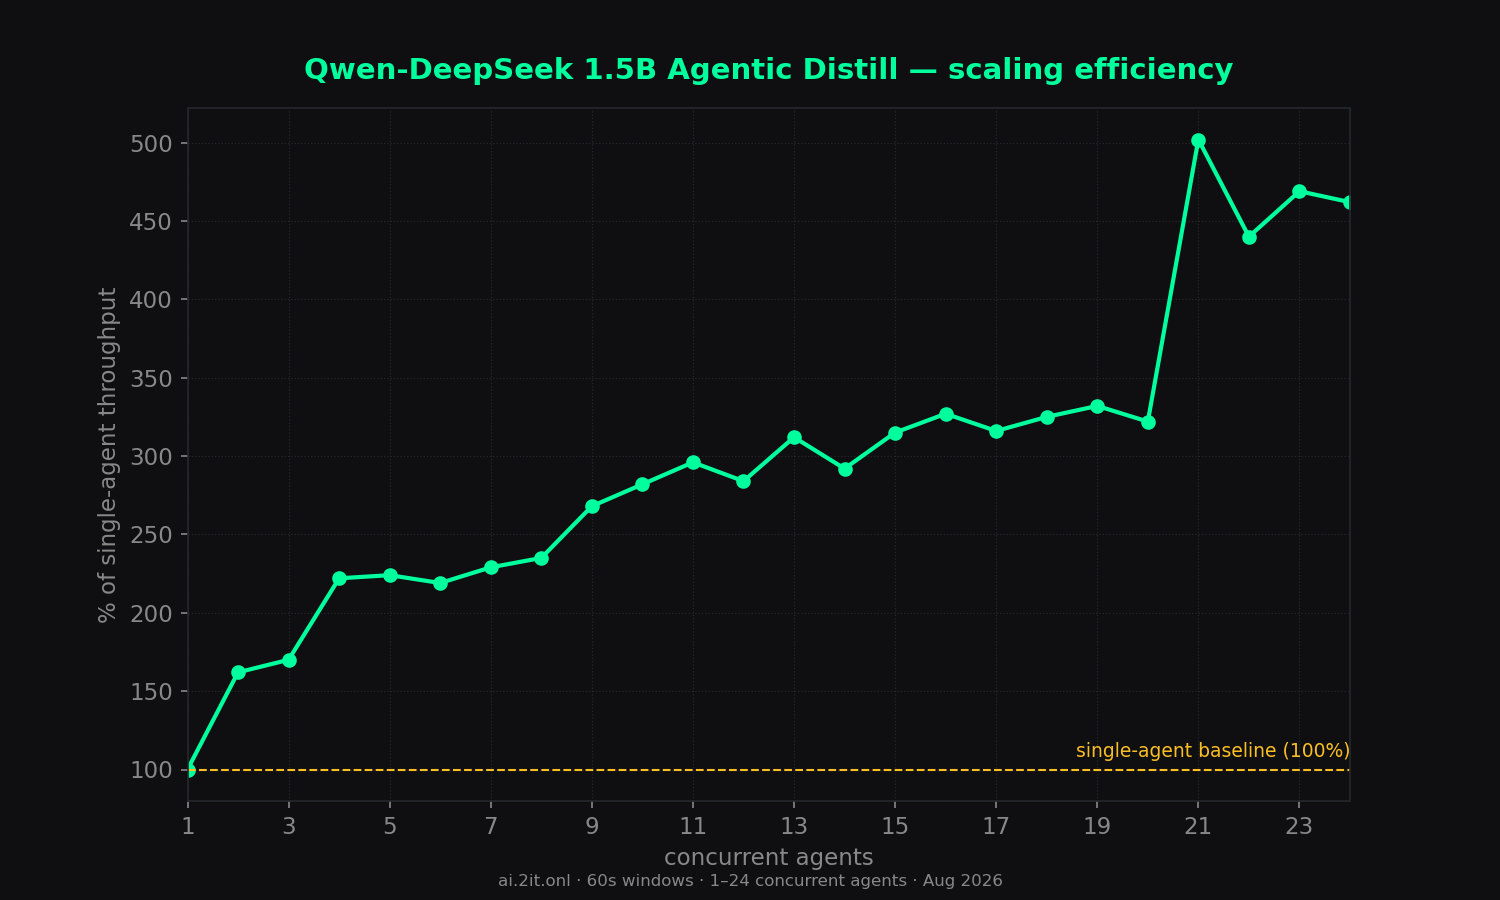
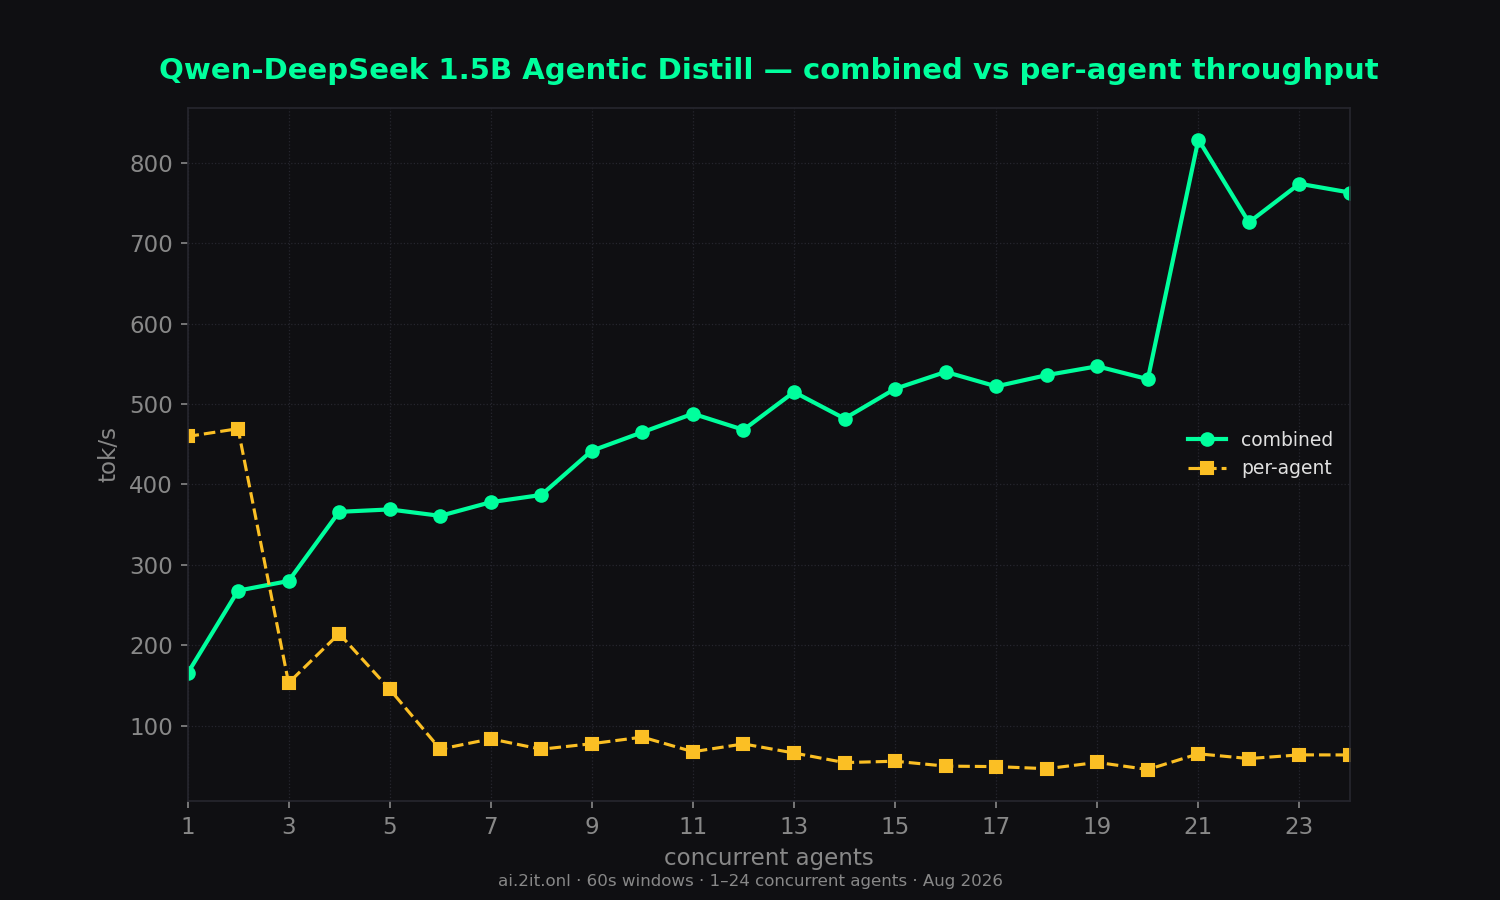
- Strong late-game scaling: combined throughput climbs steadily to 829 tok/s at 21 agents (5.0x) and holds 726–774 at 22–24 — the highest scaling of any model tested so far. A jump at 21+ likely reflects LM Studio batching kicking in more aggressively.
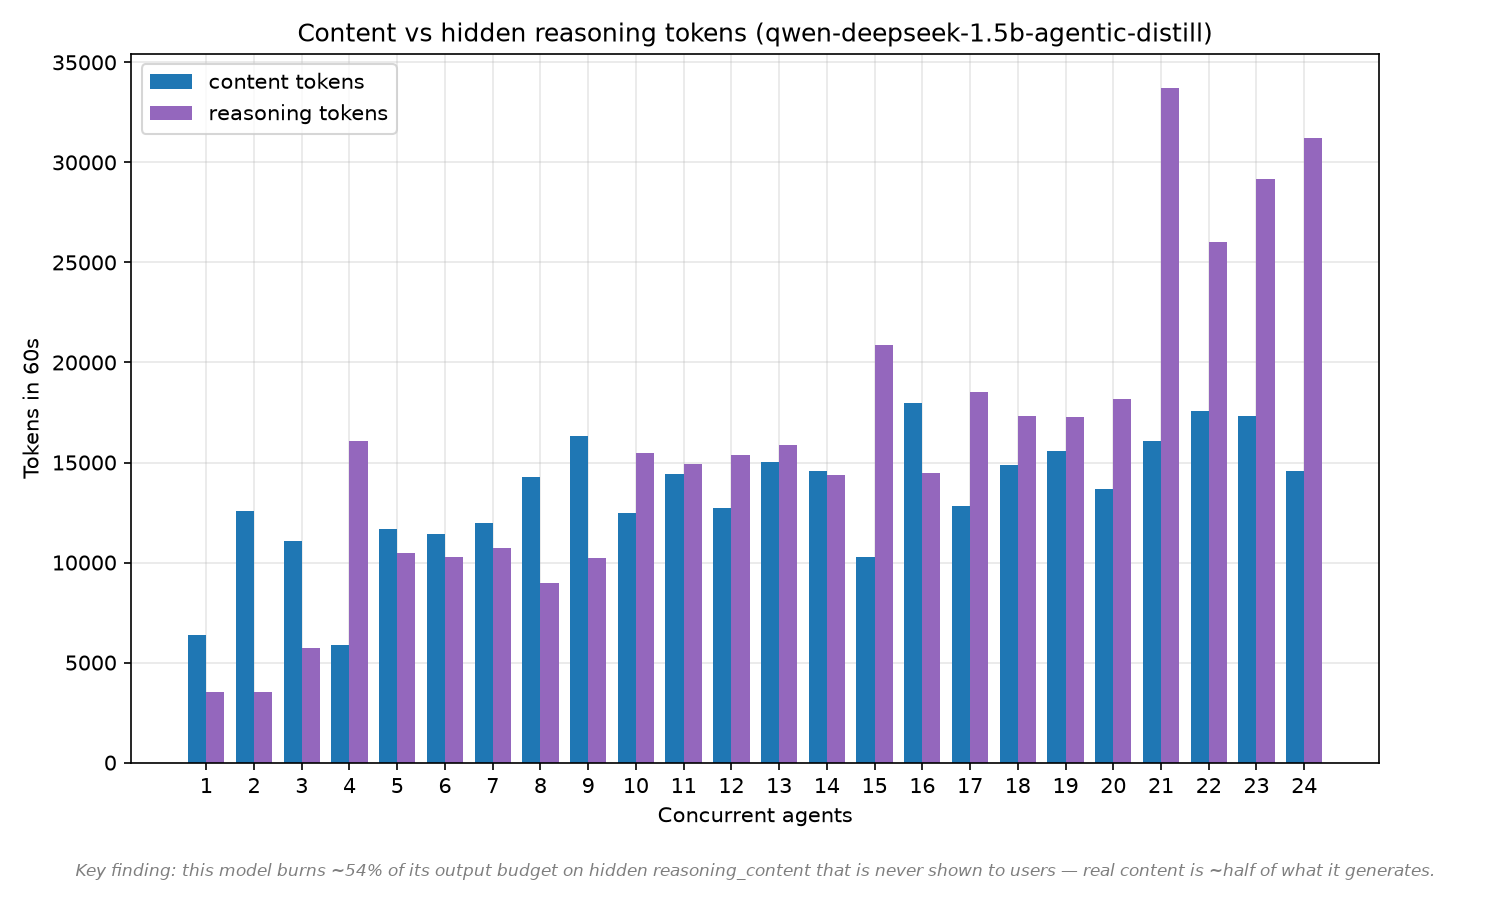
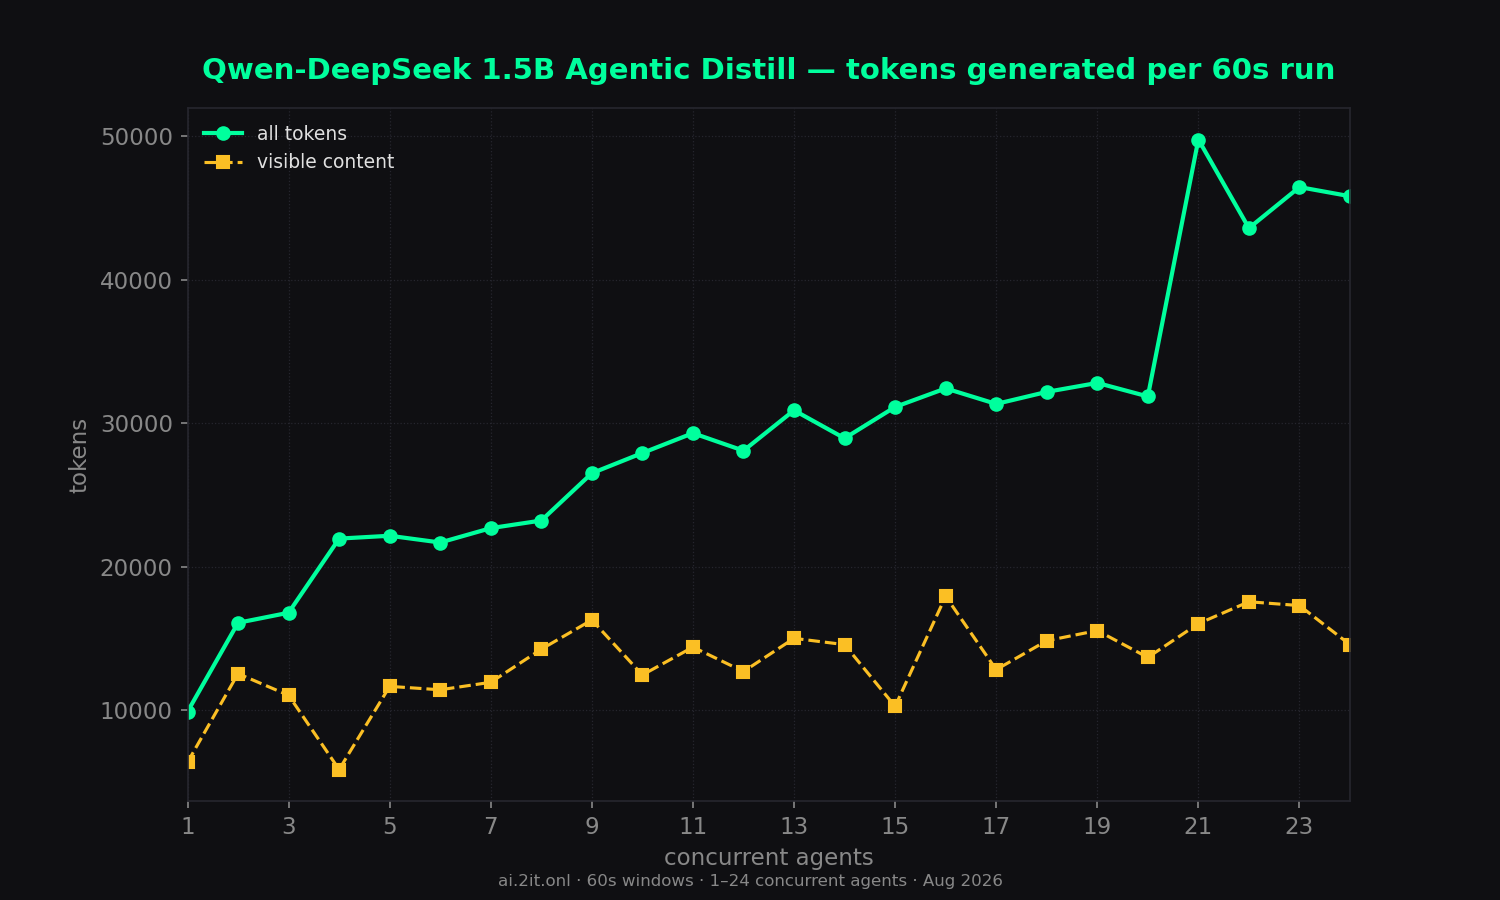
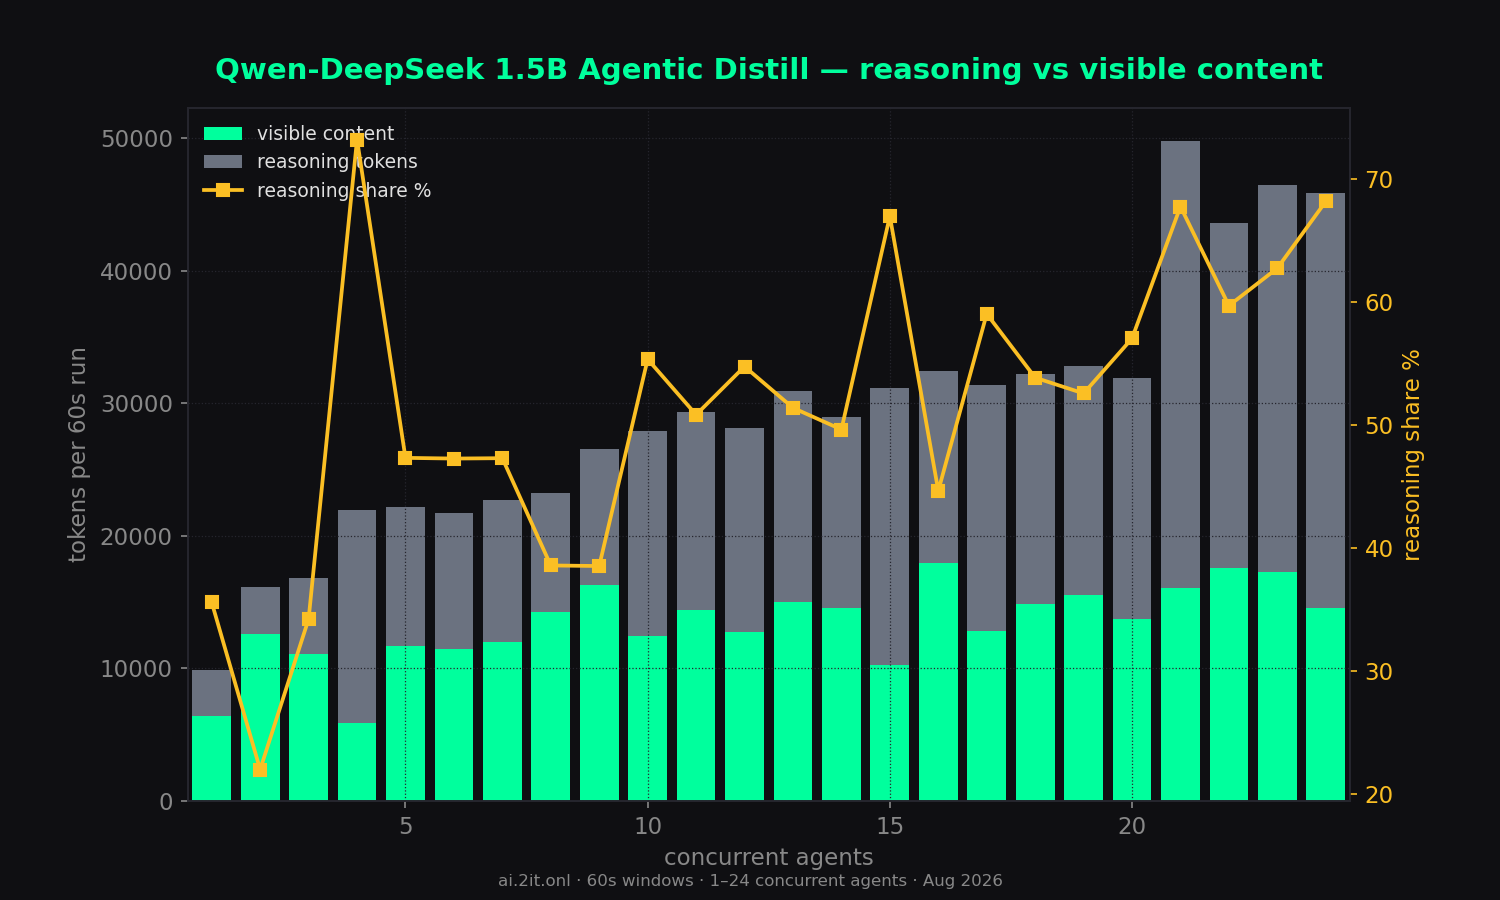
- Visible content is modest: content-only throughput peaks at only ~299 tok/s (16 agents) — over half the budget is hidden
reasoning_content(31k–34k reasoning tokens per run at high concurrency). - Very slow TTFT — the worst profile: 4.2s solo, and 20–36s mean under load, with max values up to 58s (near the full 60s window). Agents frequently wait half the run before their first token. Bad for latency-critical use.
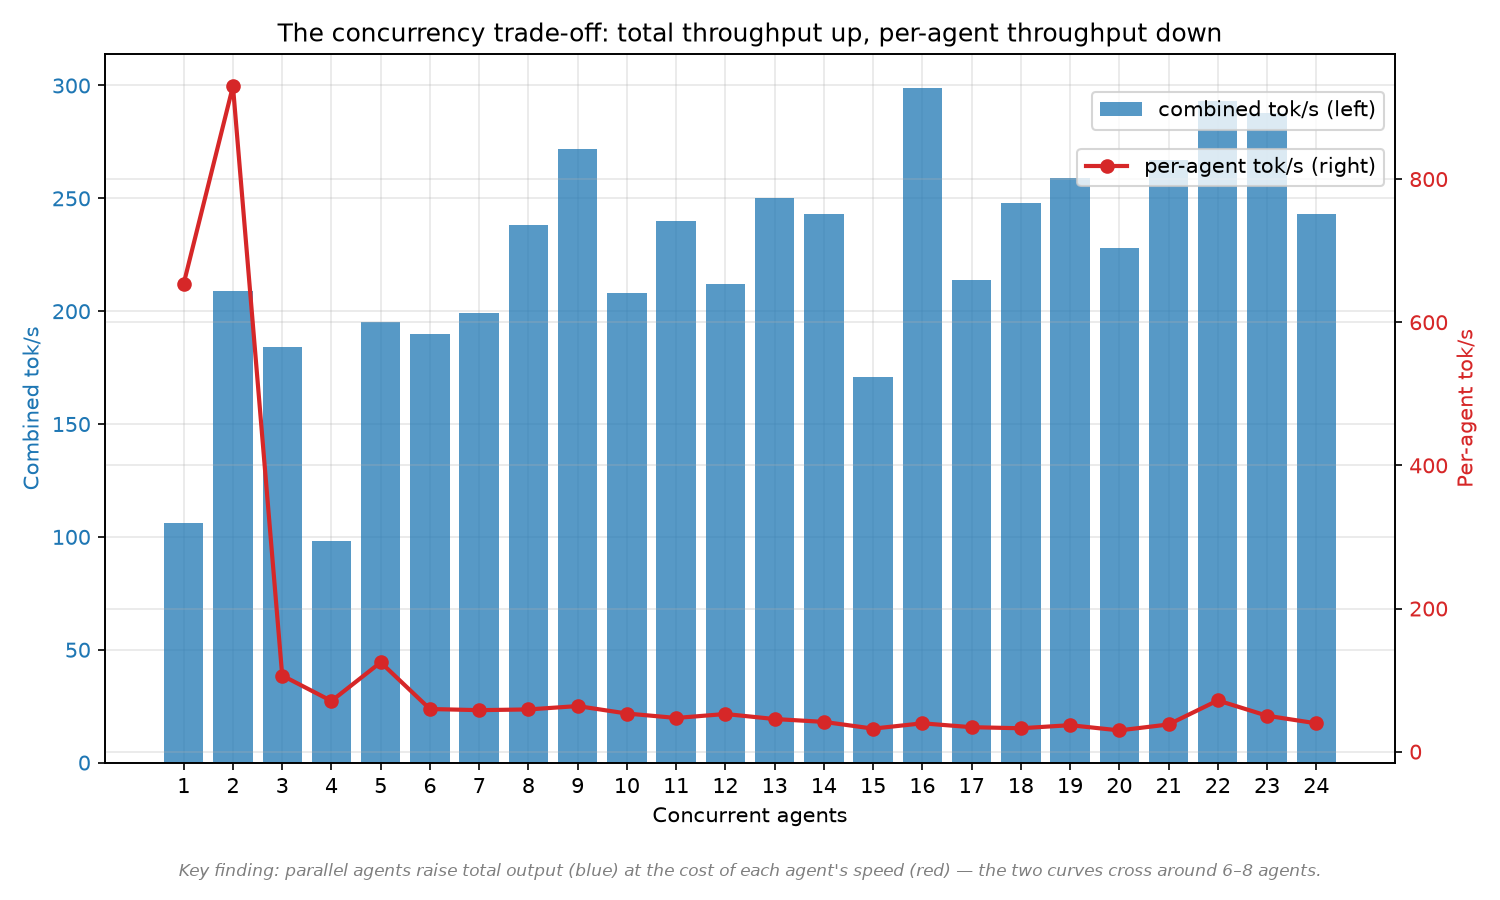
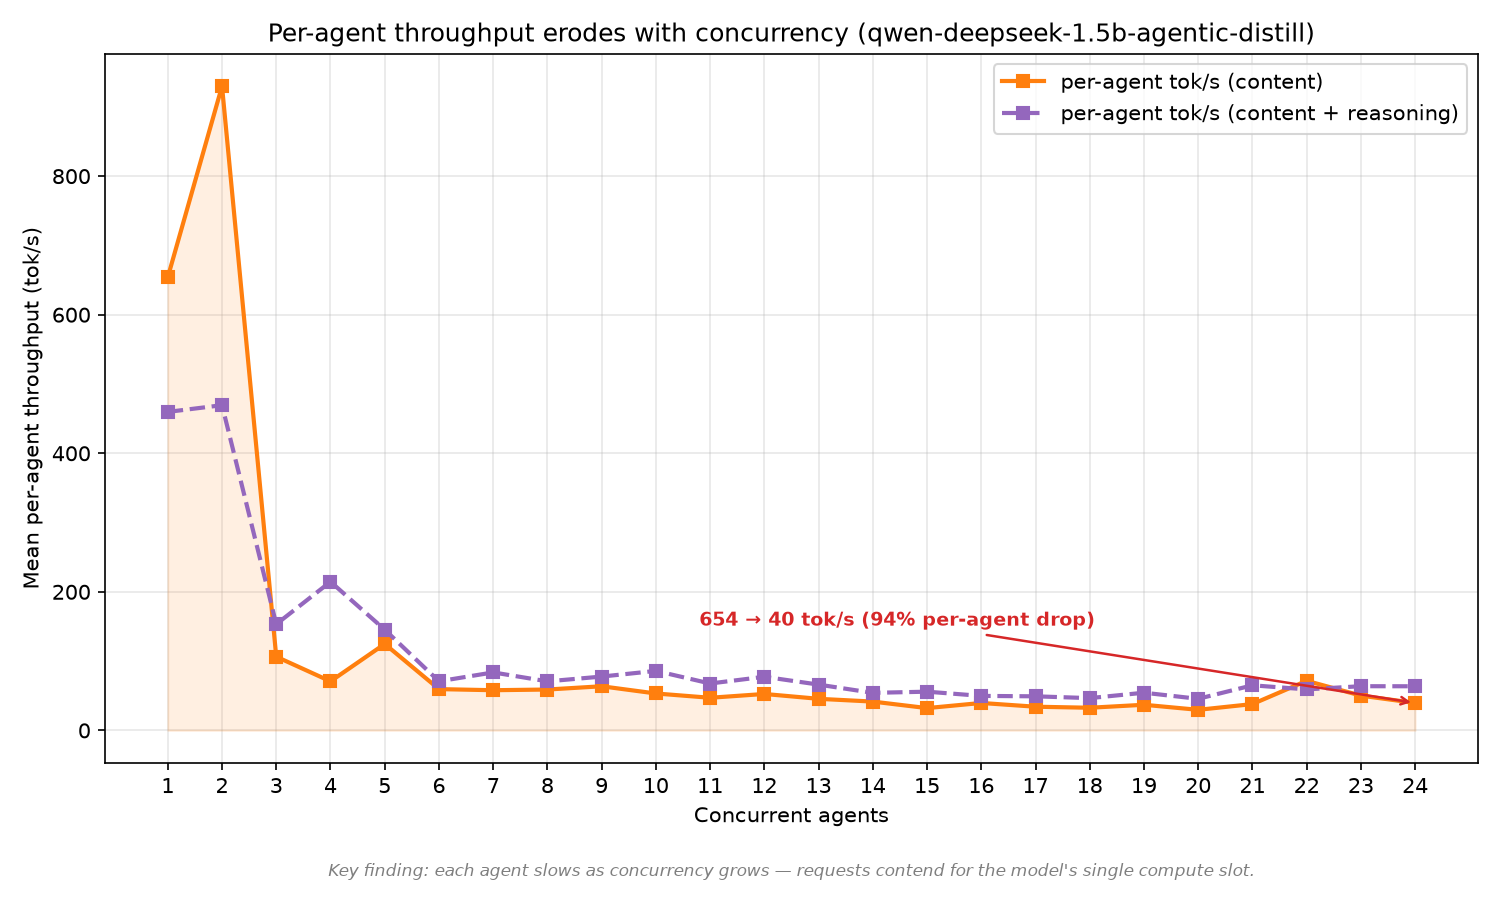
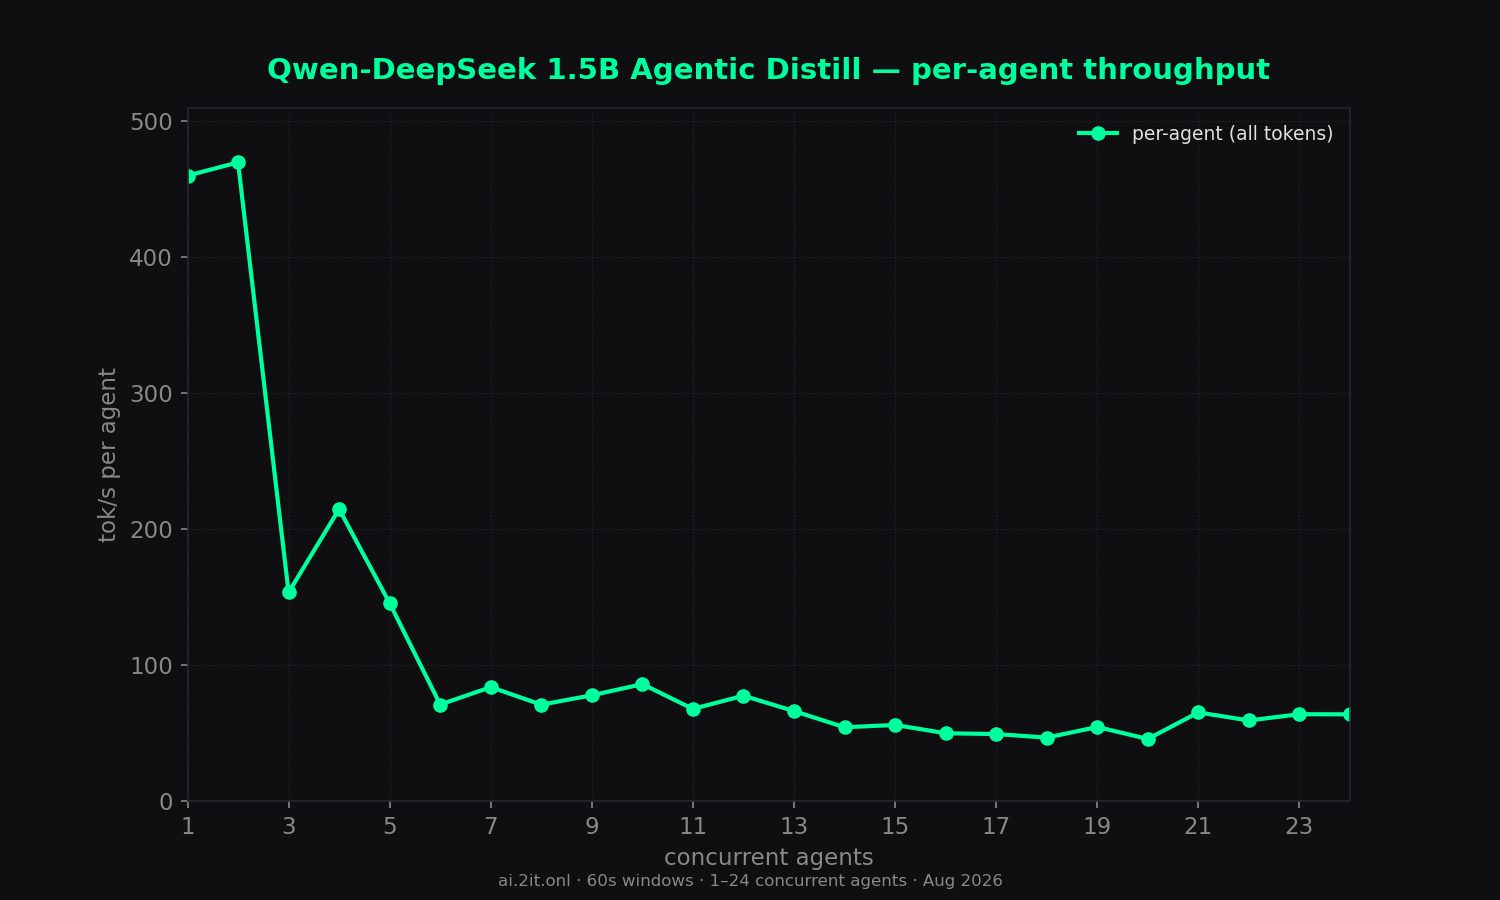
- Per-agent speed: ~30–50 tok/s (all-token) at high concurrency.
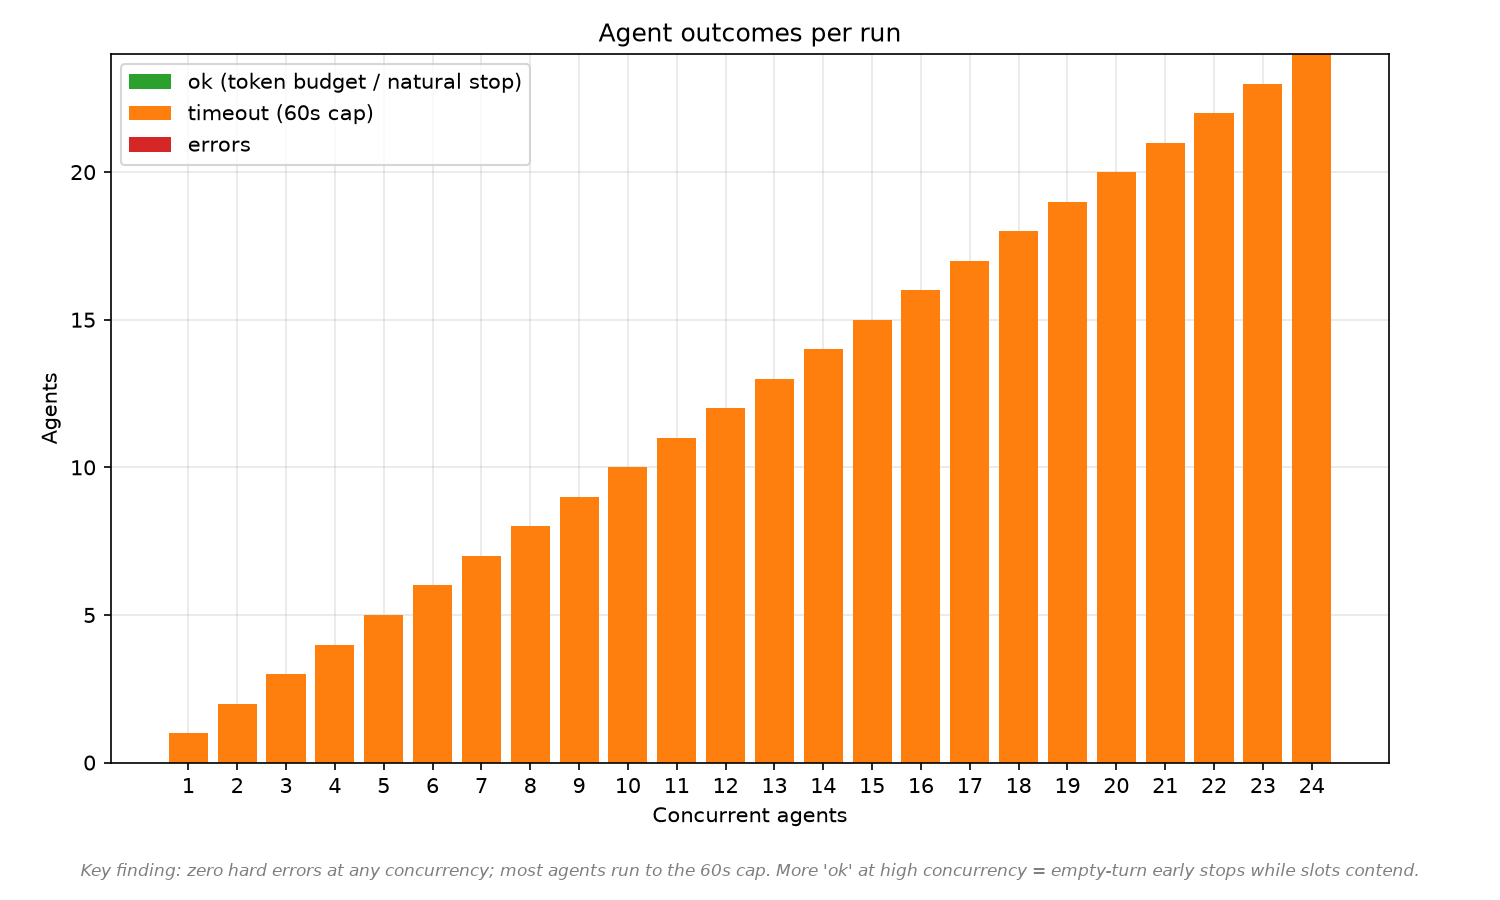
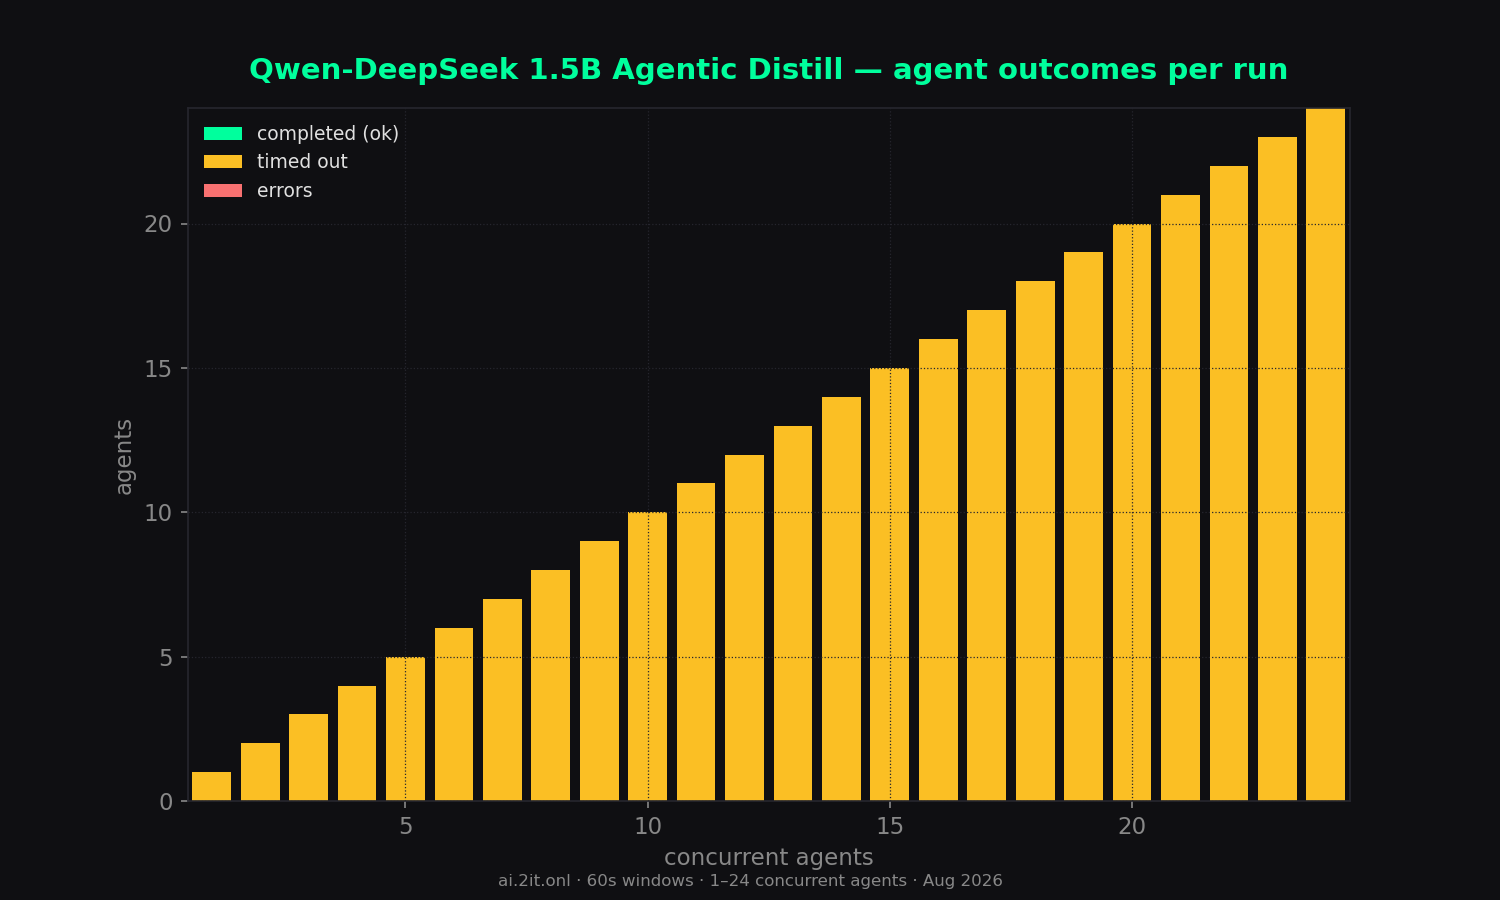
- Errors: 0 across all 24 runs.
Sweep — total concurrency 1–24
| agents | wall (s) | content | reason | total | comb tok/s | comb all | per-agent | per-agent all | scale % | TTFT mean | TTFT max | ok | timeout | err |
|---|---|---|---|---|---|---|---|---|---|---|---|---|---|---|
| 1 | 60.0 | 6,387 | 3,528 | 9,915 | 106 | 165 | 654.1 | 459.7 | 100% | 4.2s | 4.2s | 0 | 1 | 0 |
| 2 | 60.0 | 12,566 | 3,544 | 16,110 | 209 | 268 | 929.8 | 469.4 | 162% | 10.6s | 18.2s | 0 | 2 | 0 |
| 3 | 60.0 | 11,059 | 5,753 | 16,812 | 184 | 280 | 106.4 | 153.3 | 170% | 9.2s | 11.0s | 0 | 3 | 0 |
| 4 | 60.0 | 5,889 | 16,088 | 21,977 | 98 | 366 | 70.8 | 214.6 | 222% | 10.6s | 15.5s | 0 | 4 | 0 |
| 5 | 60.0 | 11,680 | 10,495 | 22,175 | 195 | 369 | 124.8 | 145.4 | 224% | 20.7s | 47.6s | 0 | 5 | 0 |
| 6 | 60.1 | 11,444 | 10,260 | 21,704 | 190 | 361 | 59.6 | 70.9 | 219% | 14.1s | 27.6s | 0 | 6 | 0 |
| 7 | 60.0 | 11,965 | 10,740 | 22,705 | 199 | 378 | 58.0 | 83.7 | 229% | 18.5s | 28.5s | 0 | 7 | 0 |
| 8 | 60.0 | 14,271 | 8,965 | 23,236 | 238 | 387 | 59.0 | 70.8 | 235% | 20.4s | 45.2s | 0 | 8 | 0 |
| 9 | 60.0 | 16,308 | 10,225 | 26,533 | 272 | 442 | 63.7 | 77.7 | 268% | 17.0s | 23.3s | 0 | 9 | 0 |
| 10 | 60.0 | 12,477 | 15,464 | 27,941 | 208 | 465 | 53.3 | 85.9 | 282% | 21.5s | 31.5s | 0 | 10 | 0 |
| 11 | 60.0 | 14,417 | 14,907 | 29,324 | 240 | 488 | 47.1 | 67.7 | 296% | 24.6s | 37.1s | 0 | 11 | 0 |
| 12 | 60.0 | 12,716 | 15,387 | 28,103 | 212 | 468 | 52.6 | 77.4 | 284% | 26.4s | 57.9s | 0 | 12 | 0 |
| 13 | 60.0 | 15,027 | 15,888 | 30,915 | 250 | 515 | 45.6 | 66.1 | 312% | 30.4s | 48.5s | 0 | 13 | 0 |
| 14 | 60.0 | 14,590 | 14,377 | 28,967 | 243 | 482 | 41.6 | 54.2 | 292% | 27.4s | 49.6s | 0 | 14 | 0 |
| 15 | 60.0 | 10,288 | 20,860 | 31,148 | 171 | 519 | 32.2 | 55.9 | 315% | 32.1s | 49.9s | 0 | 15 | 0 |
| 16 | 60.0 | 17,958 | 14,484 | 32,442 | 299 | 540 | 39.6 | 49.8 | 327% | 31.2s | 49.8s | 0 | 16 | 0 |
| 17 | 60.0 | 12,847 | 18,512 | 31,359 | 214 | 522 | 34.2 | 49.2 | 316% | 35.9s | 48.0s | 0 | 17 | 0 |
| 18 | 60.0 | 14,861 | 17,338 | 32,199 | 248 | 536 | 32.7 | 46.6 | 325% | 30.2s | 37.0s | 0 | 18 | 0 |
| 19 | 60.0 | 15,570 | 17,254 | 32,824 | 259 | 547 | 37.0 | 54.4 | 332% | 35.2s | 52.9s | 0 | 19 | 0 |
| 20 | 60.0 | 13,697 | 18,184 | 31,881 | 228 | 531 | 29.7 | 45.6 | 322% | 33.1s | 47.8s | 0 | 20 | 0 |
| 21 peak | 60.0 | 16,053 | 33,731 | 49,784 | 267 | 829 | 38.0 | 65.1 | 502% | 23.4s | 50.2s | 0 | 21 | 0 |
| 22 | 60.0 | 17,576 | 26,033 | 43,609 | 293 | 726 | 71.6 | 59.2 | 440% | 26.8s | 41.0s | 0 | 22 | 0 |
| 23 | 60.0 | 17,311 | 29,157 | 46,468 | 288 | 774 | 50.2 | 63.8 | 469% | 27.9s | 51.6s | 0 | 23 | 0 |
| 24 | 60.0 | 14,588 | 31,243 | 45,831 | 243 | 763 | 39.6 | 63.7 | 462% | 27.8s | 54.5s | 0 | 24 | 0 |
* burst artifact — agents queued ~11–16s then generated in a short burst; the per-agent timer inflates the number. Trust combined throughput and TTFT columns. Peak row = highest combined (all-token) throughput.
Charts
Raw data & downloads
- report.md5 KB
- sweep-summary.csv3 KB
- sweep-summary.json11 KB
- combined_throughput.png136 KB · original matplotlib export
- combined_vs_per_agent.png96 KB · original matplotlib export
- dashboard_1_24.png174 KB · original matplotlib export
- outcome_breakdown.png57 KB · original matplotlib export
- per_agent_throughput.png108 KB · original matplotlib export
- reasoning_vs_content.png63 KB · original matplotlib export
- scaling_efficiency.png74 KB · original matplotlib export
- time_to_first_token.png67 KB · original matplotlib export
- total_tokens_generated.png76 KB · original matplotlib export