Gemma3 1B IT (Heretic thinking)
server model id:
gemma-3-1b-it-glm-4.7-flash-heretic-uncensored-thinking_ggufthinkingKV F16ctx 32k1B params
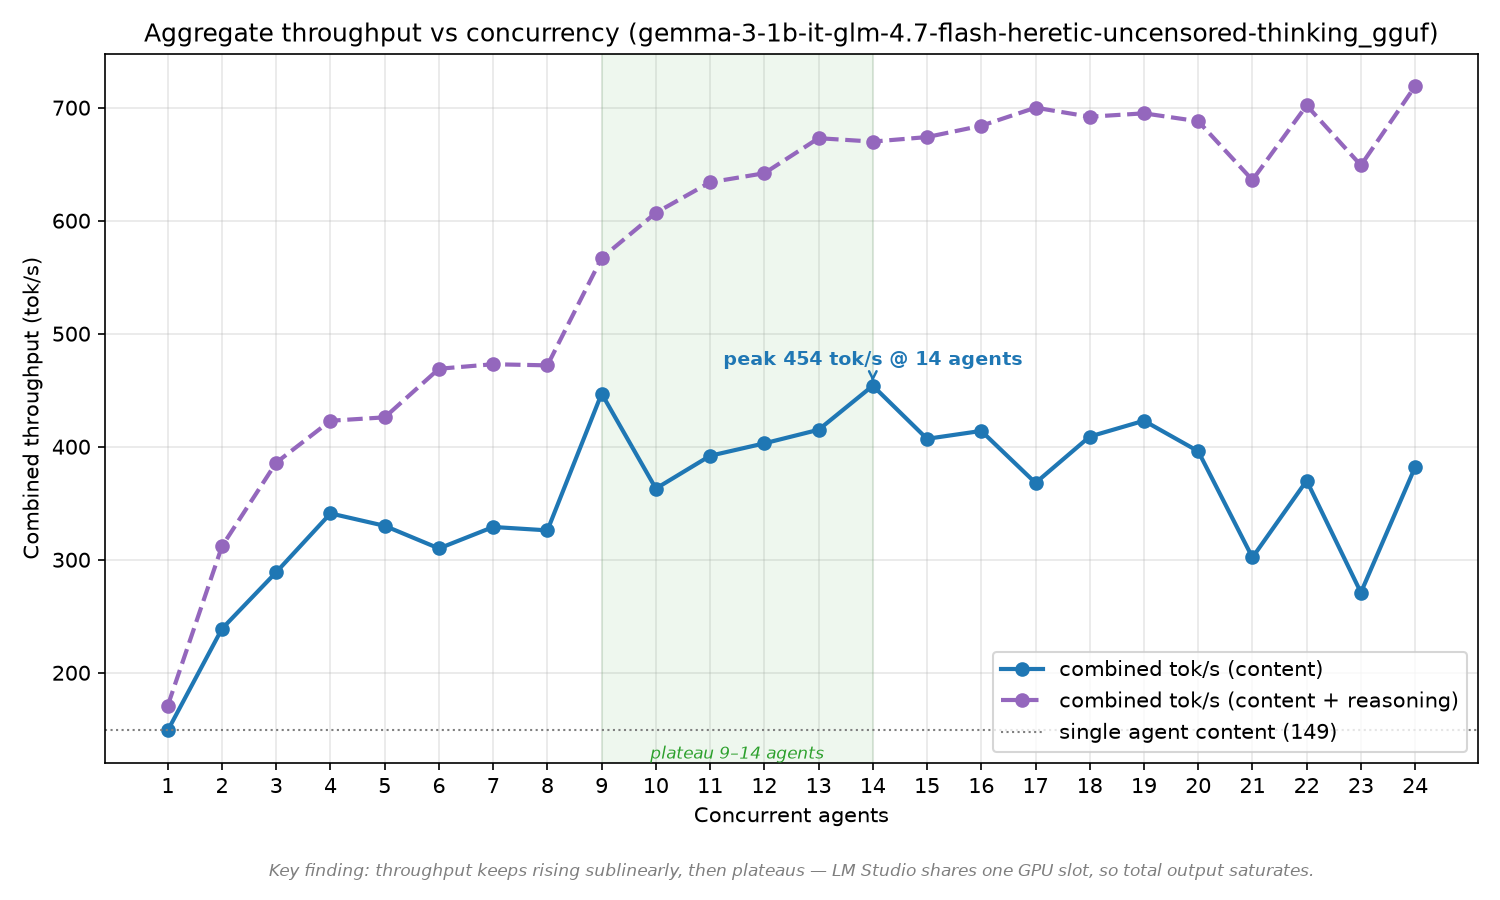
Friendliest thinking profile — 86ms solo TTFT, 719 tok/s all-in, and it just thinks harder under load.
Key findings
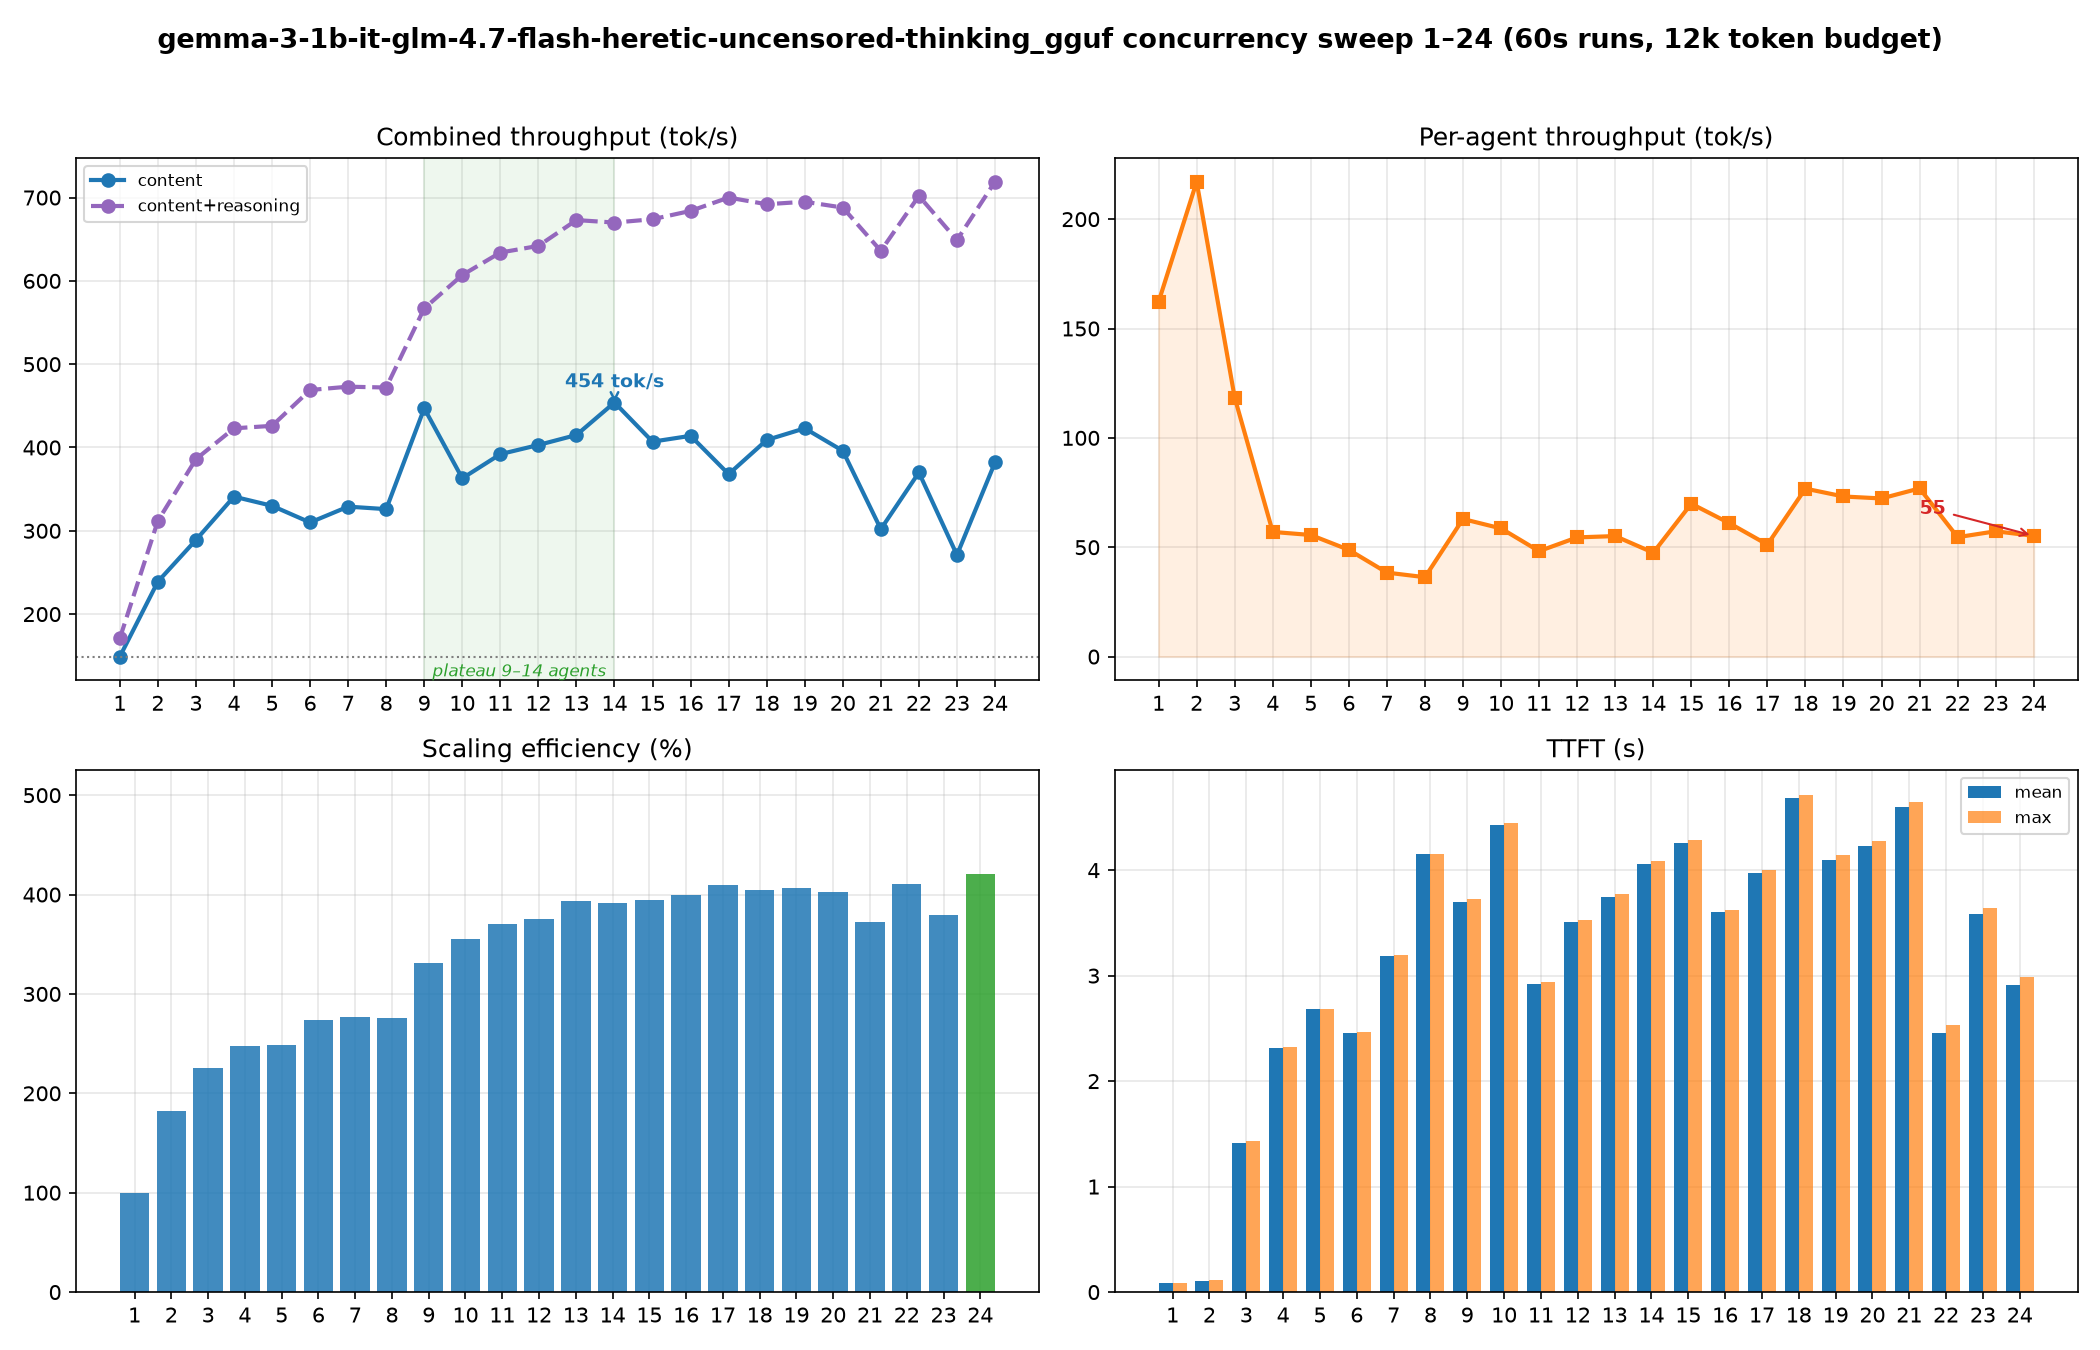
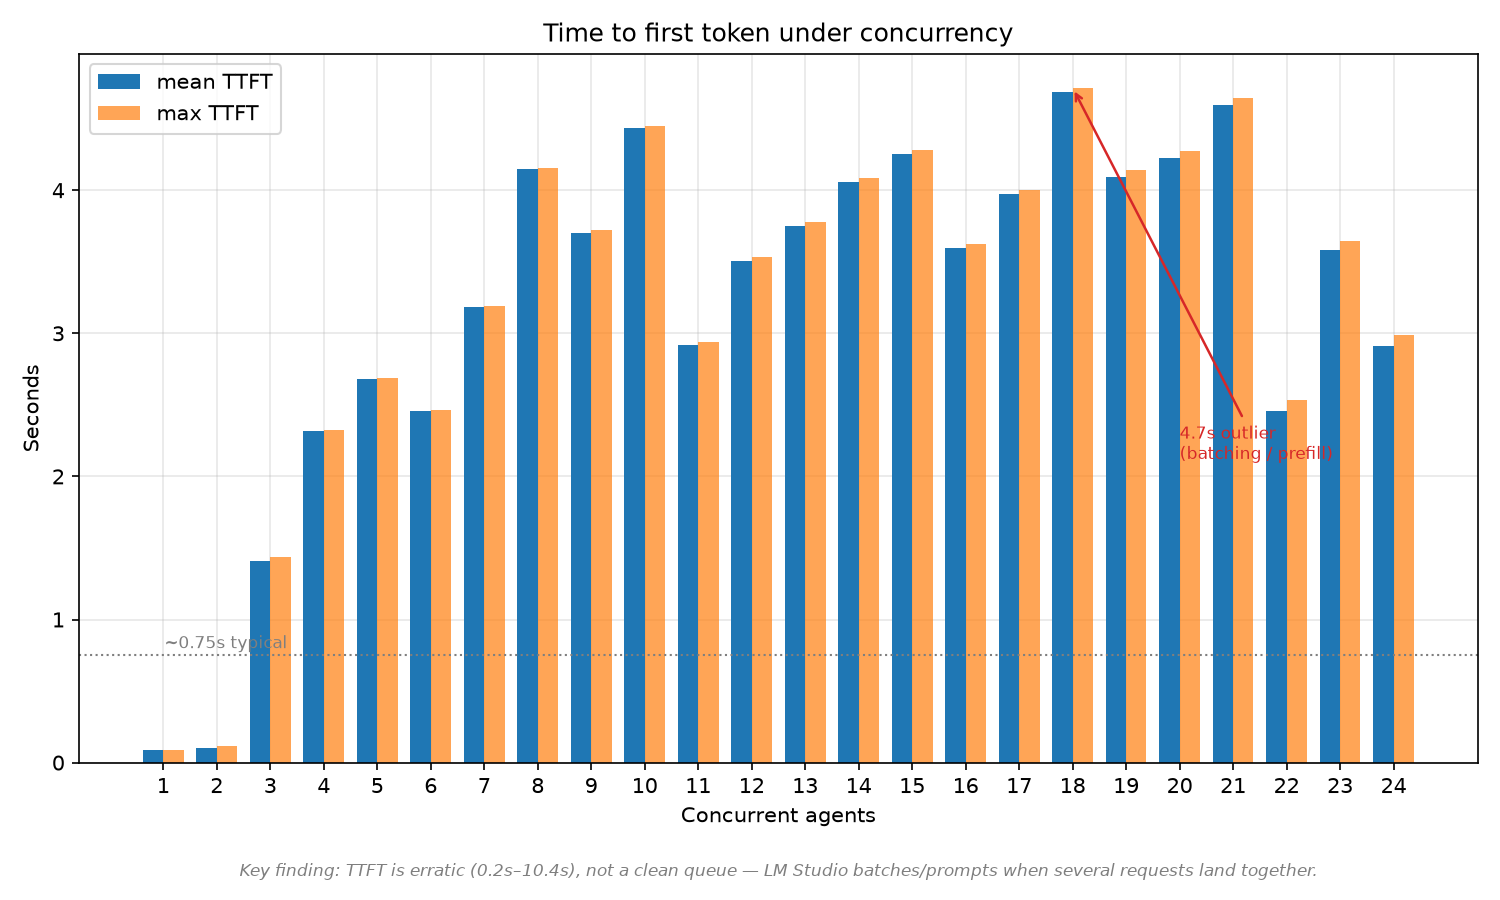
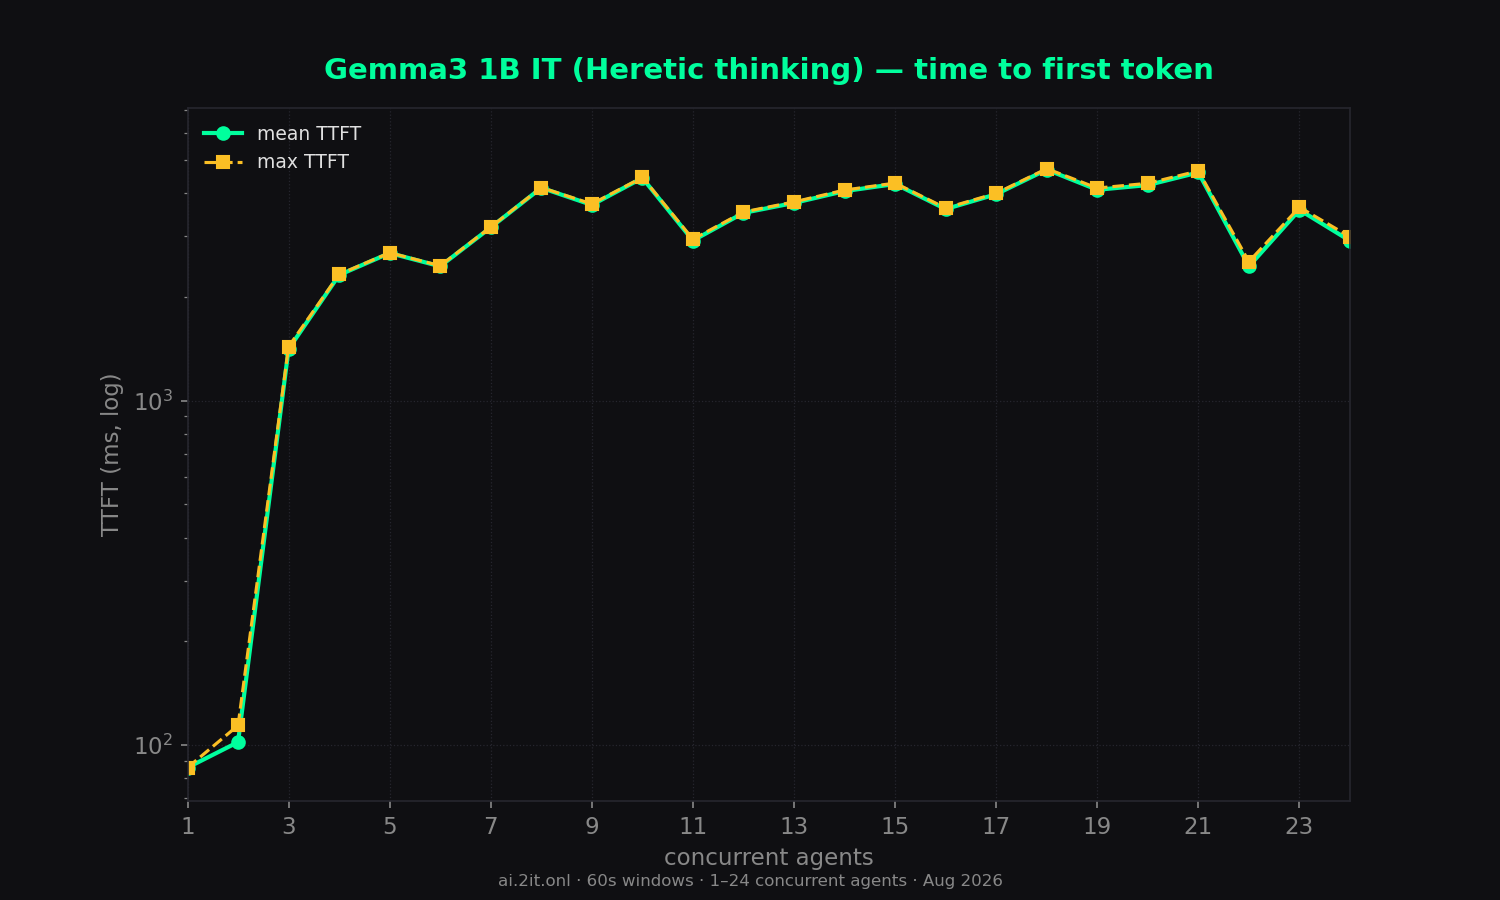
- Reasonable latency: TTFT stays in the 86ms–4.7s range across the whole sweep (single agent: 86ms) — dramatically better than minicpm5's 1.5s–52s. This is the friendliest "thinking" profile of the three models tested.
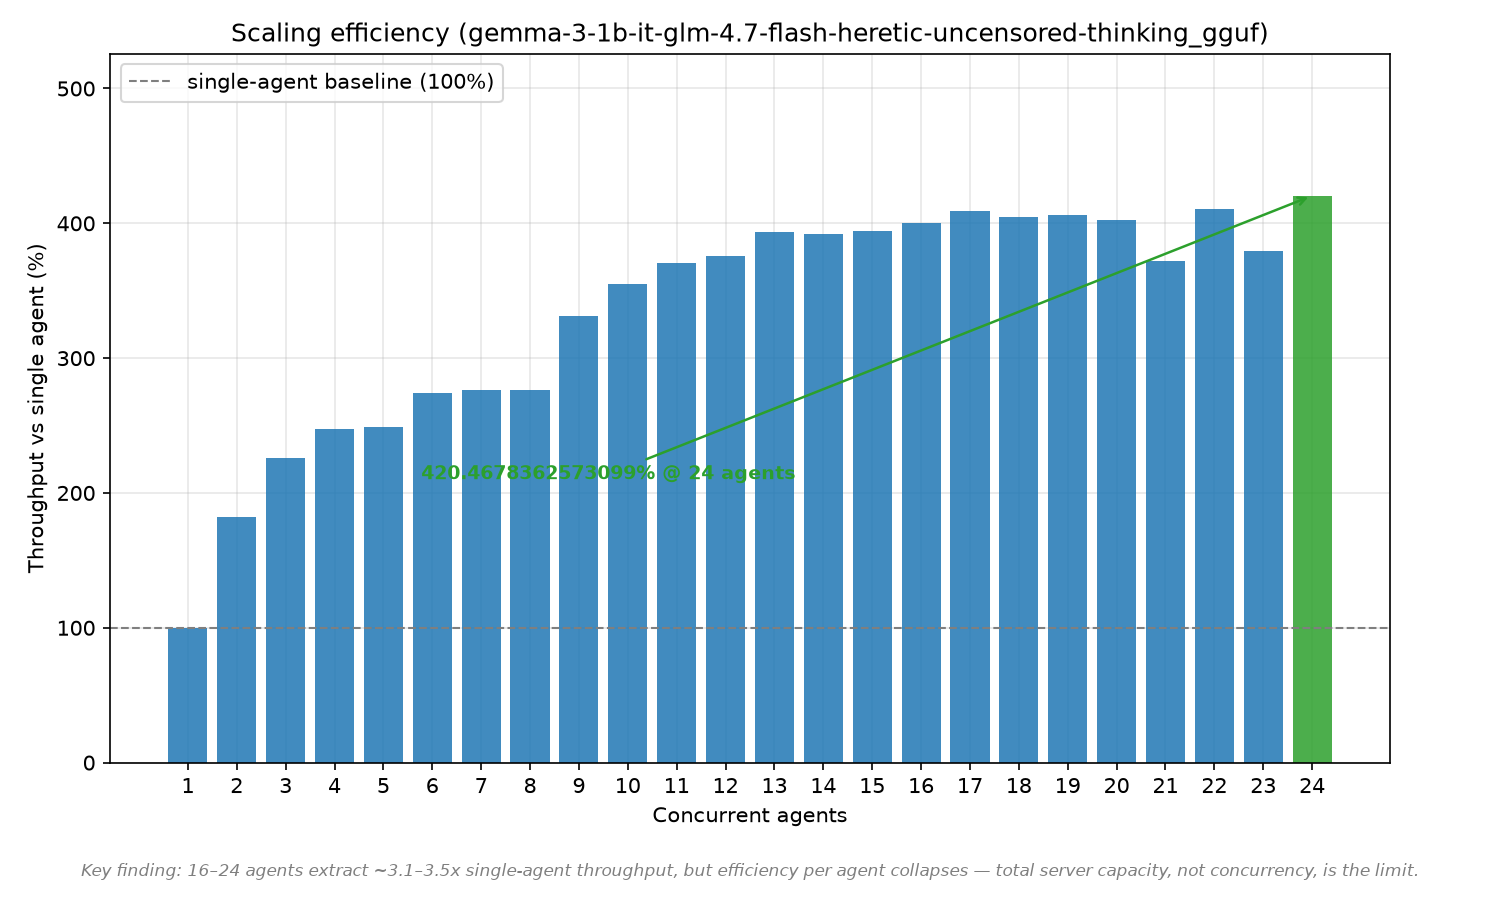
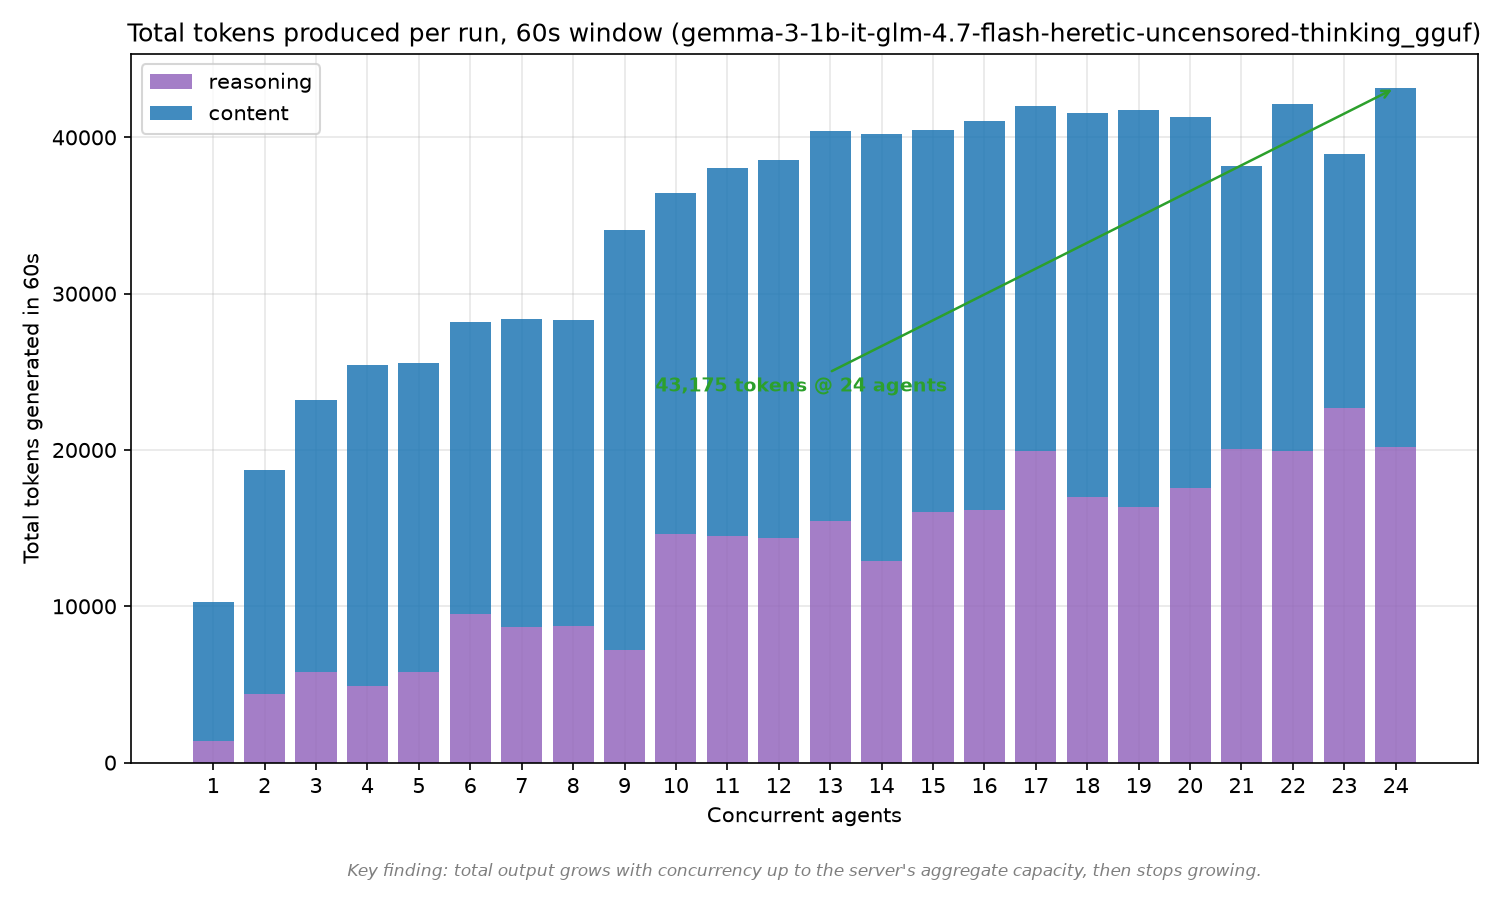
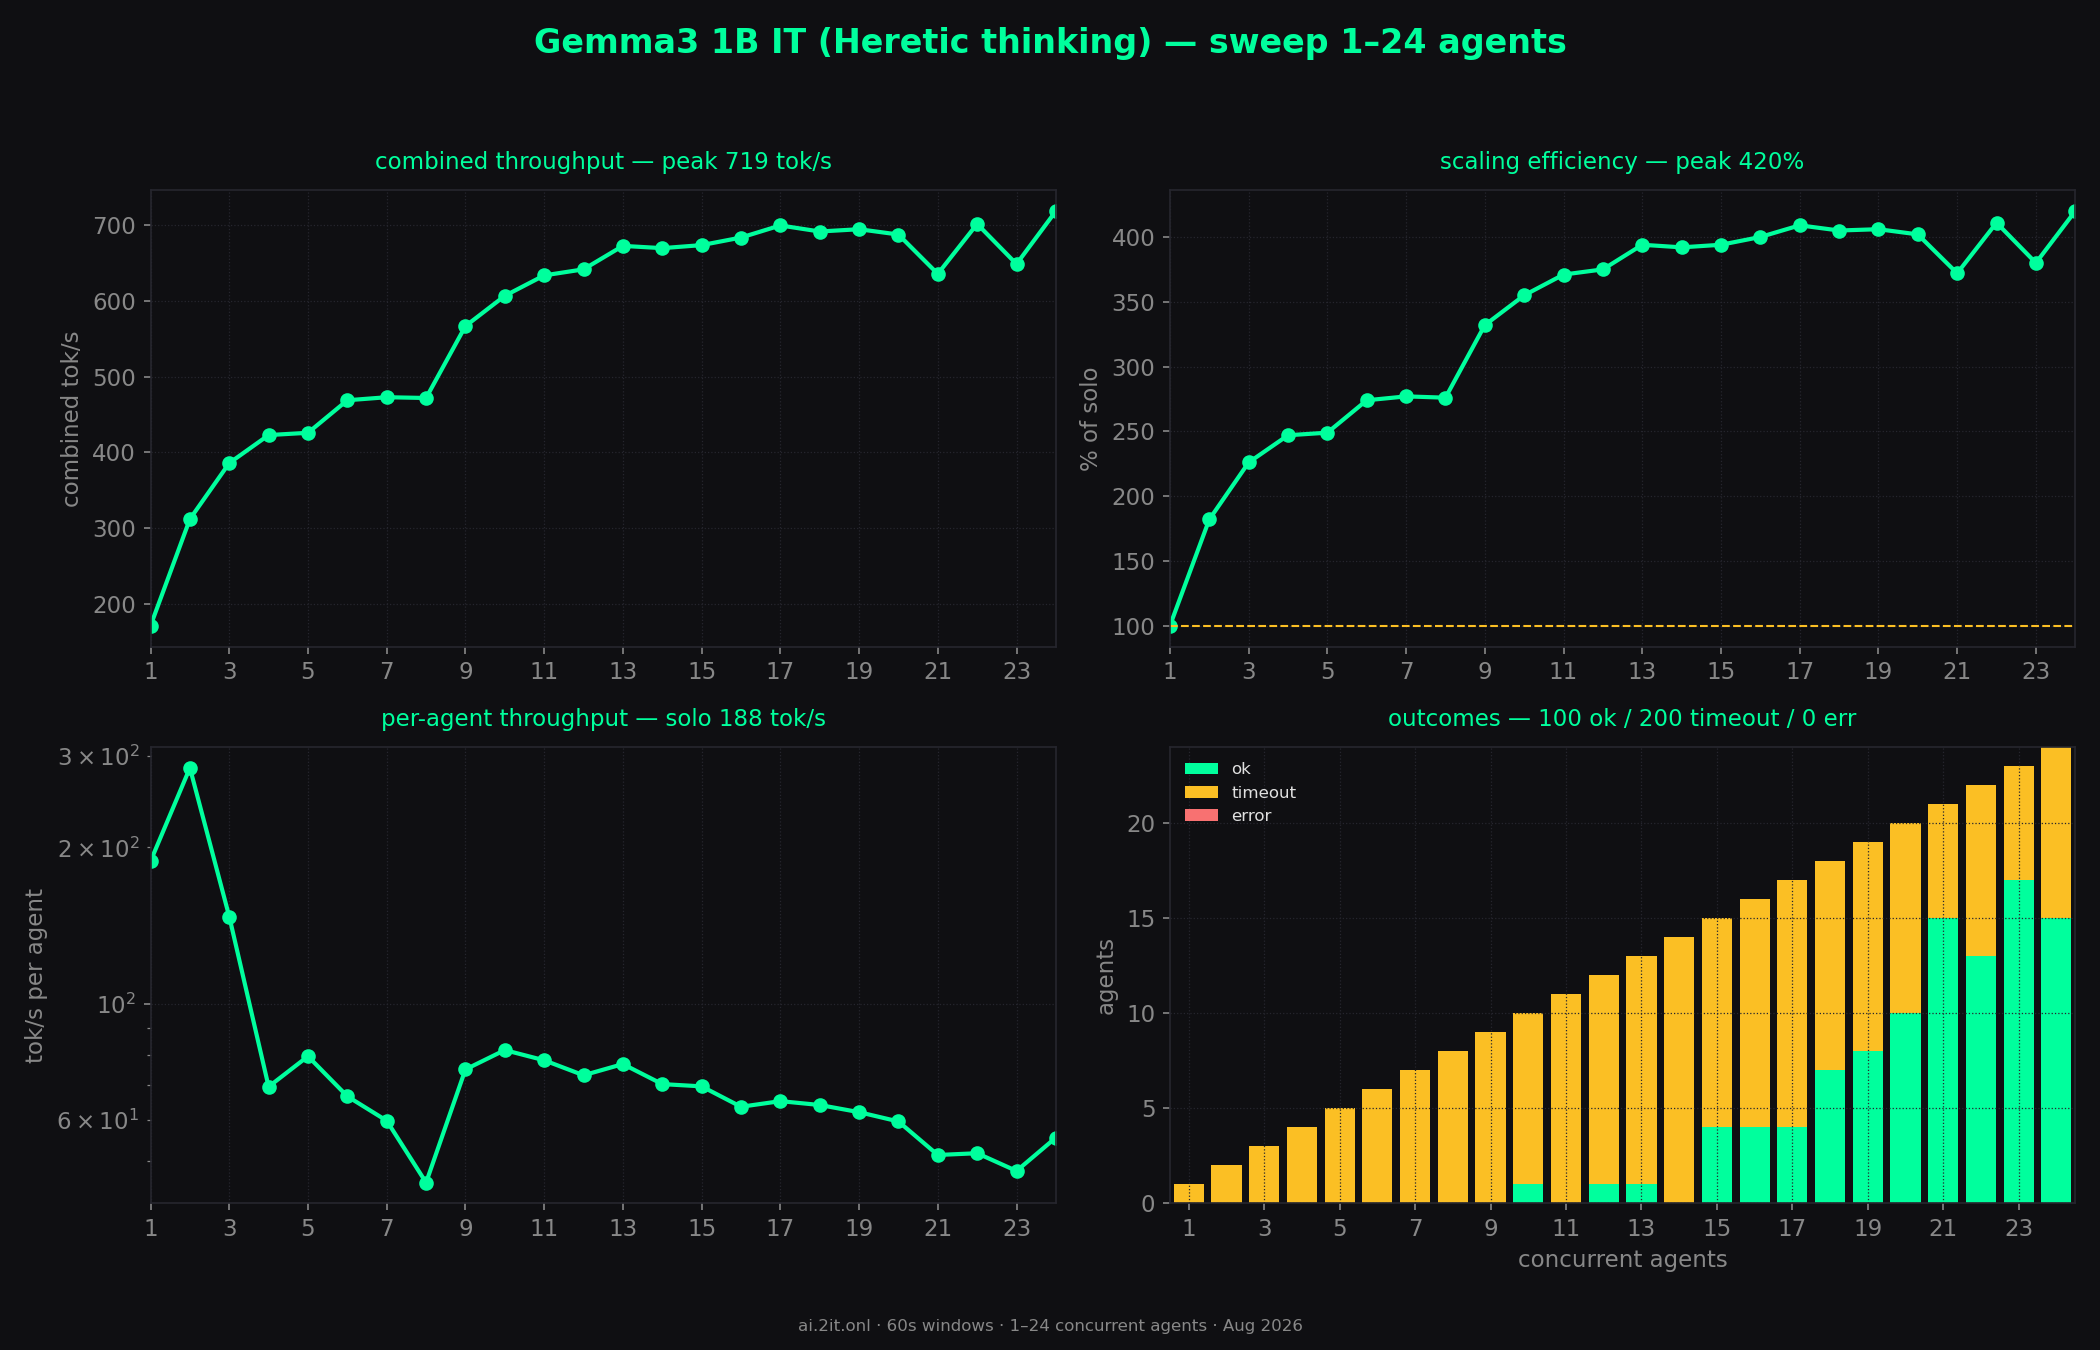
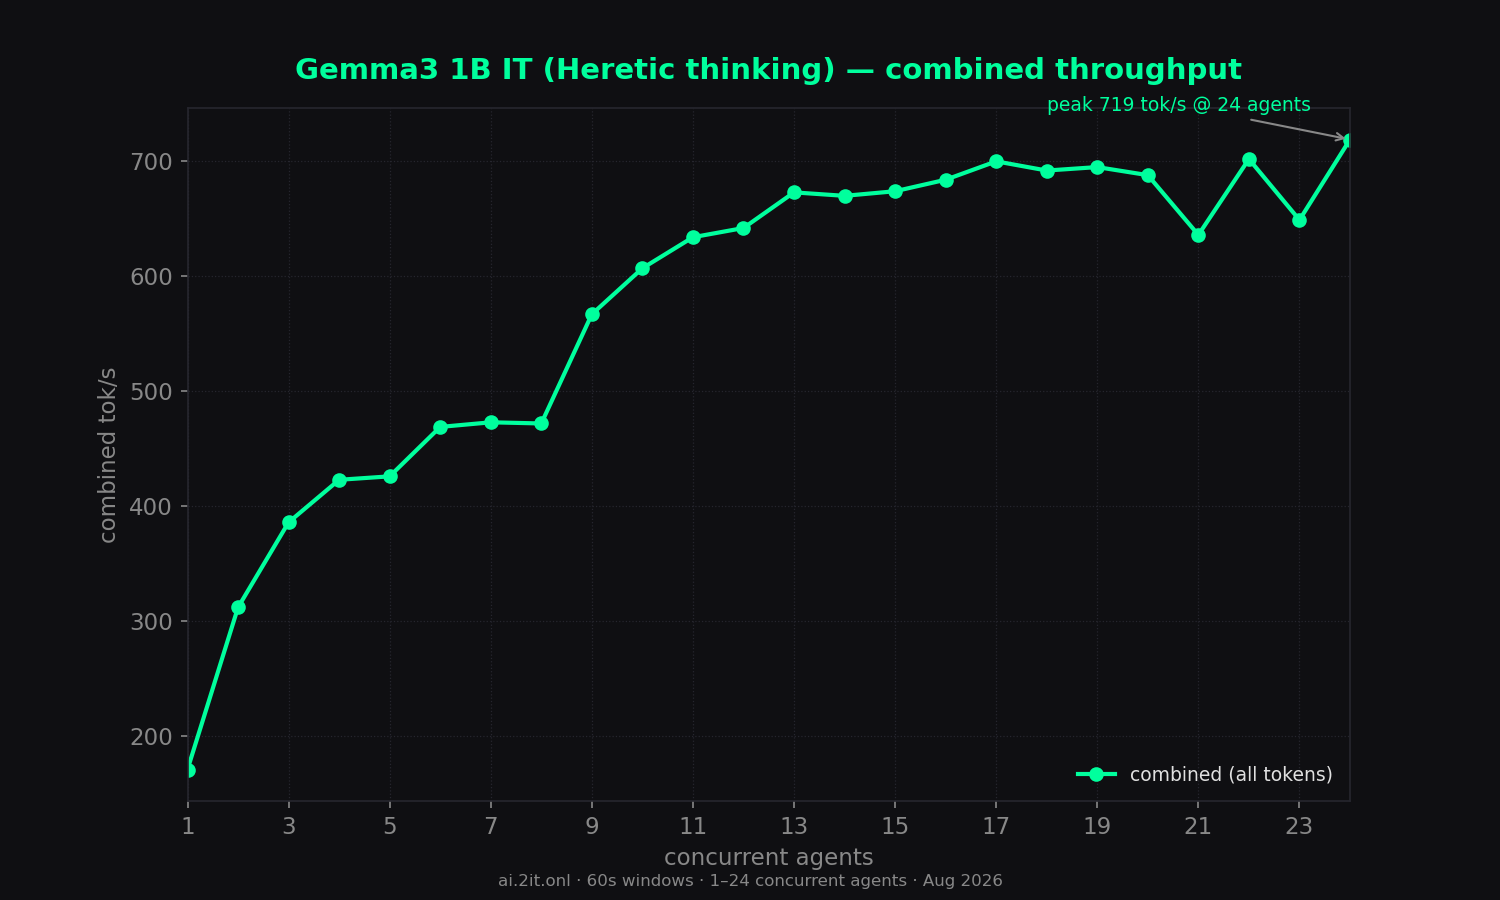
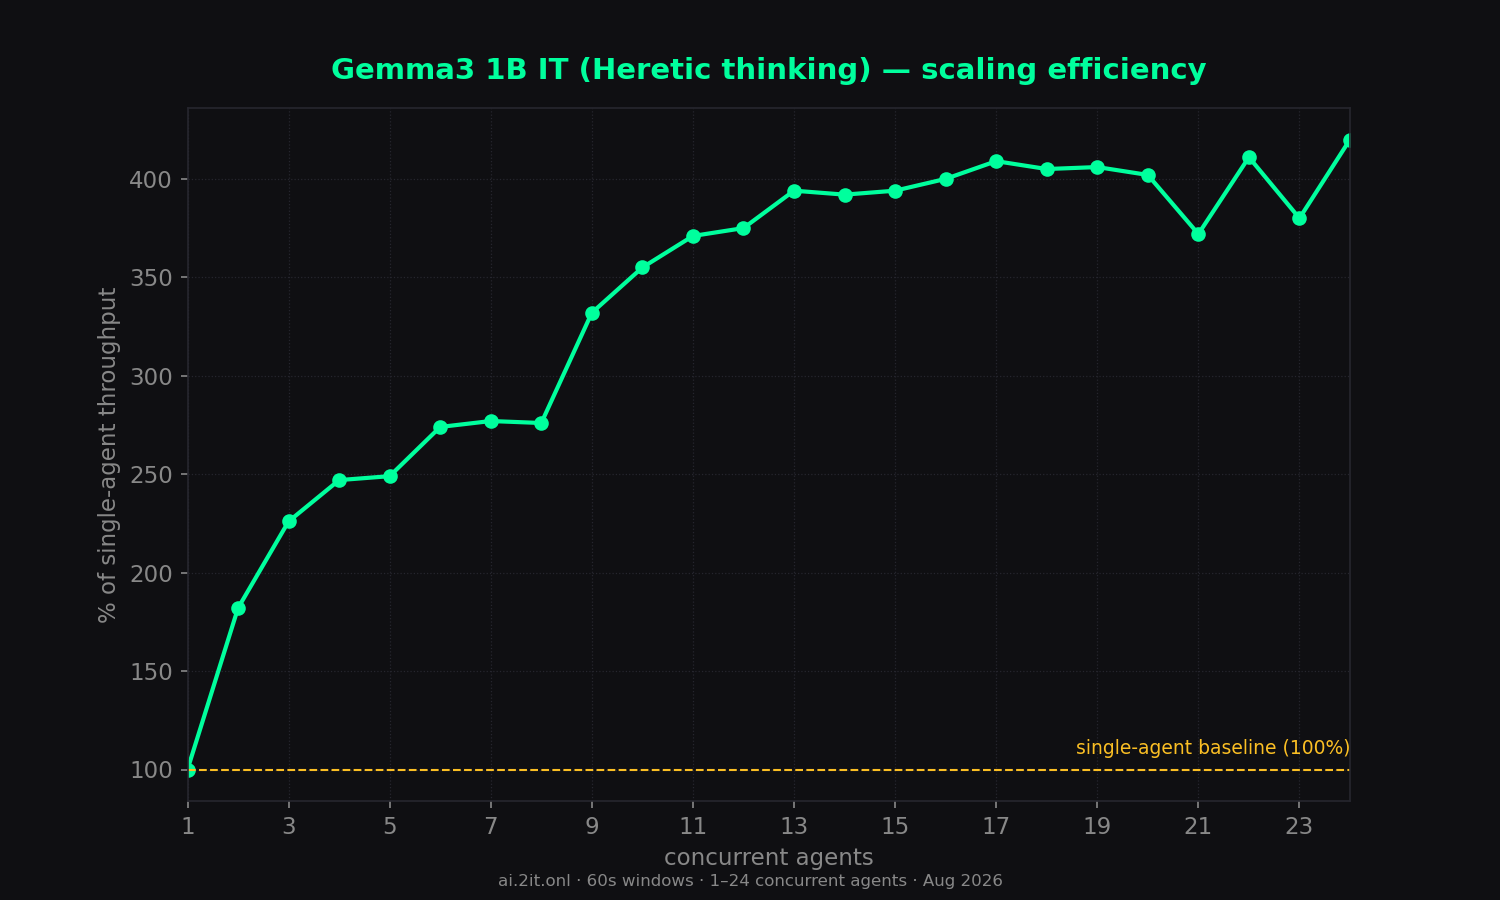
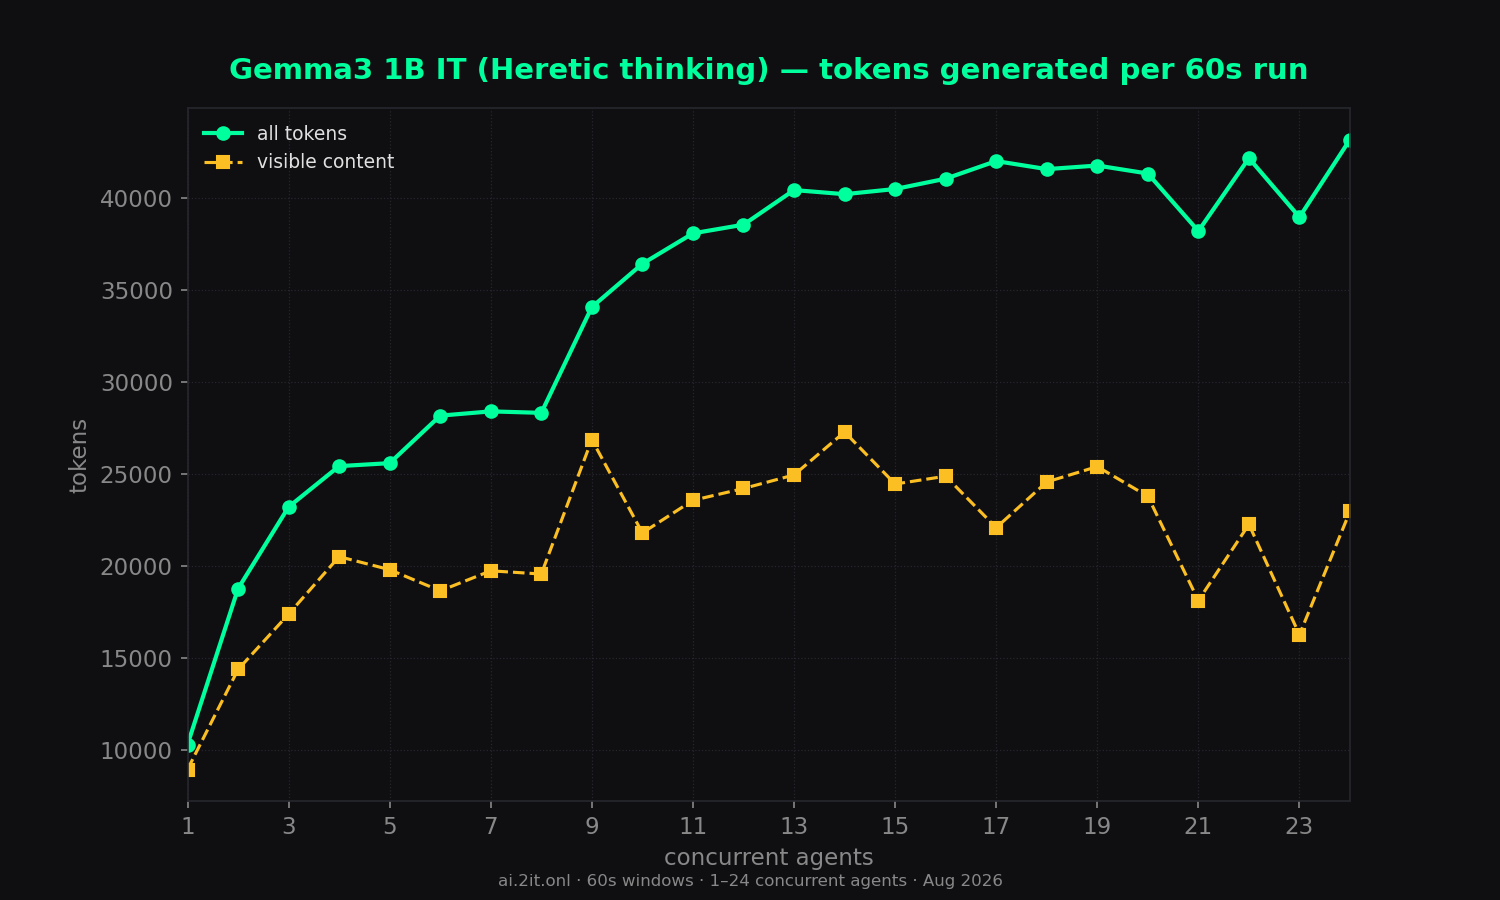
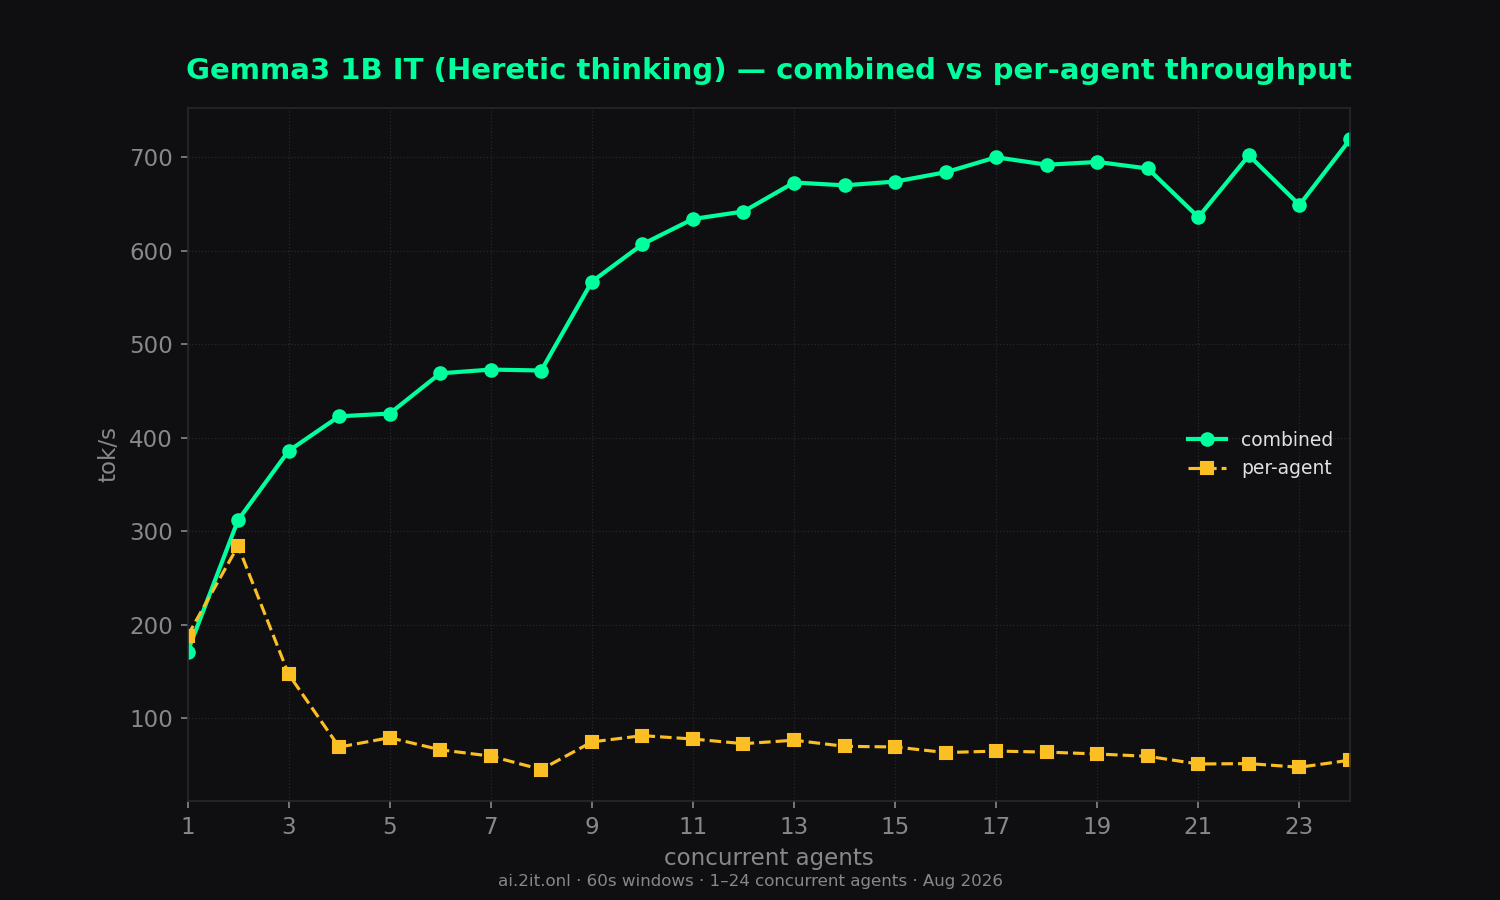
- All-in throughput: counting reasoning, combined throughput reaches 719 tok/s at 24 agents (4.2x single-agent), mid-way between llama-3.2 (652) and minicpm (983). Visible content tops out around ~454 tok/s.
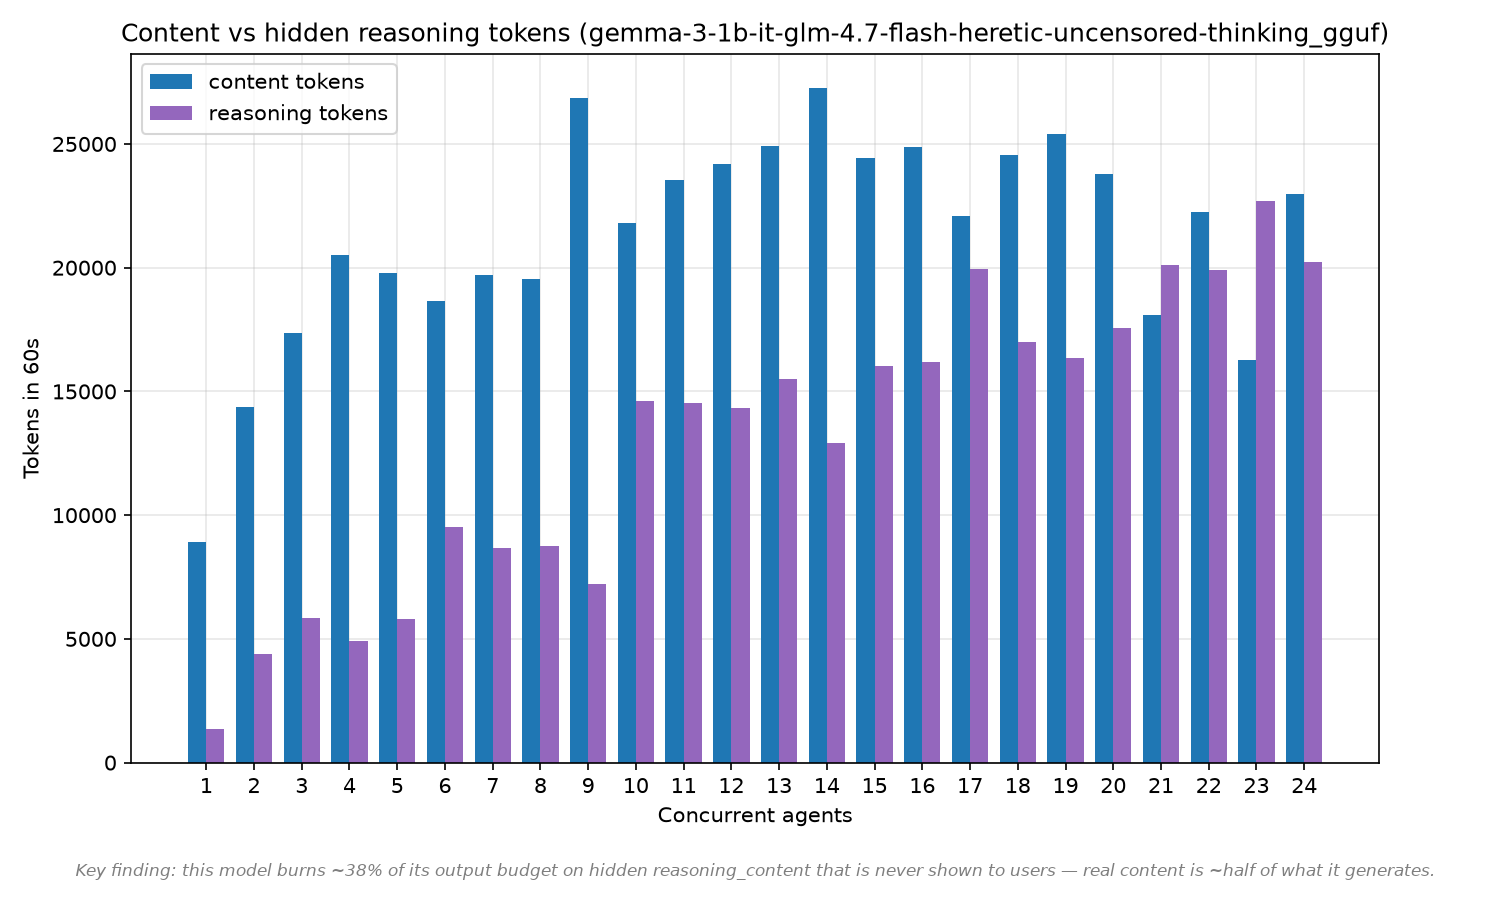
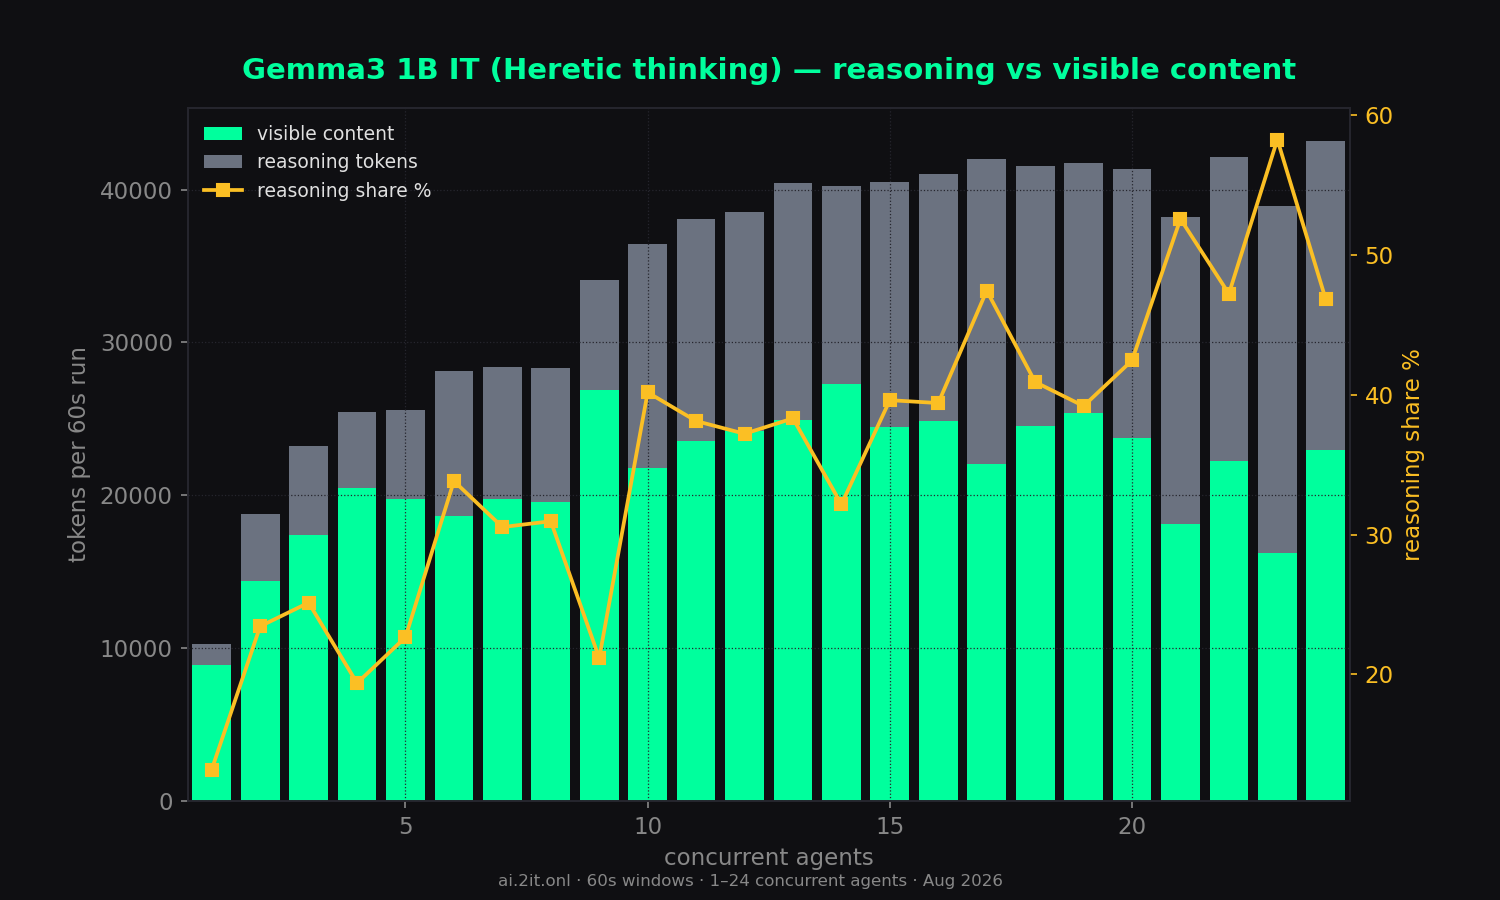
- Thinking share grows with load: reasoning is only ~13% of tokens at concurrency 1, but climbs to ~45–58% at 17–24 — the model thinks proportionally more when slots contend.
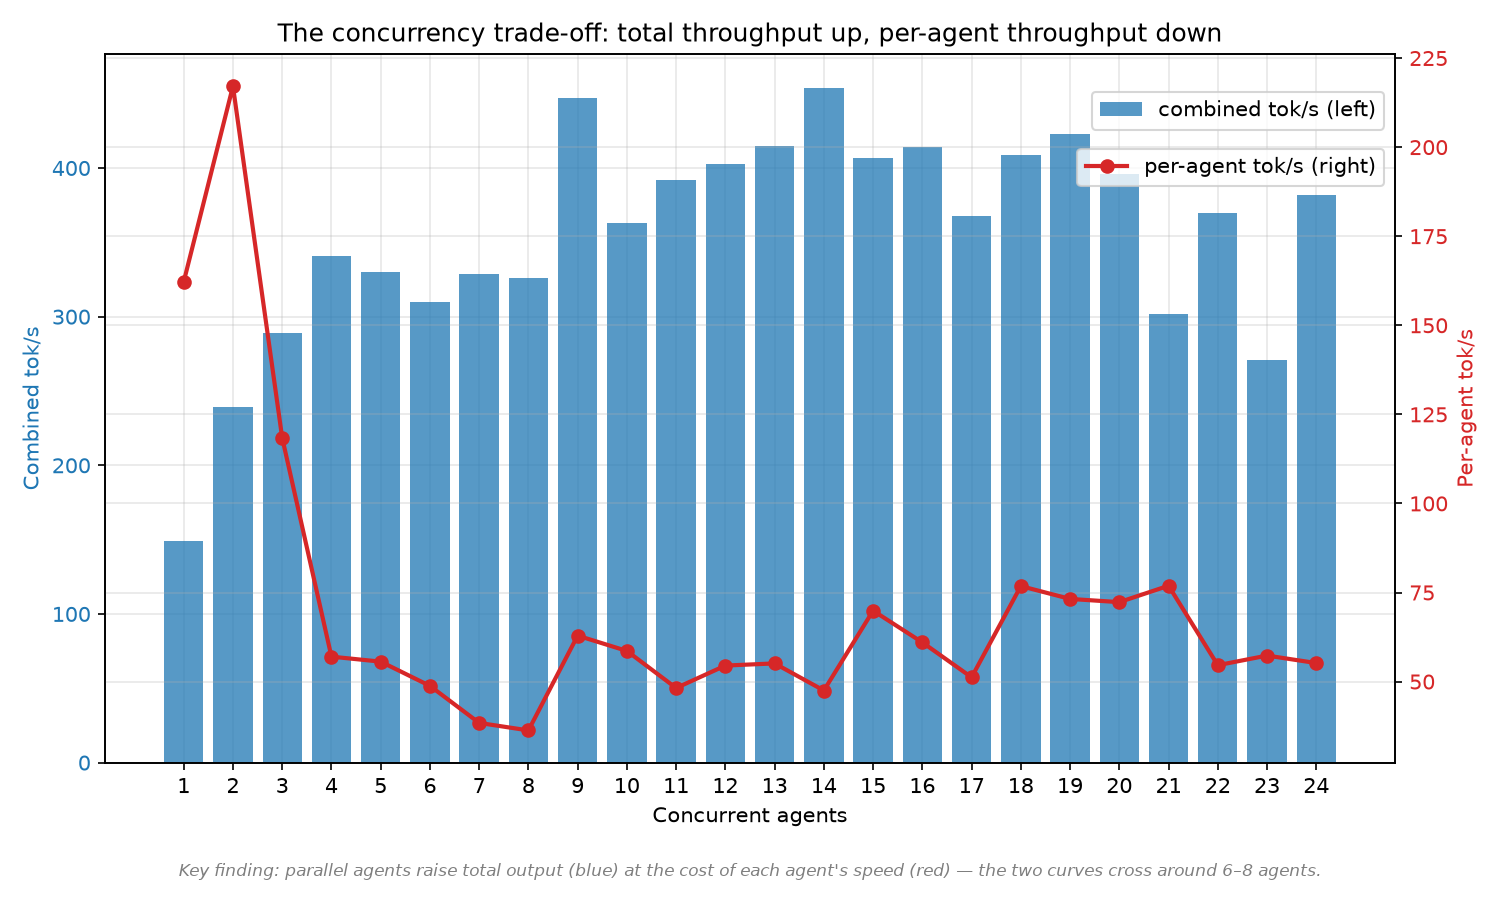
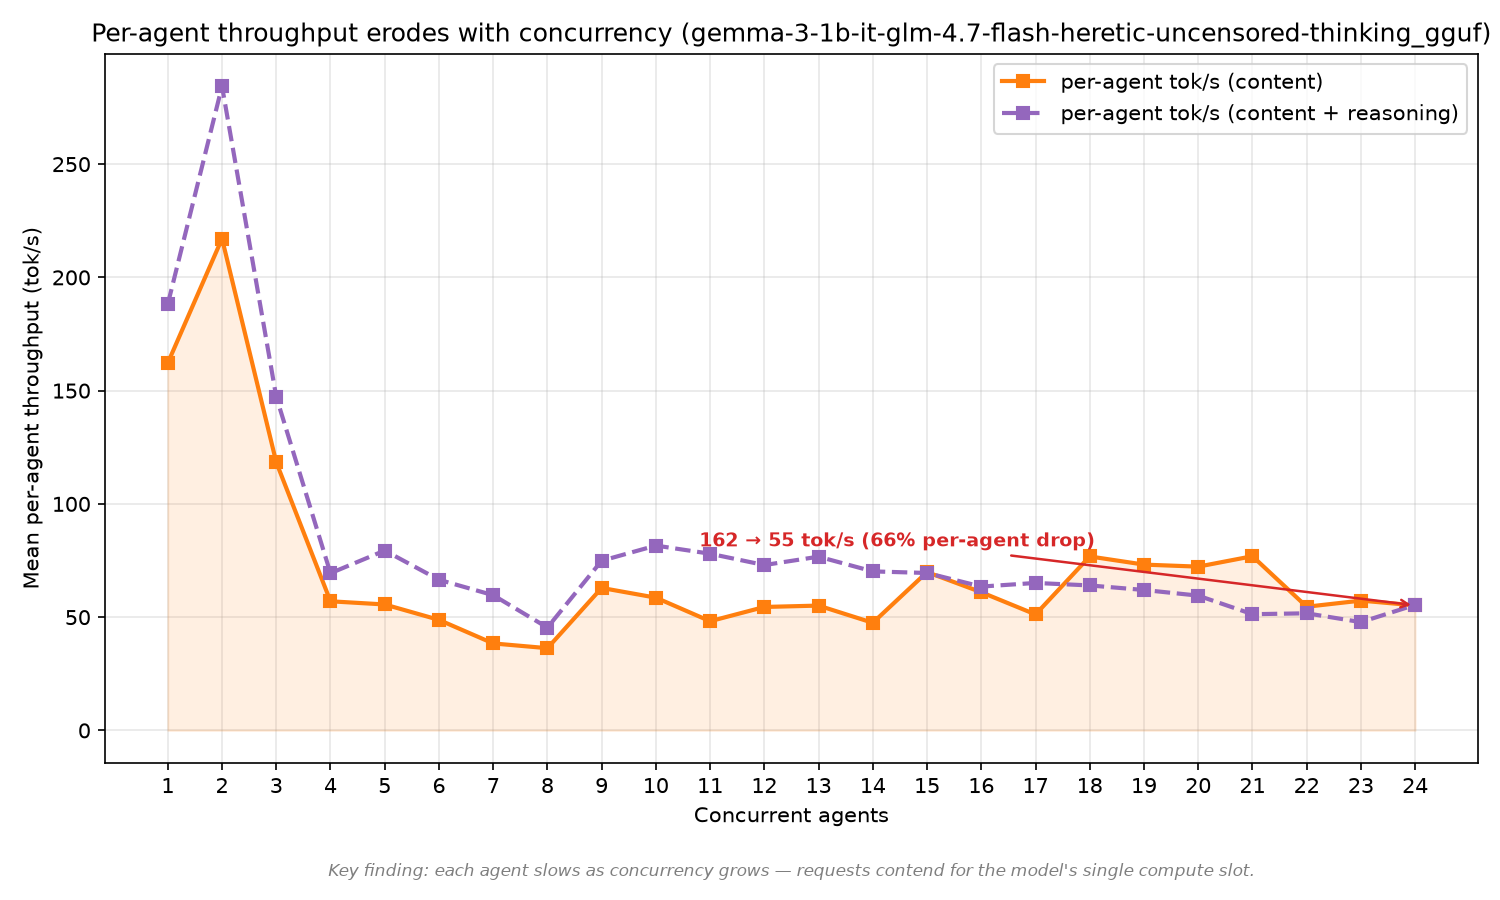
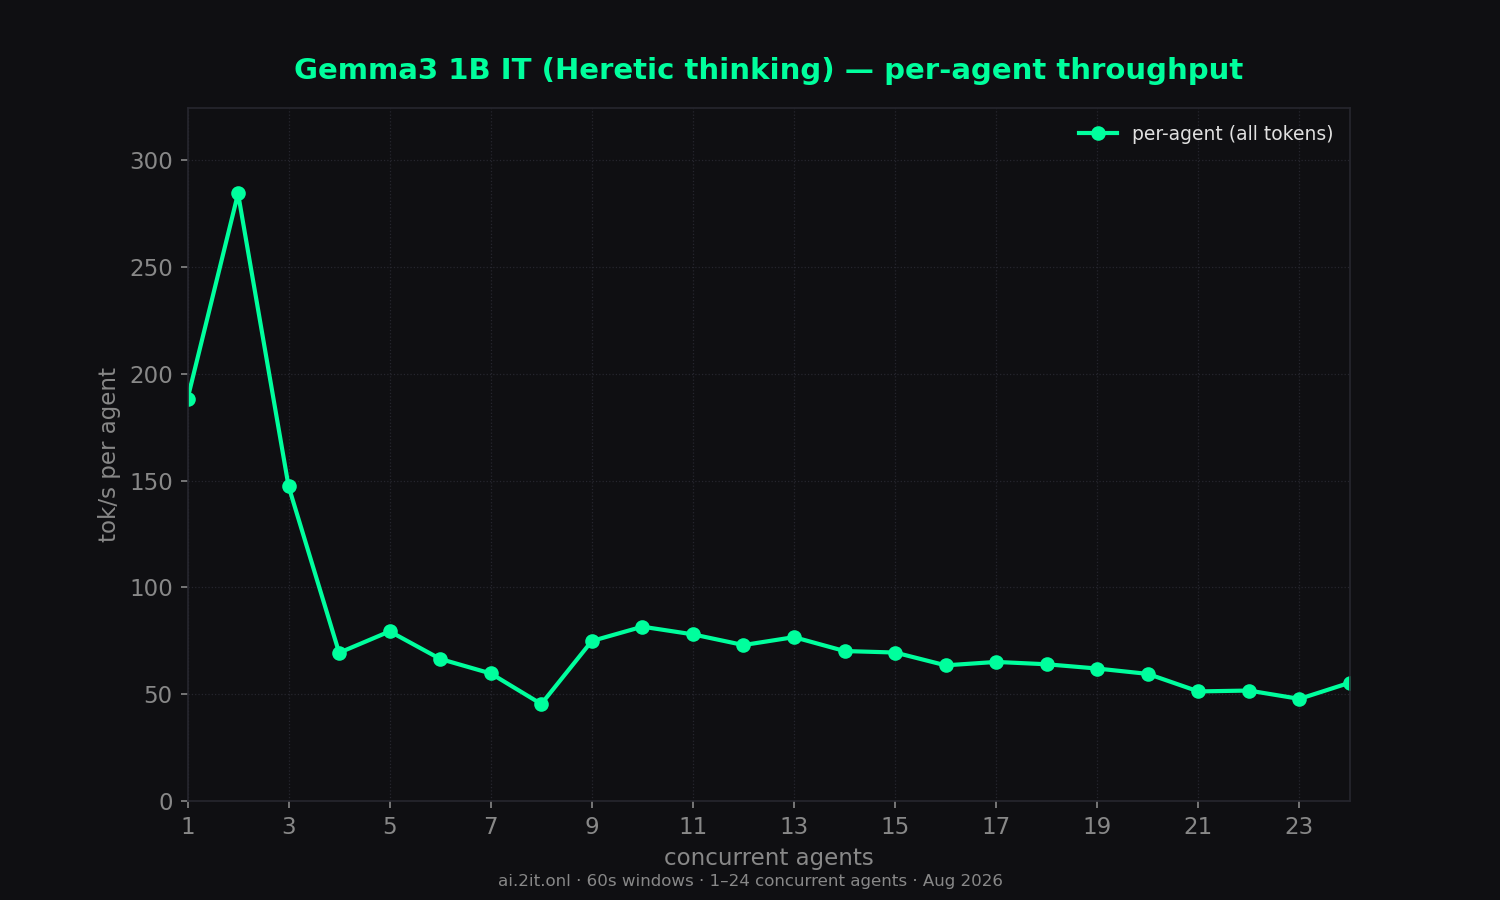
- Per-agent speed: falls from ~162–217 tok/s at low concurrency to ~36–77 at high concurrency — same slot-contention pattern as the other models.
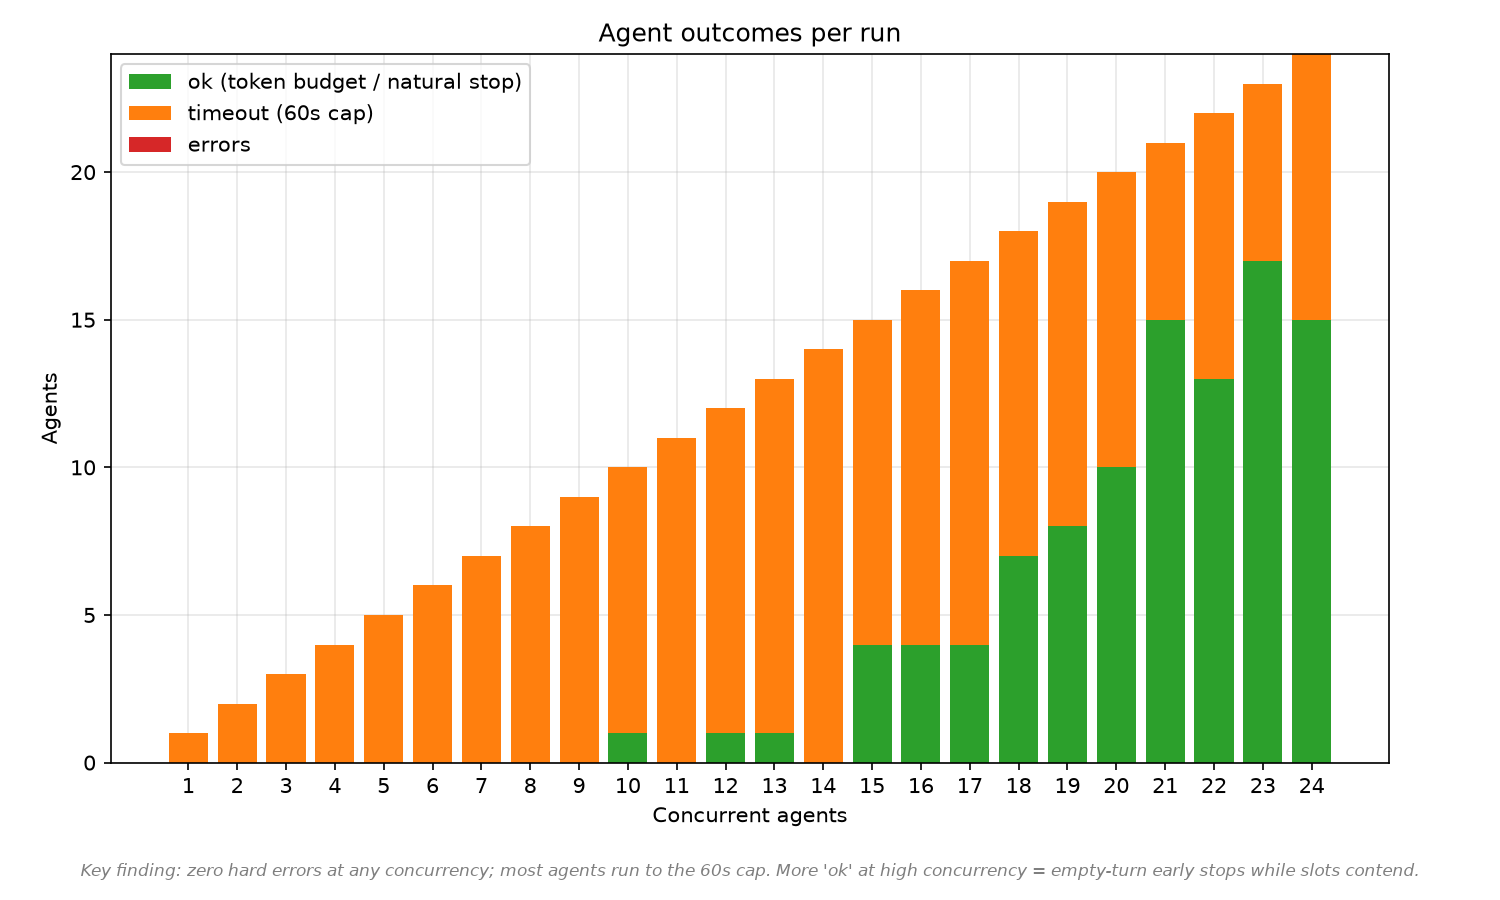
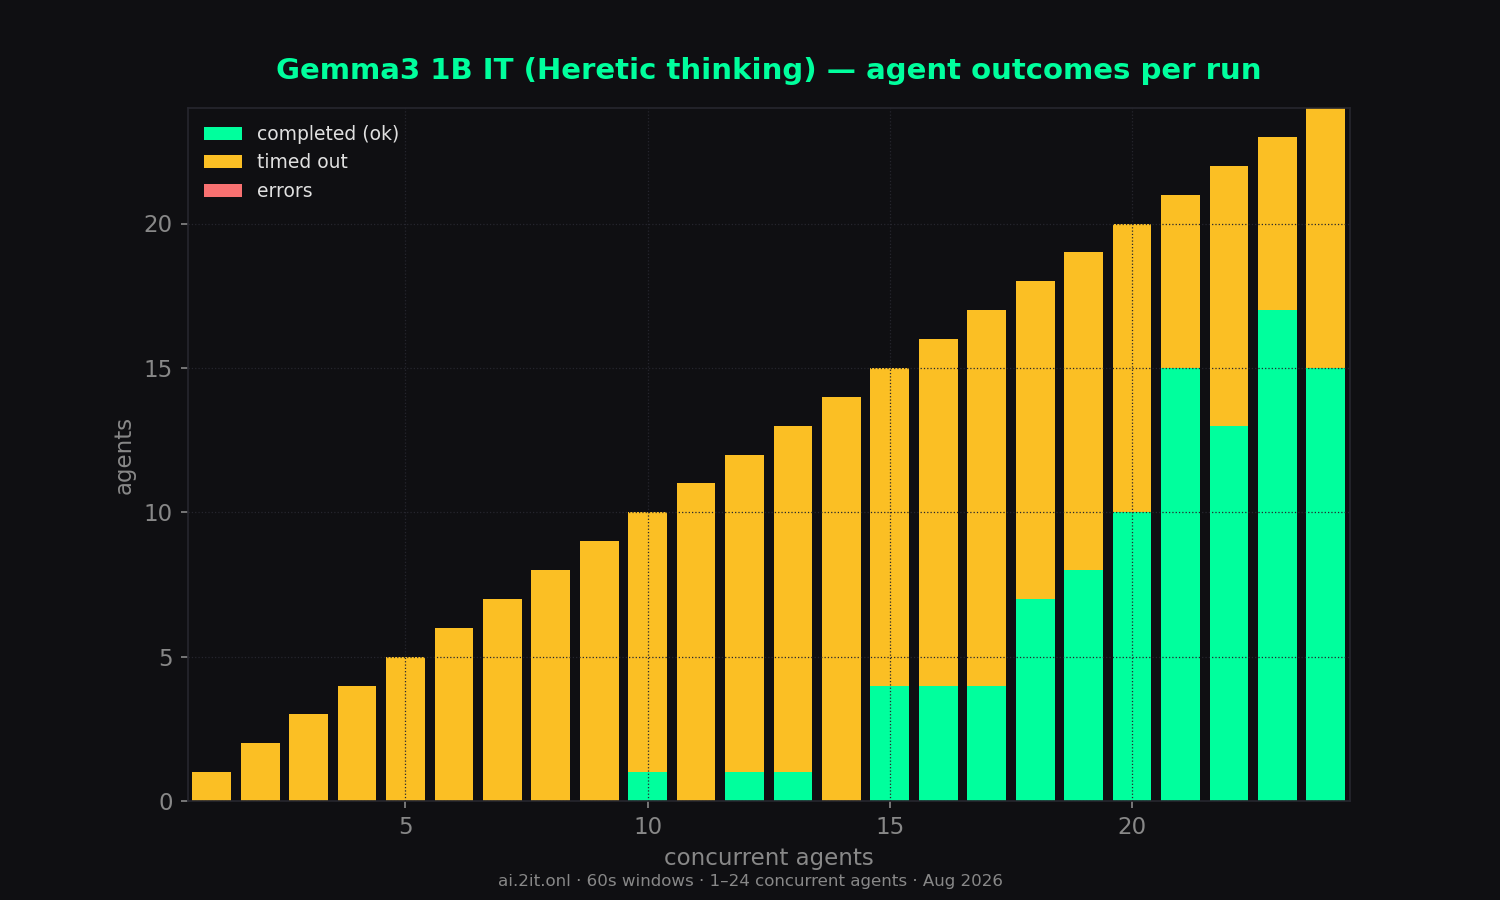
- Errors: 0 across all 24 runs.
Sweep — total concurrency 1–24
| agents | wall (s) | content | reason | total | comb tok/s | comb all | per-agent | per-agent all | scale % | TTFT mean | TTFT max | ok | timeout | err |
|---|---|---|---|---|---|---|---|---|---|---|---|---|---|---|
| 1 | 60.0 | 8,922 | 1,354 | 10,276 | 149 | 171 | 162.2 | 188.2 | 100% | 86ms | 86ms | 0 | 1 | 0 |
| 2 | 60.0 | 14,359 | 4,393 | 18,752 | 239 | 312 | 217.1 | 284.4 | 182% | 102ms | 114ms | 0 | 2 | 0 |
| 3 | 60.0 | 17,370 | 5,827 | 23,197 | 289 | 386 | 118.4 | 147.3 | 226% | 1.4s | 1.4s | 0 | 3 | 0 |
| 4 | 60.0 | 20,495 | 4,922 | 25,417 | 341 | 423 | 57.0 | 69.4 | 247% | 2.3s | 2.3s | 0 | 4 | 0 |
| 5 | 60.0 | 19,786 | 5,792 | 25,578 | 330 | 426 | 55.6 | 79.4 | 249% | 2.7s | 2.7s | 0 | 5 | 0 |
| 6 | 60.0 | 18,635 | 9,526 | 28,161 | 310 | 469 | 48.8 | 66.5 | 274% | 2.5s | 2.5s | 0 | 6 | 0 |
| 7 | 60.0 | 19,724 | 8,669 | 28,393 | 329 | 473 | 38.4 | 59.7 | 277% | 3.2s | 3.2s | 0 | 7 | 0 |
| 8 | 60.0 | 19,550 | 8,763 | 28,313 | 326 | 472 | 36.3 | 45.4 | 276% | 4.1s | 4.2s | 0 | 8 | 0 |
| 9 | 60.0 | 26,857 | 7,207 | 34,064 | 447 | 567 | 62.9 | 74.9 | 332% | 3.7s | 3.7s | 0 | 9 | 0 |
| 10 | 60.0 | 21,787 | 14,632 | 36,419 | 363 | 607 | 58.6 | 81.6 | 355% | 4.4s | 4.4s | 1 | 9 | 0 |
| 11 | 60.0 | 23,557 | 14,515 | 38,072 | 392 | 634 | 48.2 | 78.0 | 371% | 2.9s | 2.9s | 0 | 11 | 0 |
| 12 | 60.0 | 24,200 | 14,343 | 38,543 | 403 | 642 | 54.5 | 73.0 | 375% | 3.5s | 3.5s | 1 | 11 | 0 |
| 13 | 60.0 | 24,937 | 15,489 | 40,426 | 415 | 673 | 55.1 | 76.7 | 394% | 3.8s | 3.8s | 1 | 12 | 0 |
| 14 | 60.0 | 27,272 | 12,930 | 40,202 | 454 | 670 | 47.5 | 70.2 | 392% | 4.1s | 4.1s | 0 | 14 | 0 |
| 15 | 60.0 | 24,444 | 16,038 | 40,482 | 407 | 674 | 69.9 | 69.5 | 394% | 4.3s | 4.3s | 4 | 11 | 0 |
| 16 | 60.0 | 24,868 | 16,176 | 41,044 | 414 | 684 | 61.0 | 63.5 | 400% | 3.6s | 3.6s | 4 | 12 | 0 |
| 17 | 60.0 | 22,070 | 19,933 | 42,003 | 368 | 700 | 51.2 | 65.1 | 409% | 4.0s | 4.0s | 4 | 13 | 0 |
| 18 | 60.0 | 24,557 | 17,007 | 41,564 | 409 | 692 | 76.8 | 64.0 | 405% | 4.7s | 4.7s | 7 | 11 | 0 |
| 19 | 60.0 | 25,391 | 16,368 | 41,759 | 423 | 695 | 73.2 | 62.0 | 406% | 4.1s | 4.1s | 8 | 11 | 0 |
| 20 | 60.0 | 23,776 | 17,549 | 41,325 | 396 | 688 | 72.3 | 59.5 | 402% | 4.2s | 4.3s | 10 | 10 | 0 |
| 21 | 60.0 | 18,108 | 20,089 | 38,197 | 302 | 636 | 76.9 | 51.3 | 372% | 4.6s | 4.6s | 15 | 6 | 0 |
| 22 | 60.0 | 22,247 | 19,914 | 42,161 | 370 | 702 | 54.6 | 51.7 | 411% | 2.5s | 2.5s | 13 | 9 | 0 |
| 23 | 60.0 | 16,252 | 22,703 | 38,955 | 271 | 649 | 57.3 | 47.8 | 380% | 3.6s | 3.6s | 17 | 6 | 0 |
| 24 peak | 60.1 | 22,958 | 20,217 | 43,175 | 382 | 719 | 55.2 | 55.4 | 420% | 2.9s | 3.0s | 15 | 9 | 0 |
* burst artifact — agents queued ~11–16s then generated in a short burst; the per-agent timer inflates the number. Trust combined throughput and TTFT columns. Peak row = highest combined (all-token) throughput.
Charts
Raw data & downloads
- report.md6 KB
- sweep-summary.csv2 KB
- sweep-summary.json11 KB
- combined_throughput.png145 KB · original matplotlib export
- combined_vs_per_agent.png106 KB · original matplotlib export
- dashboard_1_24.png178 KB · original matplotlib export
- outcome_breakdown.png57 KB · original matplotlib export
- per_agent_throughput.png122 KB · original matplotlib export
- reasoning_vs_content.png65 KB · original matplotlib export
- scaling_efficiency.png86 KB · original matplotlib export
- time_to_first_token.png66 KB · original matplotlib export
- total_tokens_generated.png79 KB · original matplotlib export