
Testing LLM Concurrency on Consumer Hardware
I recently watched a YouTube video of someone testing a server-grade LLM hardware setup, pushing it to see just how much concurrency it could actually handle. It got me thinking: what can your own — perhaps a bit above-average — “gaming” / “workstation” PC really do? Especially within the limits of my RTX 5060 and its fast but limited 8GB of VRAM. I’ve been thinking about building a game or simulation driven by a high agent count, and I wanted to know what the feasible limit really is. That question brought me to these tests — and the results you’ll find below: the rig, the method, and every number and chart for all 19 models, individually and side by side. A note on authorship: that opening paragraph is my own words — the rest of this post is mostly AI-generated, though I have carefully gone over all of it, and every number has been checked against the raw benchmark data before publishing. And the dataset isn’t done yet — I plan to keep testing more models and will add them to the list as I do, so keep a lookout for new entries in the sidebar.
TL;DR
Concurrency scales on consumer hardware — pooled agents multiplied throughput
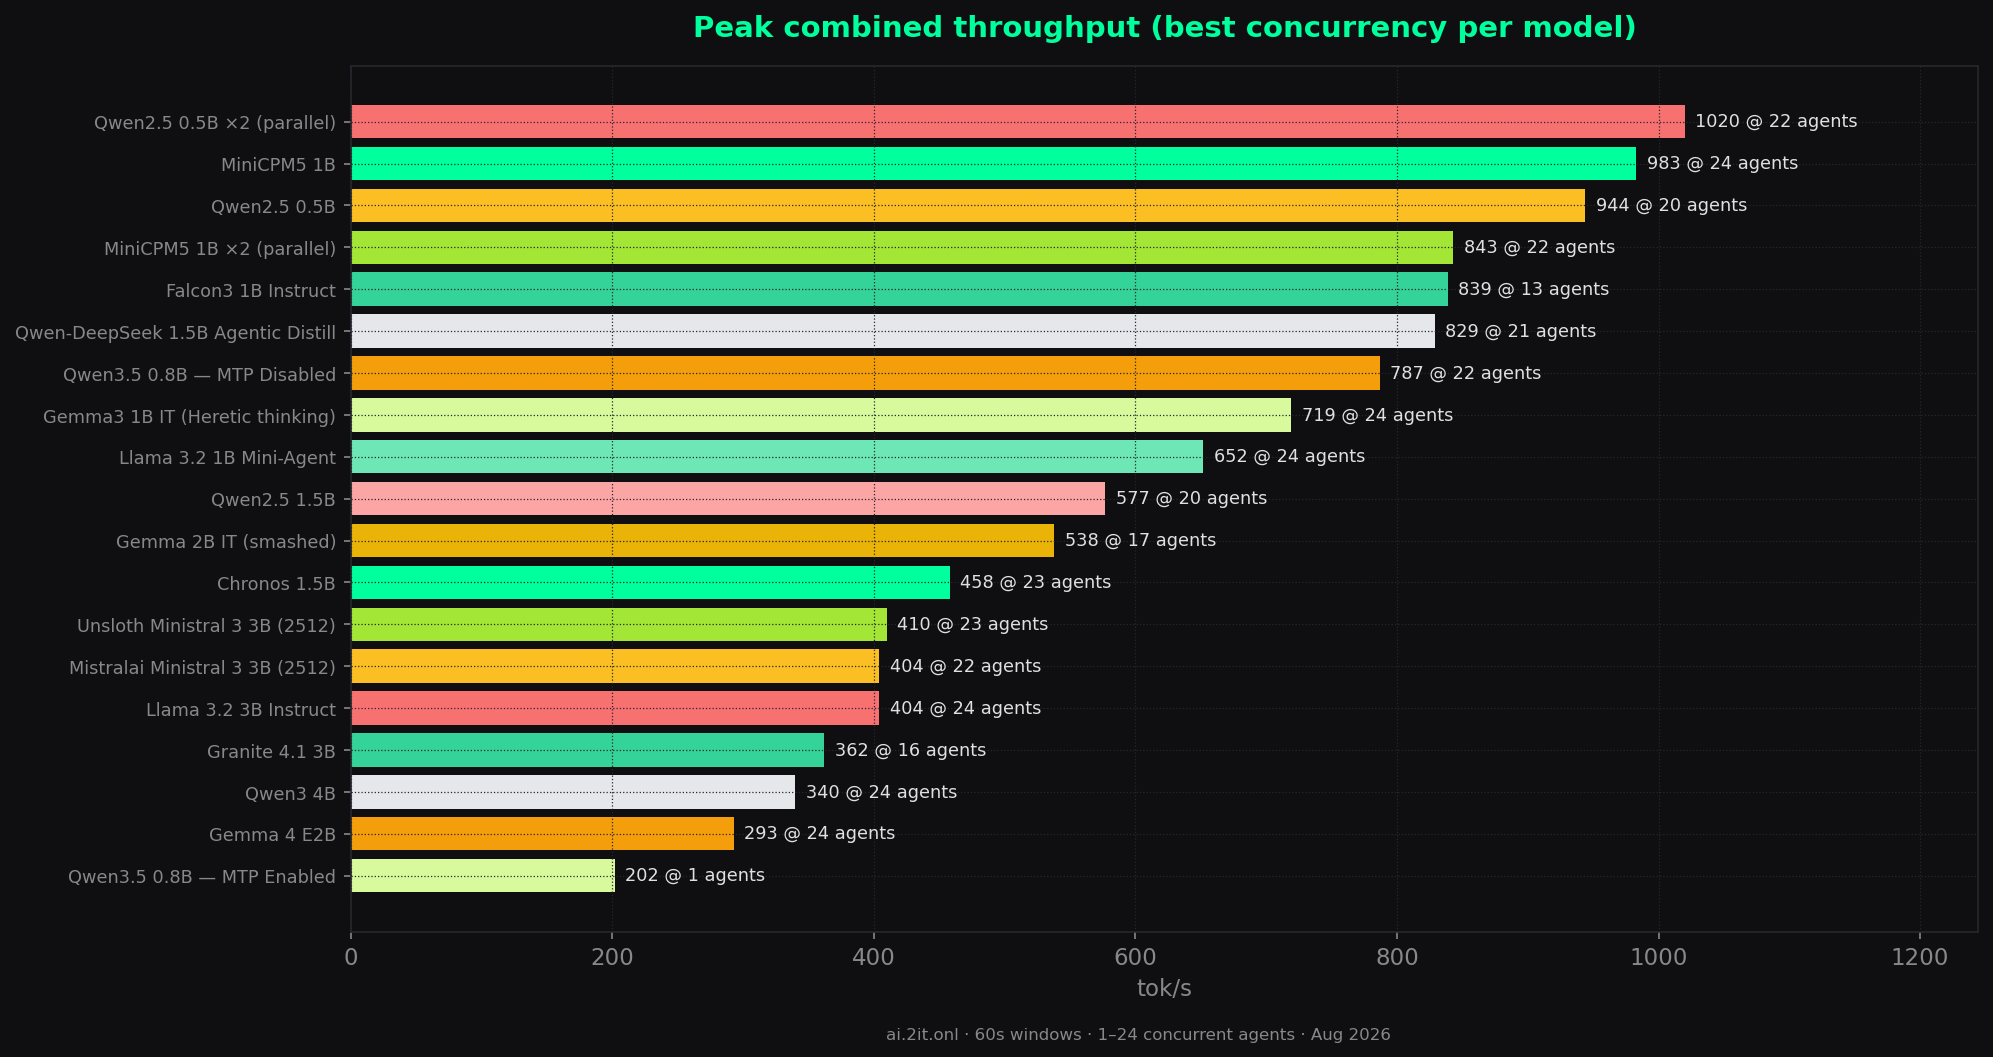
8.7x at best. The top all-in result was
MiniCPM5 1B at 983 tok/s
(433% of its solo speed).
The worst was a flatline: Qwen3.5 0.8B with MTP enabled never scaled at all
(~180 tok/s at any concurrency) because multi-token prediction serializes requests —
with MTP off the same model hit 787 tok/s.
Thinking models hide a huge share of their budget in reasoning_content (up to 100%),
and time-to-first-token degrades from milliseconds to tens of seconds under load. Errors across all
456 runs: zero.
Test rig
One desktop, fully loaded while every run executed. This is a dirty daily-driver environment — not a clean lab bench — and that was the point: the results are what real consumer hardware actually does.
Ryzen 9 9950X3D
Zen 5 V-Cache flagship. Core affinity is hard-locked to CCD0 so every LLM loop stays on the 3D V-Cache cores — zero cross-CCD thread-hopping on the Infinity Fabric.
32GB DDR5 6400
UCLK locked 1:1 with the memory controller for the lowest possible system↔GPU transfer latency during CPU-side MoE offload and high-concurrency prefill pooling.
RTX 5060 8GB GDDR7
Core + VRAM overclocked to squeeze maximum raw bandwidth out of the 128-bit bus. Every model was fully offloaded — the GPU is the engine room.
3 monitors, always on
2x ultrawide + 1x 4K primary, with a hardware-accelerated multi-tab Chrome profile running through every single benchmark run.
LM Studio configuration
Identical server settings for every model — differences (MTP, KV cache quant, context caps) are called out per model on its page.
⚒ Decode & scheduling
- GPU offloadMax for model
- CPU threads8 · CCD0
- Eval batch size2048
- Physical batch size512
- Max concurrency24
- Flash attentionOn
● Memory & context
- Context length34304 · max
- Unified KV cacheOn
- Offload KV to GPUOn
- Keep model in memoryOn
- Try mmap()On
- KV cache quantF16 · Q8_0 · Q4_0
⚡ Decoding strategy
- Speculative decodingOff
- MTP exceptionQwen3.5 0.8B
- KV quant rulesF16 ≤1.5B · Q8_0 2B · Q4_0 3B+
- Context cap32k or 8k · per model
Methodology
The harness is a zero-dependency Node agent loop (benchmark/benchmark.js) plus a
sweep driver (benchmark/sweep.js) streaming against LM Studio’s local OpenAI-compatible
endpoint. Each model got 24 sequential runs —
one per concurrency level 1–24 — of 60 seconds wall time. Each agent holds a
12,000-token budget, runs a multi-turn loop until budget or timeout, and samples
temperature 0.9.
Token-level timing captures TTFT (time to first token), per-stream token gaps,
content vs reasoning tokens, and per-agent/combined throughput. Reasoning is counted differently
per model family: reasoning_content streams (MiniCPM5, Qwen-DeepSeek, Chronos, Qwen3.5),
inline <think>...</think> tags stripped from content (Gemma Heretic), or not at all
(the clean non-thinking models). Per-model pages note which.
One honesty flag: some per-agent numbers carry * — agents that sat queued for
~11–16s and then generated in a short burst report inflated per-agent tok/s. Those are
timing artifacts; combined throughput and TTFT are the trusted columns.
Leaderboard — side by side
| # | Model | Solo tok/s | Peak tok/s | @ agents | Scaling | TTFT solo | TTFT @ peak | Content @24 | Reasoning @24 | Errors |
|---|---|---|---|---|---|---|---|---|---|---|
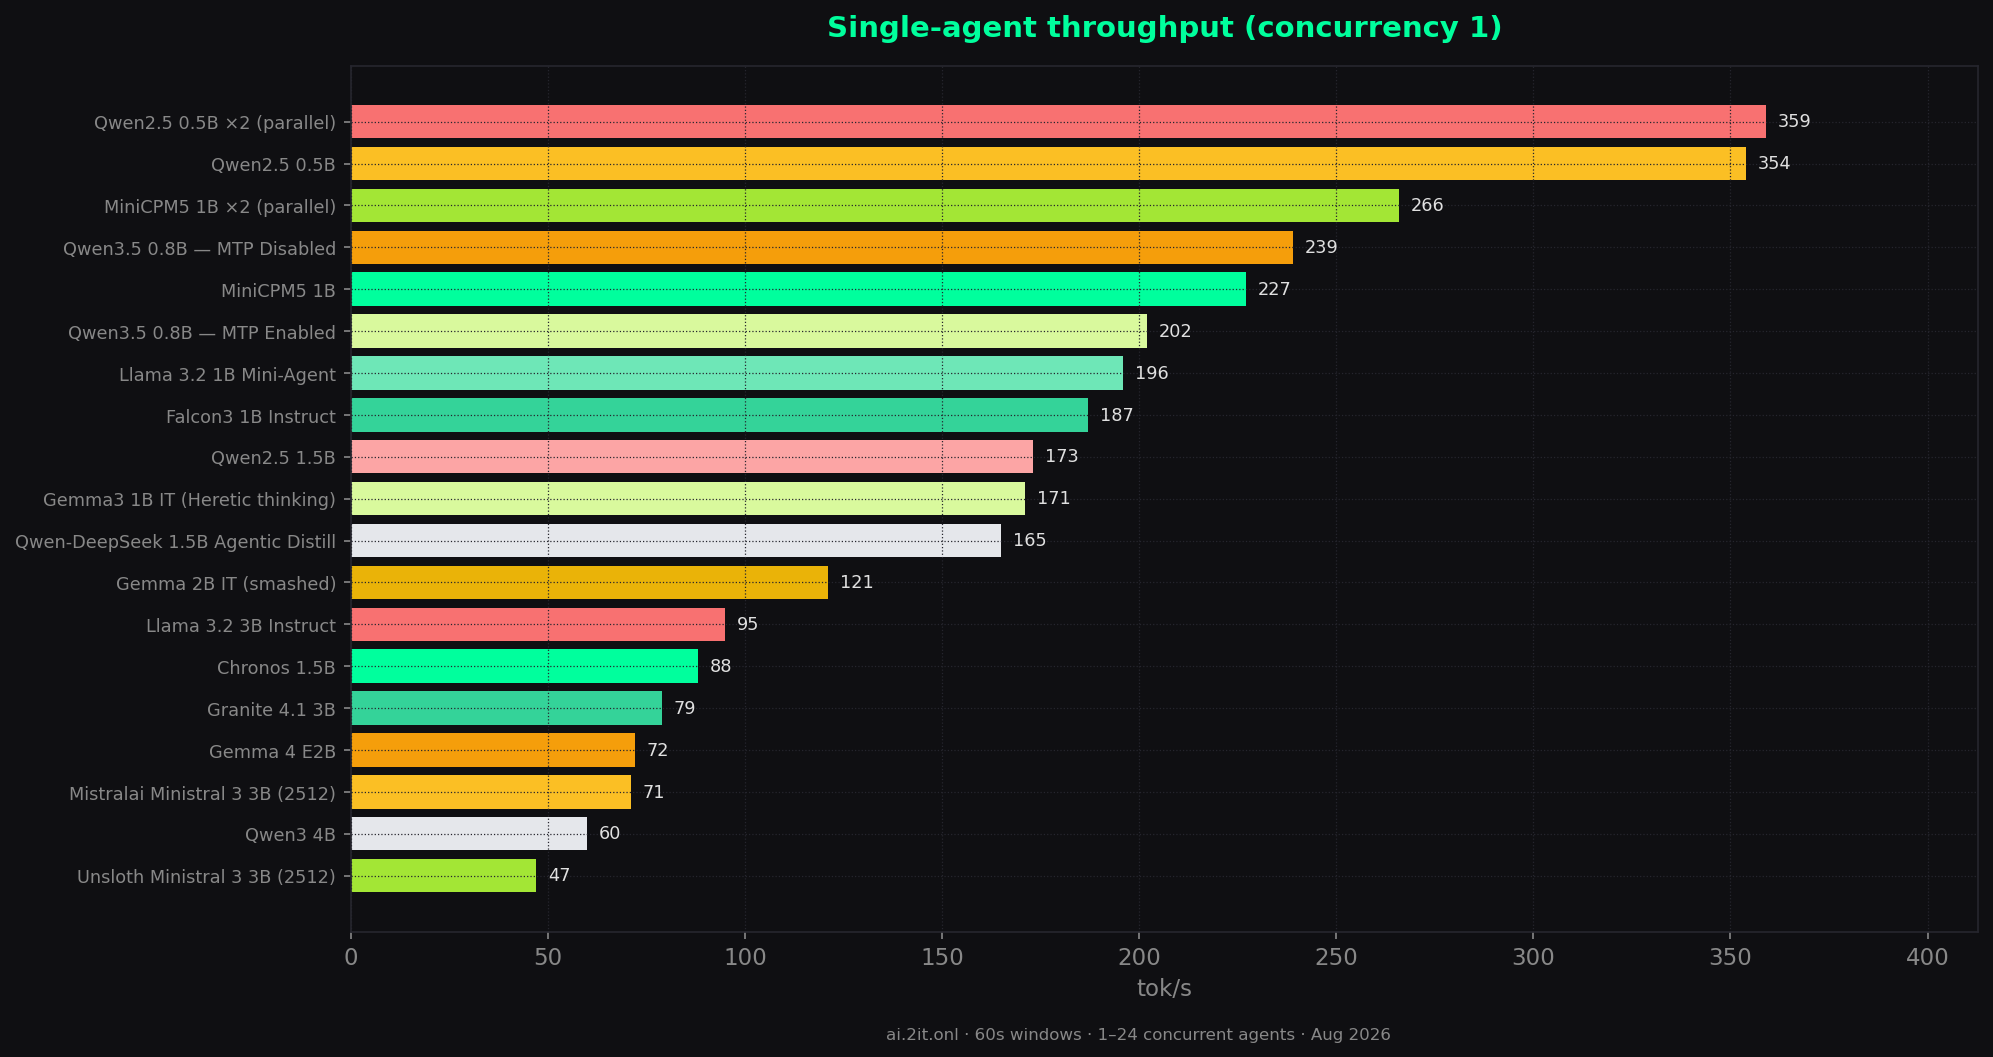
| 1 | MiniCPM5 1B MiniCPM · 1B · KV F16 · thinking | 227 | 983 | 24 | 433% | 1.5s | 7.0s | 48% | 52% | 0 |
| 2 | MiniCPM5 1B ×2 (parallel)† 2× parallel MiniCPM · 1B · KV F16 · thinking | 266 | 843 | 22 | 317% | 2.4s | 26.9s | 68% | 32% | 0 |
| 3 | Qwen2.5 0.5B Qwen · 0.5B · KV F16 | 354 | 944 | 20 | 267% | 55ms | 4.4s | 100% | 0% | 0 |
| 4 | Qwen2.5 0.5B ×2 (parallel)‡ 2× parallel Qwen · 0.5B · KV F16 | 359 | 1,020 | 22 | 284% | 7.6s | 21.0s | 100% | 0% | 0 |
| 5 | Falcon3 1B Instruct Falcon · 1B · KV F16 | 187 | 839 | 13 | 449% | 1.0s | 677ms | 100% | 0% | 0 |
| 6 | Qwen-DeepSeek 1.5B Agentic Distill Qwen · 1.5B · KV F16 · thinking | 165 | 829 | 21 | 502% | 4.2s | 23.4s | 32% | 68% | 0 |
| 7 | Qwen3.5 0.8B — MTP Disabled Qwen · 0.8B · KV F16 · thinking | 239 | 787 | 22 | 329% | 12.0s | — | 0% | 100% | 0 |
| 8 | Gemma3 1B IT (Heretic thinking) Gemma · 1B · KV F16 · thinking | 171 | 719 | 24 | 420% | 86ms | 2.9s | 53% | 47% | 0 |
| 9 | Llama 3.2 1B Mini-Agent Llama · 1B · KV F16 | 196 | 652 | 24 | 333% | 880ms | 674ms | 100% | 0% | 0 |
| 10 | Qwen2.5 1.5B Qwen · 1.5B · KV F16 | 173 | 577 | 20 | 334% | 108ms | 626ms | 100% | 0% | 0 |
| 11 | Gemma 2B IT (smashed) Gemma · 2B · KV Q8_0 | 121 | 538 | 17 | 445% | 94ms | 609ms | 100% | 0% | 0 |
| 12 | Chronos 1.5B Chronos · 1.5B · KV F16 · thinking | 88 | 458 | 23 | 520% | 226ms | 17.3s | 6% | 94% | 0 |
| 13 | Unsloth Ministral 3 3B (2512) Ministral · 3B · KV Q4_0 | 47 | 410 | 23 | 872% | 115ms | 15.0s | 100% | 0% | 0 |
| 14 | Mistralai Ministral 3 3B (2512) Ministral · 3B · KV Q4_0 | 71 | 404 | 22 | 569% | 92ms | 15.6s | 100% | 0% | 0 |
| 15 | Llama 3.2 3B Instruct Llama · 3B · KV Q4_0 | 95 | 404 | 24 | 425% | 117ms | 16.1s | 100% | 0% | 0 |
| 16 | Granite 4.1 3B IBM Granite · 3B · KV Q4_0 | 79 | 362 | 16 | 458% | 191ms | 19.1s | 100% | 0% | 0 |
| 17 | Qwen3 4B Qwen · 4B · KV Q4_0 · thinking | 60 | 340 | 24 | 567% | 11.8s | 51.6s | 5% | 95% | 0 |
| 18 | Gemma 4 E2B Gemma · 2B · KV Q8_0 · thinking | 72 | 293 | 24 | 407% | 11.8s | 41.4s | 1% | 99% | 0 |
| 19 | Qwen3.5 0.8B — MTP Enabled Qwen · 0.8B · KV F16 · thinking | 202 | 202 | 1 | 100% | 21.8s | 21.8s | 0% | 100% | 0 |
Podium rows mark the top 3 by peak combined throughput. Solo = concurrency 1 · Peak = highest combined all-token tok/s across 1–24 · Scaling = peak as % of solo · Content/Reasoning @24 = token mix at 24 agents · Every model page has the full table and raw data.
Footnotes
† Qwen2.5 0.5B ×2 (parallel): the same model loaded as two LM Studio instances running in
parallel (two API slots sharing the GPU), with N agents on each instance at every level — total concurrency 2–48.
For comparability it is listed here at its ≤24-agent window only (peak inside that window: 1020 tok/s at 22 agents);
the full 2–48 sweep is on its own page. Its max achievement: 1815 tok/s at 38 total agents — roughly 2x the
single-instance ceiling of ~944 tok/s.
‡ MiniCPM5 1B ×2 (parallel): the same thinking model as two parallel instances — listed here at its
≤24-agent window (peak 843 tok/s at 22 agents). Its max achievement:
1698 tok/s at 48 total agents — vs the single-instance peak of ~983 tok/s, and the highest all-token
number recorded in any run so far, parallel or not.
Side-by-side charts
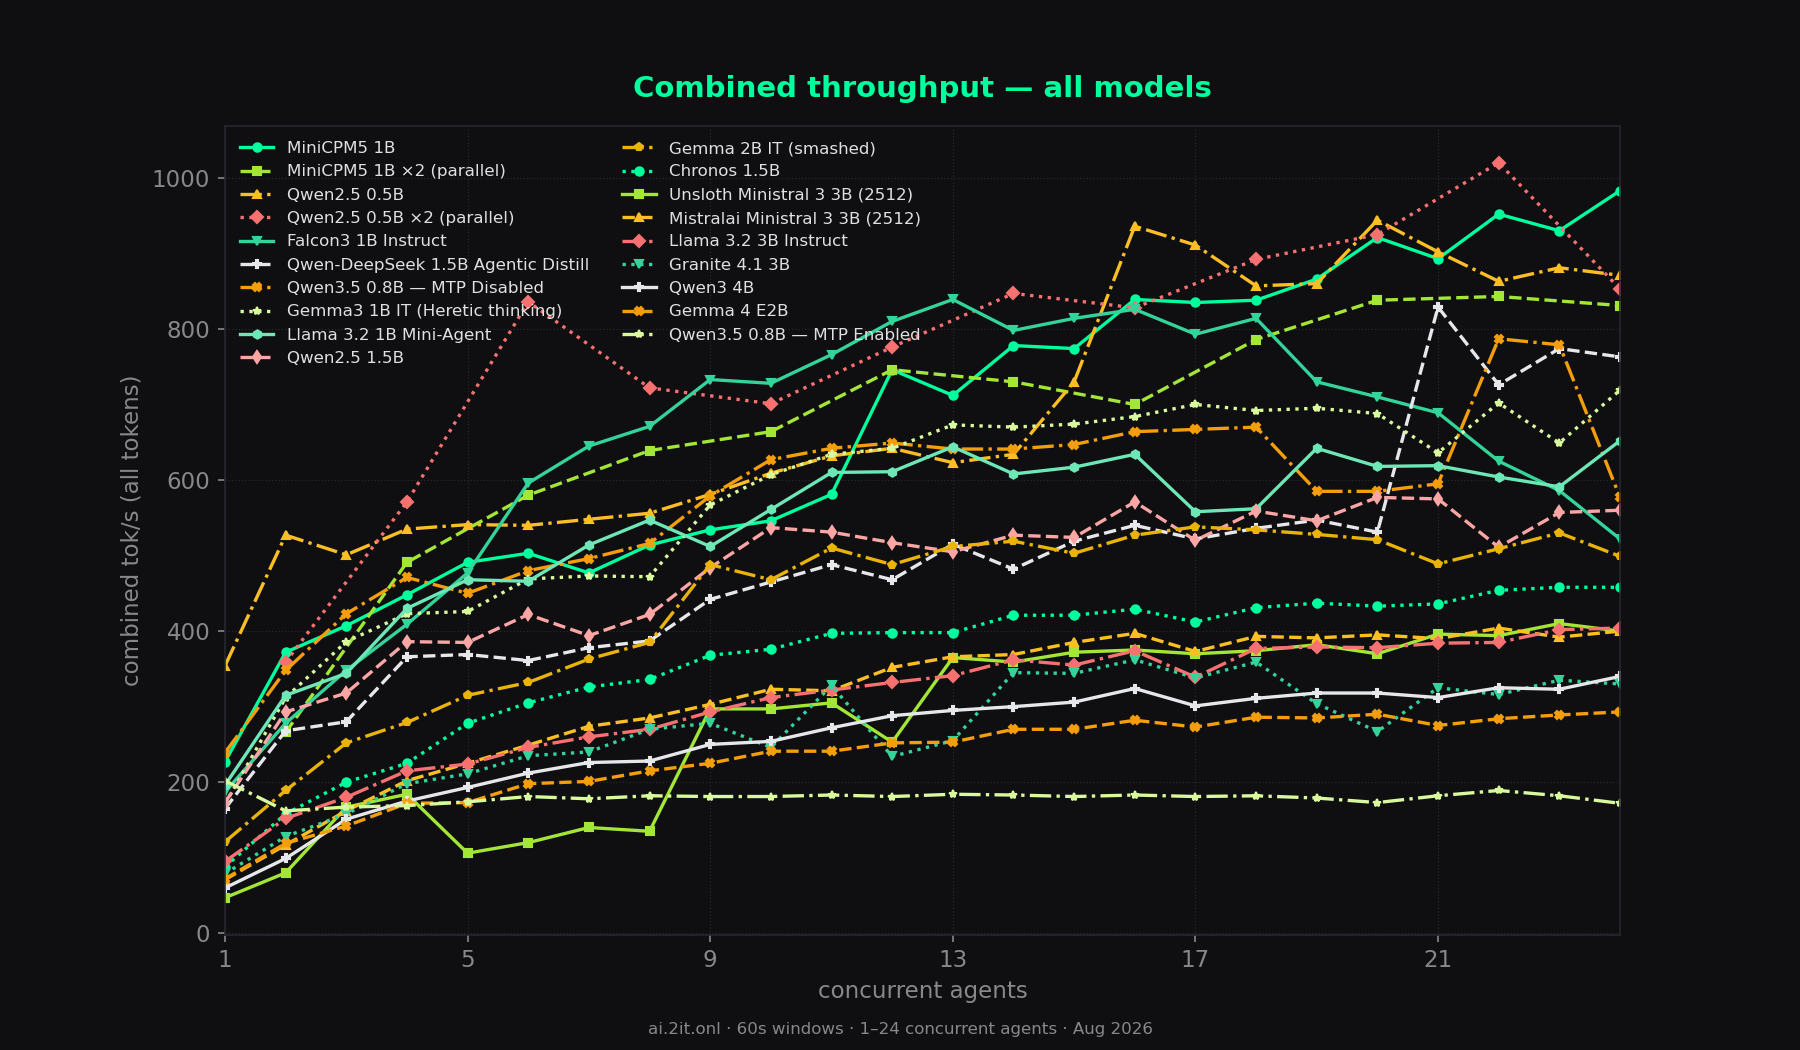
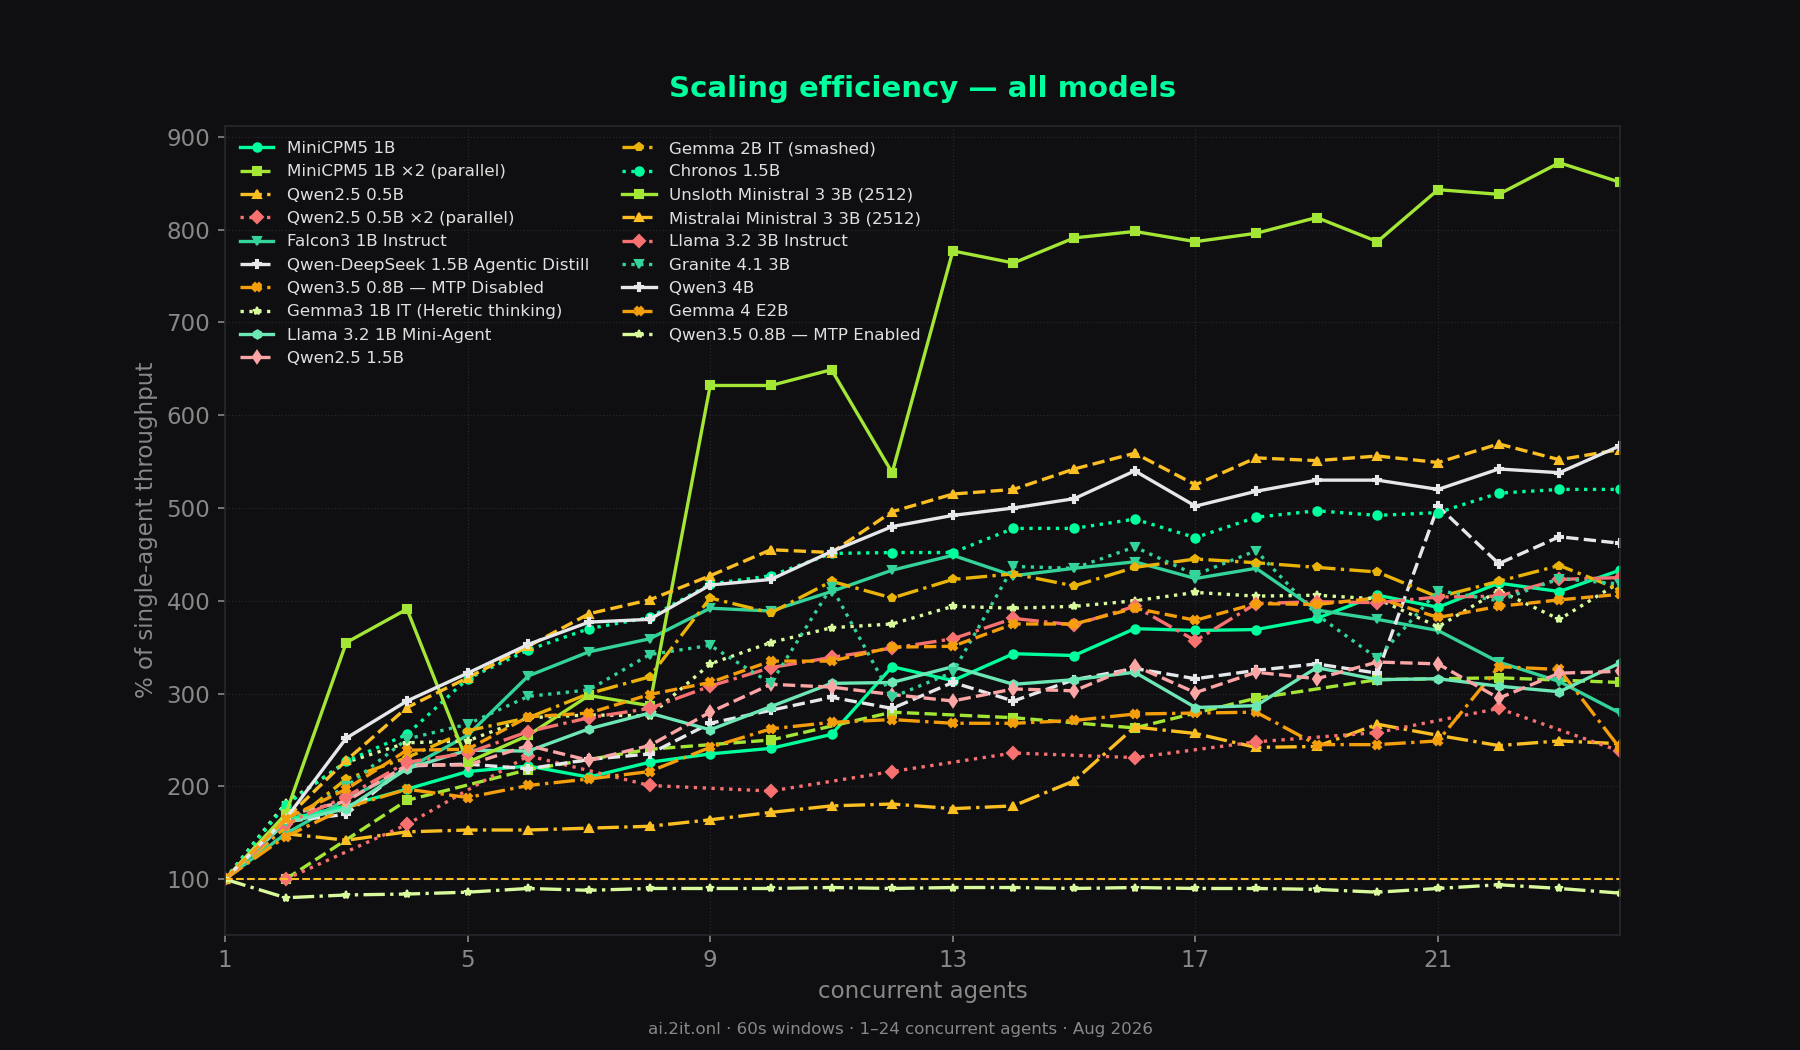
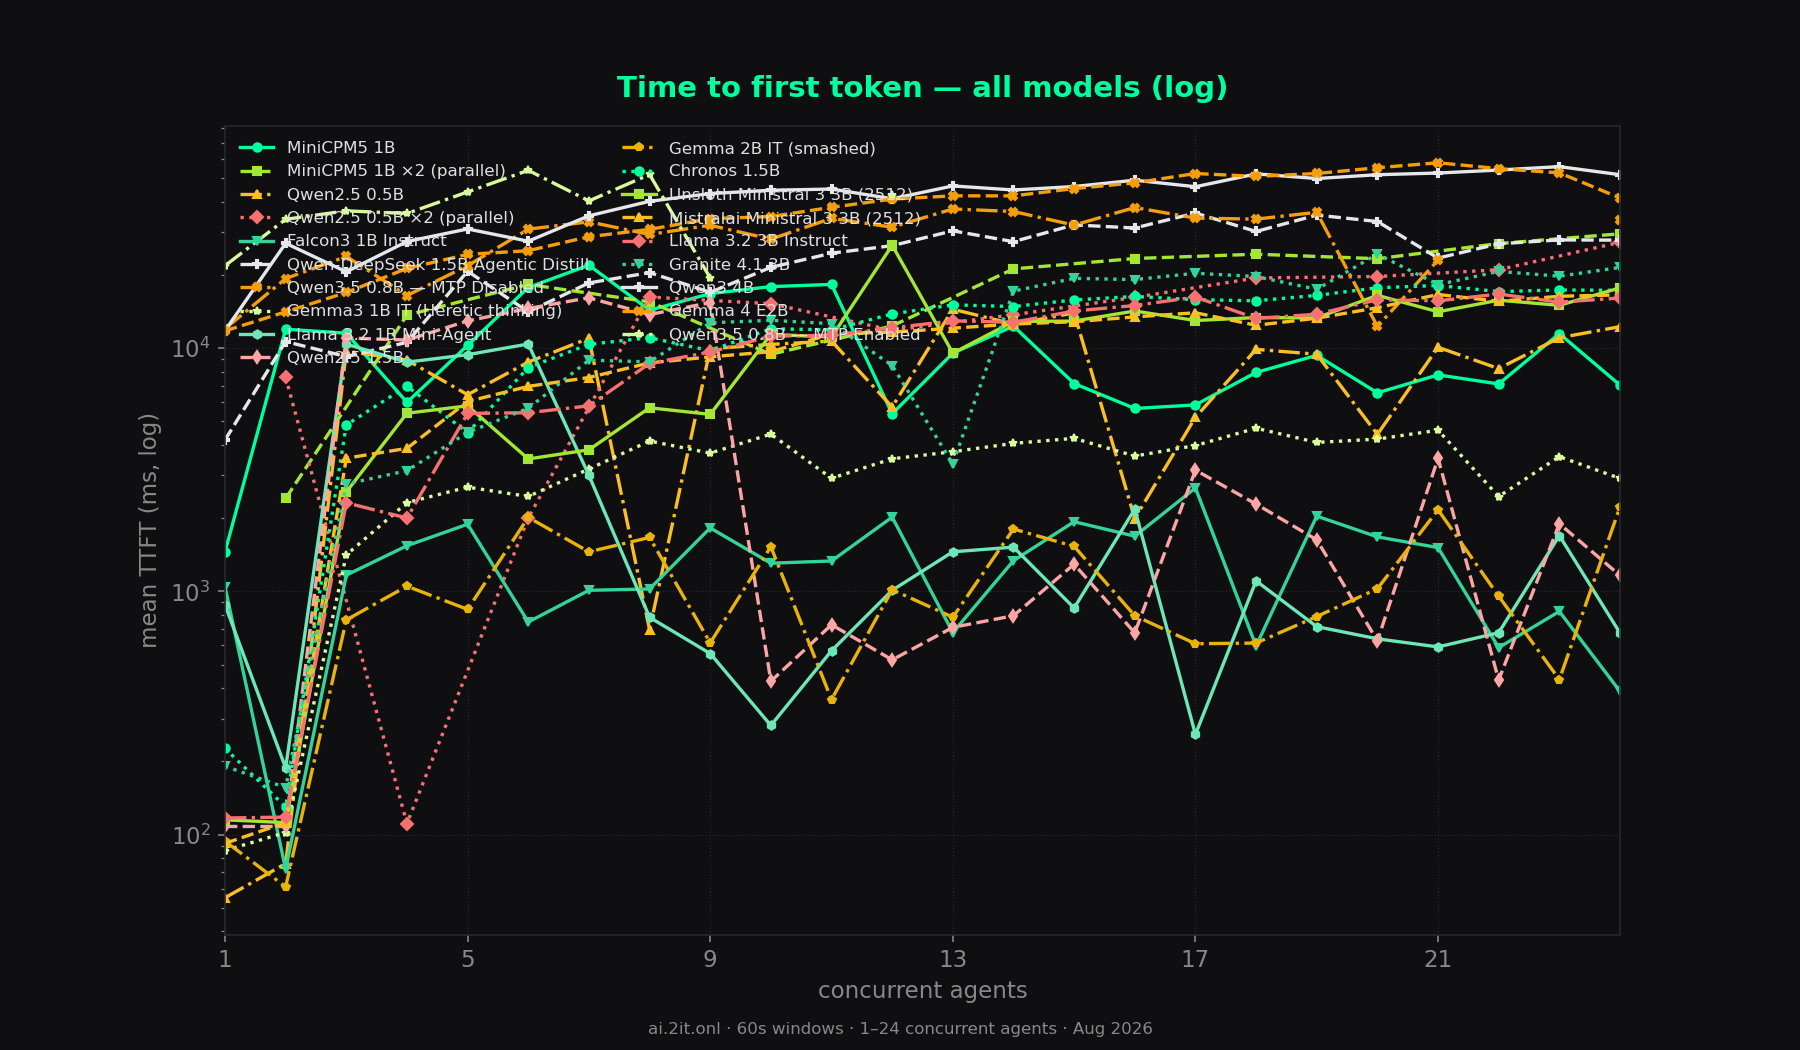
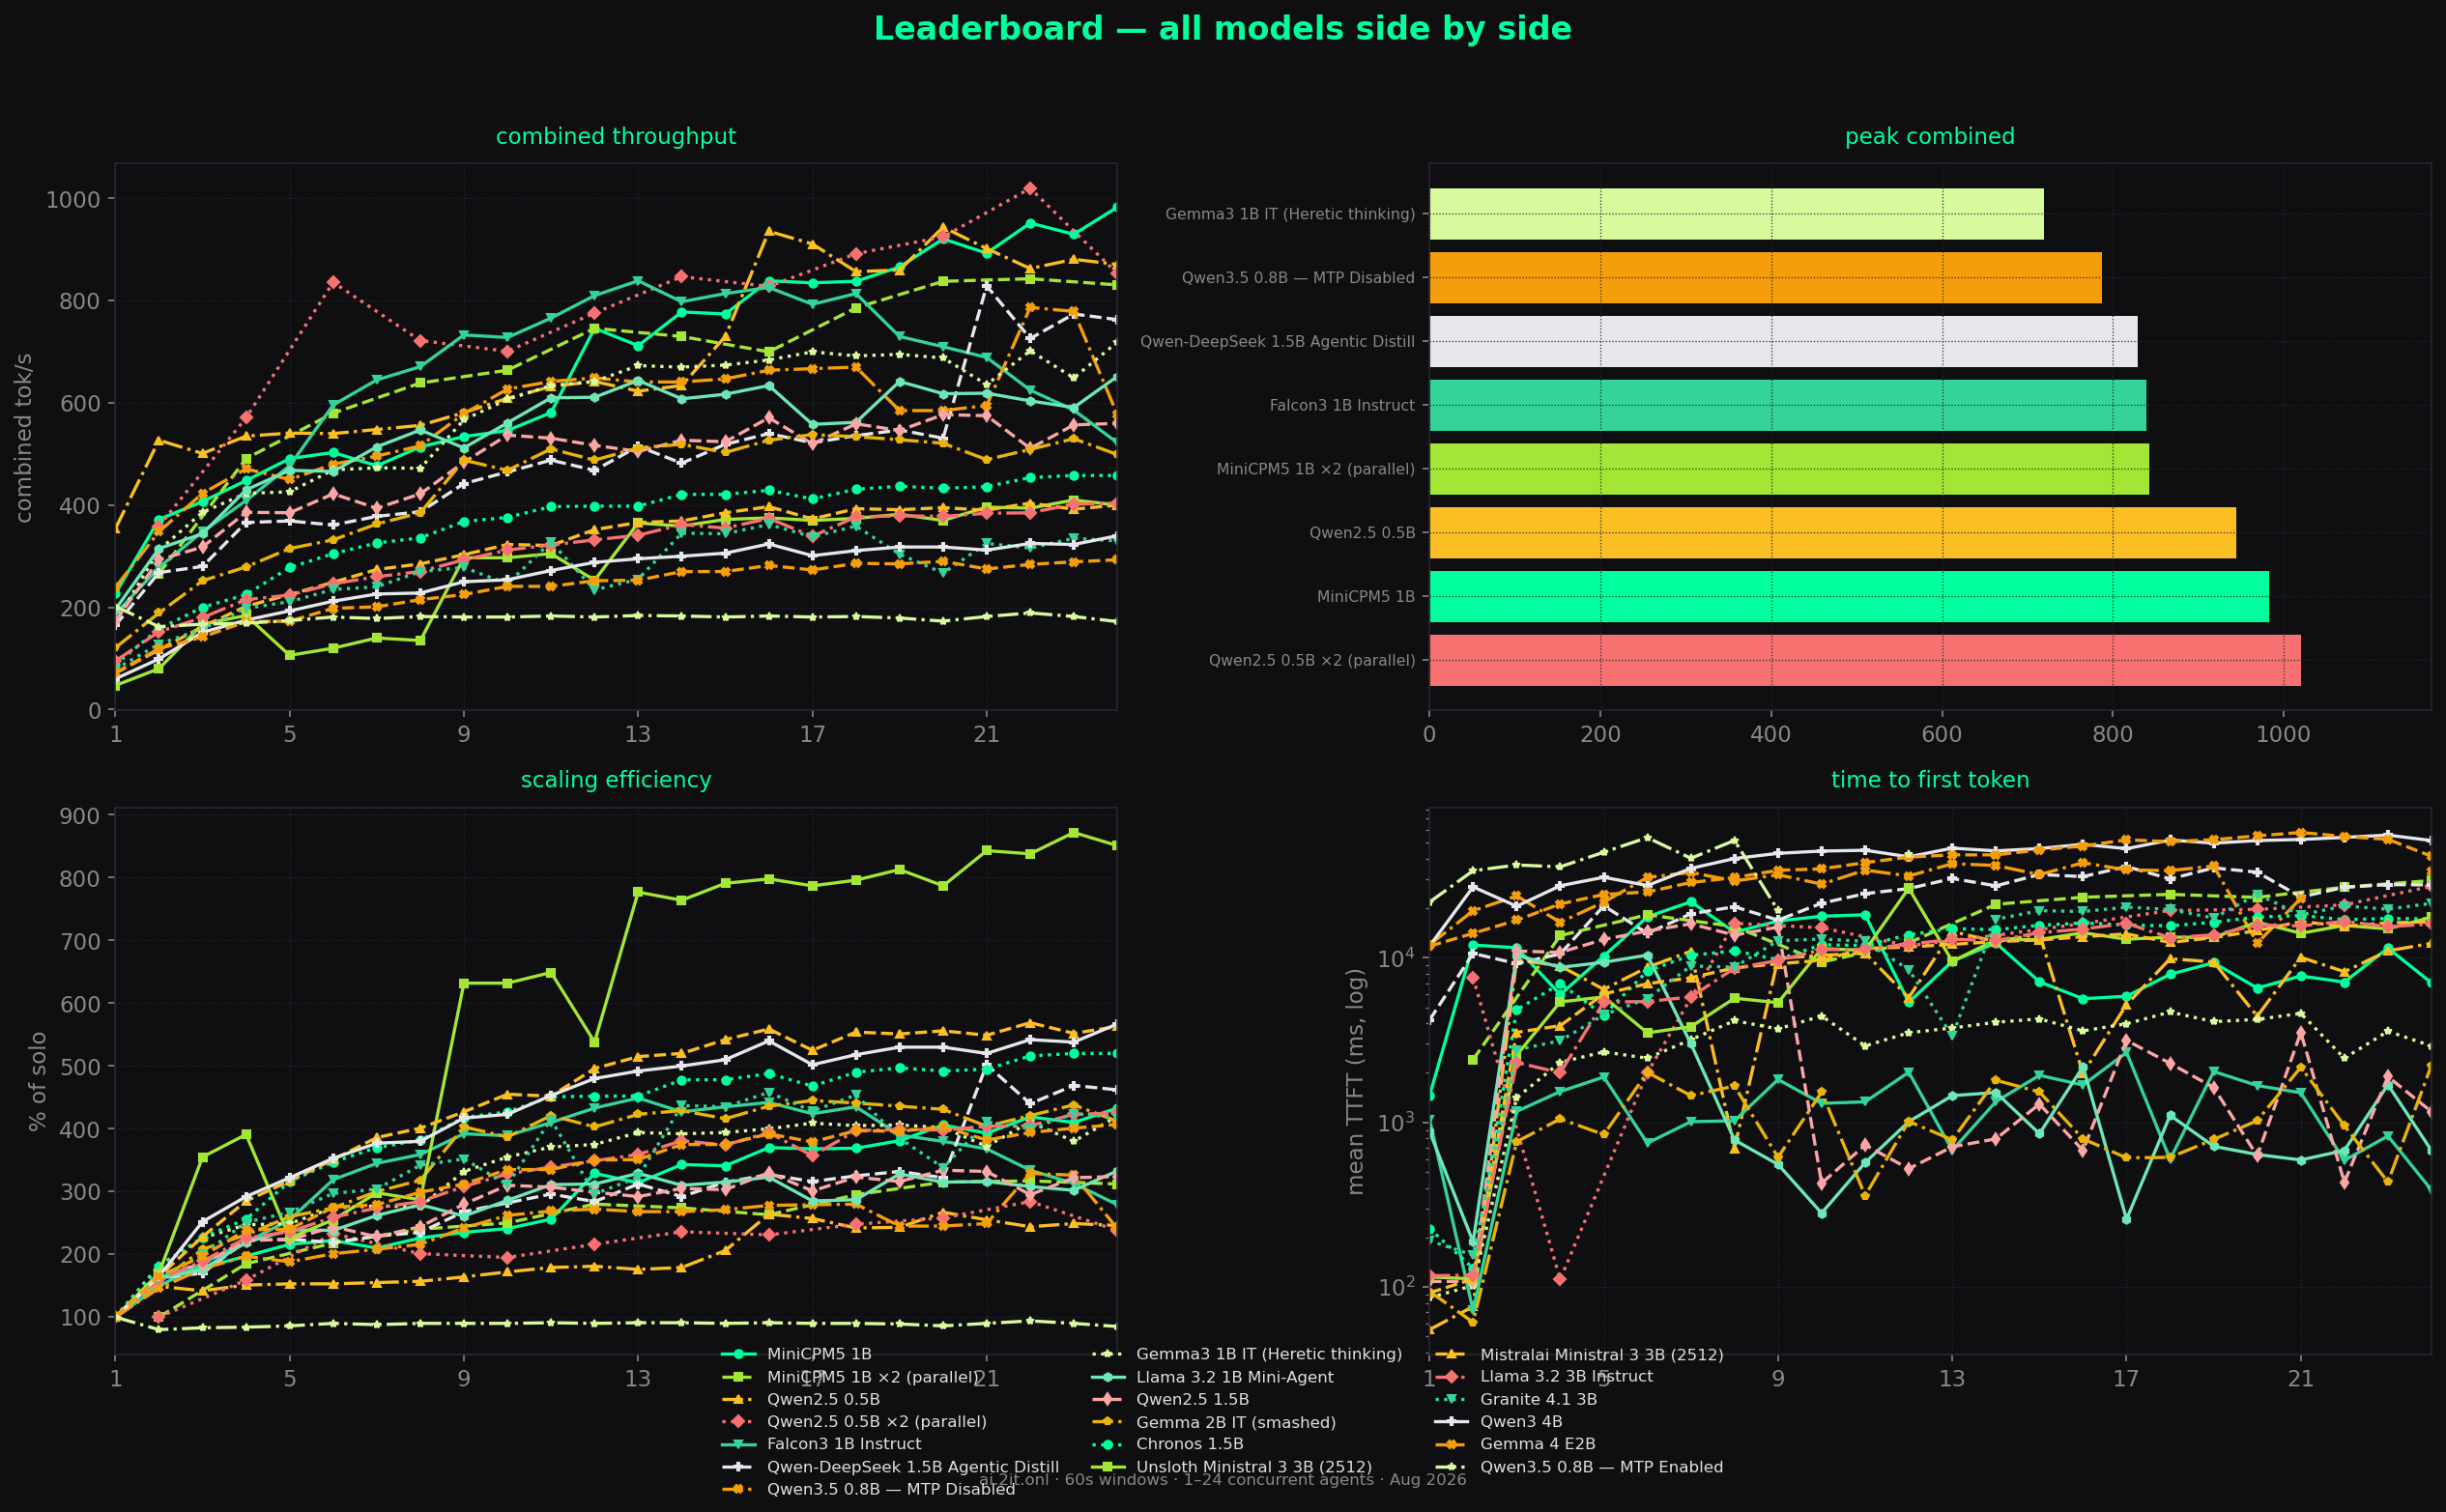
All charts below are generated from the sweep JSON in the site’s dark theme; original matplotlib exports are downloadable per model. The parallel runs (†‡) appear here at their ≤24-agent window for comparability — the full 2–48 sweeps are on their own pages.
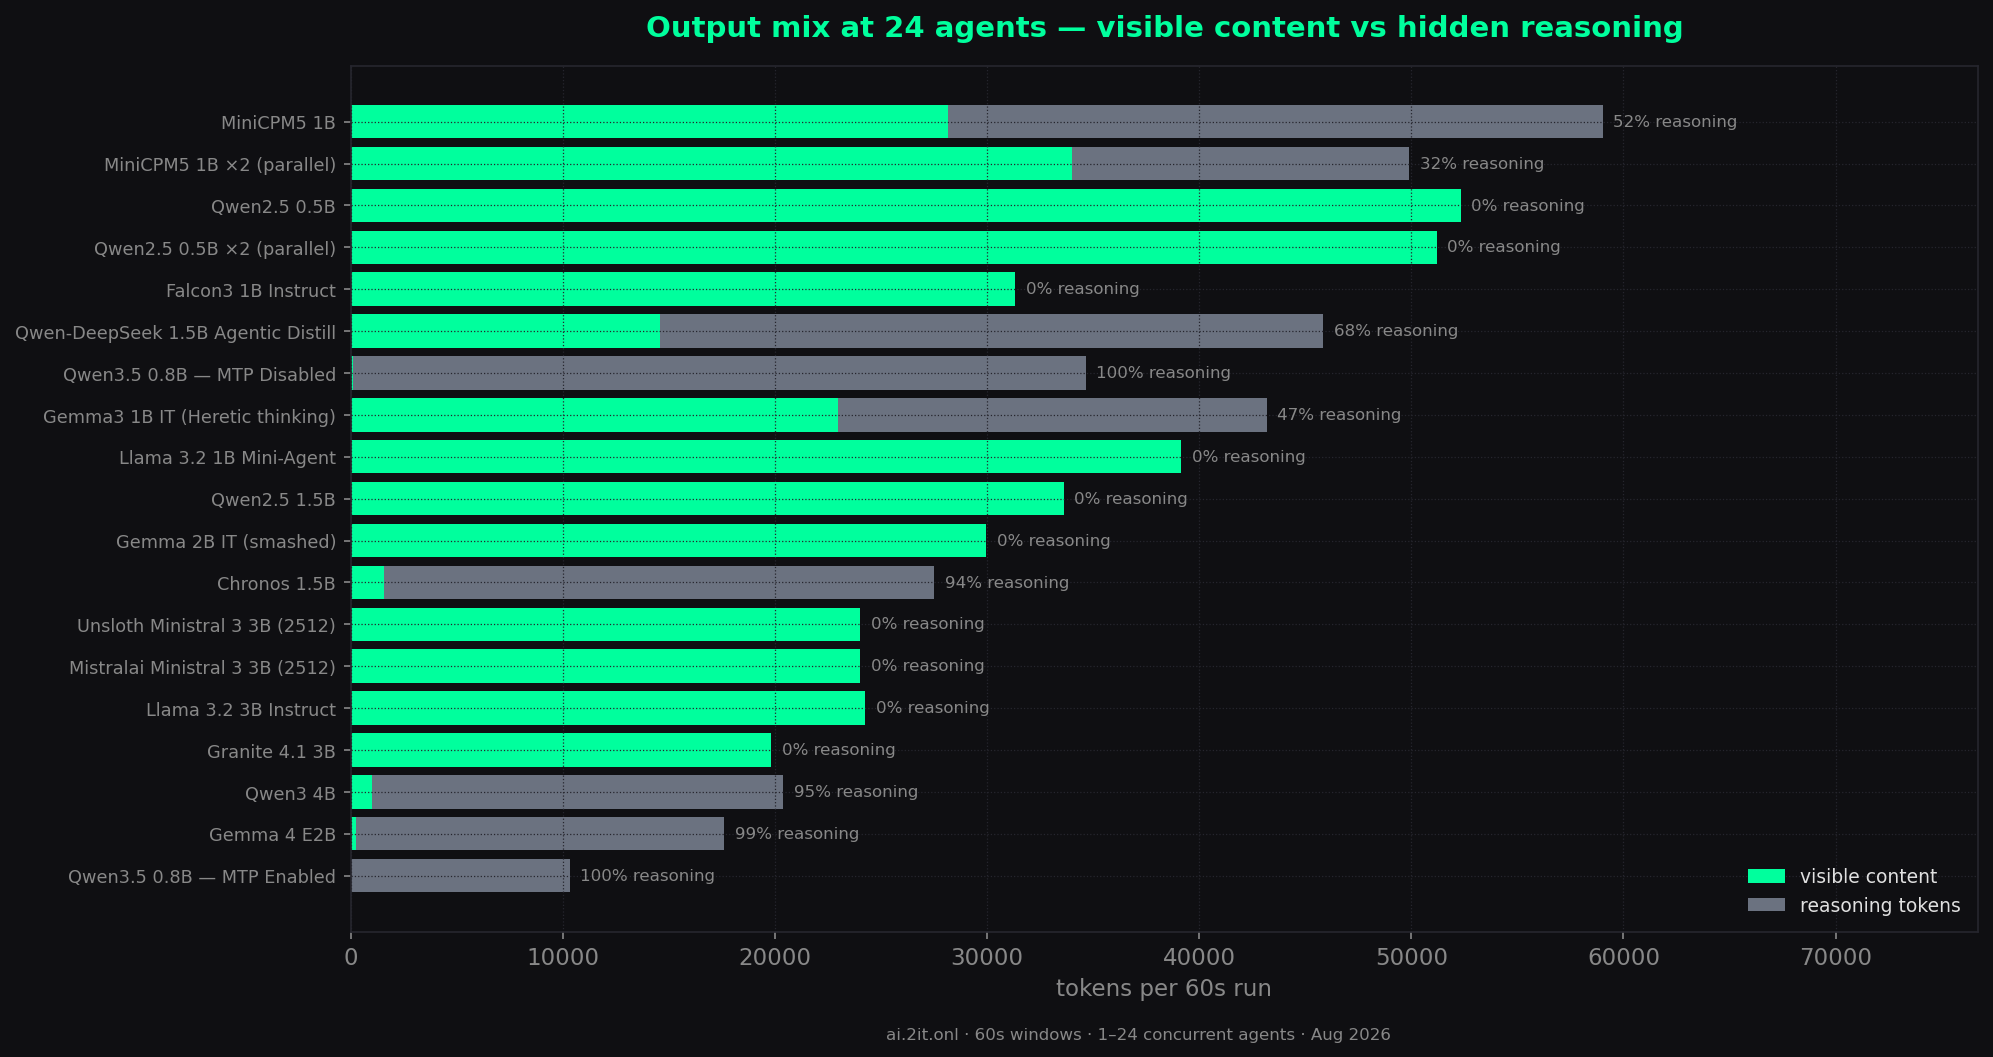
reasoning_content.
MTP-enabled Qwen3.5 emits 100% reasoning — nothing visible ever arrives. Gemma 4 E2B (~99%),
Qwen3 4B (~95%) and Chronos (94%) barely show any content under load either.
A “983 tok/s” headline is half story when 50% of it never reaches the agent.
Models — individually
Every model gets its own page: the complete 24-row table, key findings, all 8–9 charts, and raw CSV/JSON downloads.
MiniCPM5 1B
All-in throughput king (983 tok/s) but half its output is hidden reasoning and TTFT climbs to 52s.
MiniCPM5 1B ×2 (parallel)
The thinking champion doubled: two parallel LM Studio instances — 843 tok/s inside the 24-agent window, up to 1,698 tok/s at 48 total agents (6.4x).
Qwen2.5 0.5B
The throughput monster — fastest solo of all (354 tok/s) and fastest visible-content rate on record (944 tok/s at 20 agents) on full-precision F16 KV.
Qwen2.5 0.5B ×2 (parallel)
The same 0.5B model with two parallel LM Studio instances sharing the GPU: 1020 tok/s inside the 24-agent window, up to 1815 tok/s at 38 total agents (5.1x).
Falcon3 1B Instruct
Fastest pure-content scorer — 839 tok/s at 13 agents, then rolls off as the 8k context saturates.
Qwen-DeepSeek 1.5B Agentic Distill
Best scaling efficiency (5.0x) but the worst TTFT profile — 20–58s to first token under load.
Qwen3.5 0.8B — MTP Disabled
The MTP experiment: with multi-token prediction off, throughput scales 3.3x instead of flatlining at ~180 tok/s.
Gemma3 1B IT (Heretic thinking)
Friendliest thinking profile — 86ms solo TTFT, 719 tok/s all-in, and it just thinks harder under load.
Llama 3.2 1B Mini-Agent
The first agentic-tuned model tested — clean 196 tok/s solo, plateau of ~600–650 tok/s from 13 agents on.
Qwen2.5 1.5B
Best latency at low concurrency (108ms TTFT) and 3.3x scaling — but an erratic mid-range TTFT curve.
Gemma 2B IT (smashed)
Middle of the pack and steady — 538 tok/s peak, and the best latency of the smaller models (61ms–2.4s).
Chronos 1.5B
Slowest solo (88 tok/s) but scales 5.2x — 94% of its output at high concurrency is hidden reasoning.
Unsloth Ministral 3 3B (2512)
Slowest solo of any model tested (47 tok/s on Q4_0 KV) but the highest relative scaling on record — 8.7x to 410 tok/s at 23 agents.
Mistralai Ministral 3 3B (2512)
The official build vs the unsloth sibling at the same Q4_0 KV: 71 tok/s solo, smooth monotonic scaling to 404 tok/s at 22 agents — faster at every concurrency below the top end.
Llama 3.2 3B Instruct
The 3B anchor — only 95 tok/s solo, but the smoothest, most predictable scaling curve in the sweep (4.25x).
Granite 4.1 3B
Slowest solo of all (79 tok/s) and the noisiest scaling curve, but TTFT is the real weak point — 20–24s at 20+ agents.
Qwen3 4B
The worst latency profile of any model tested — 11.8s TTFT solo, 40–56s under load — and ~95% of its output is hidden reasoning at high concurrency. Peak: 340 tok/s.
Gemma 4 E2B
Near the bottom of the field — 72 tok/s solo, 293 tok/s peak, ~99% of output hidden reasoning under load, and the second-worst TTFT after Qwen3 4B (11.8s solo, up to 59.8s).
Qwen3.5 0.8B — MTP Enabled
The cautionary tale: MTP serializes requests — flat ~180 tok/s at any concurrency and zero visible content from 10 agents up.
Key takeaways
- Concurrency pays, up to a wall. Every model except MTP-on Qwen3.5 scaled 2.7–8.7x — the one outlier at the low end being Qwen2.5 0.5B, which barely needs concurrency (527 tok/s at just 2 agents). Diminishing returns beyond ~13–16 agents for most; a few (MiniCPM5, Falcon3, Qwen2.5 0.5B) kept climbing to 20+.
- MTP serializes — it is not a throughput win for concurrency. The cleanest result of the whole sweep: same model, same box, MTP off = 3.3x scaling; MTP on = flatline. The decode path cannot batch.
- Thinking tokens are overhead, not content. At 24 agents, reasoning share ran 45–100%. If your agents need visible answers, count content-only throughput.
- TTFT is the agent-latency wall. Prefill-heavy thinking models push first-token latency to 20–60s under load — Qwen3 4B waits up to the full 60s window — unusable for interactive orchestration, fine for batch pipelines.
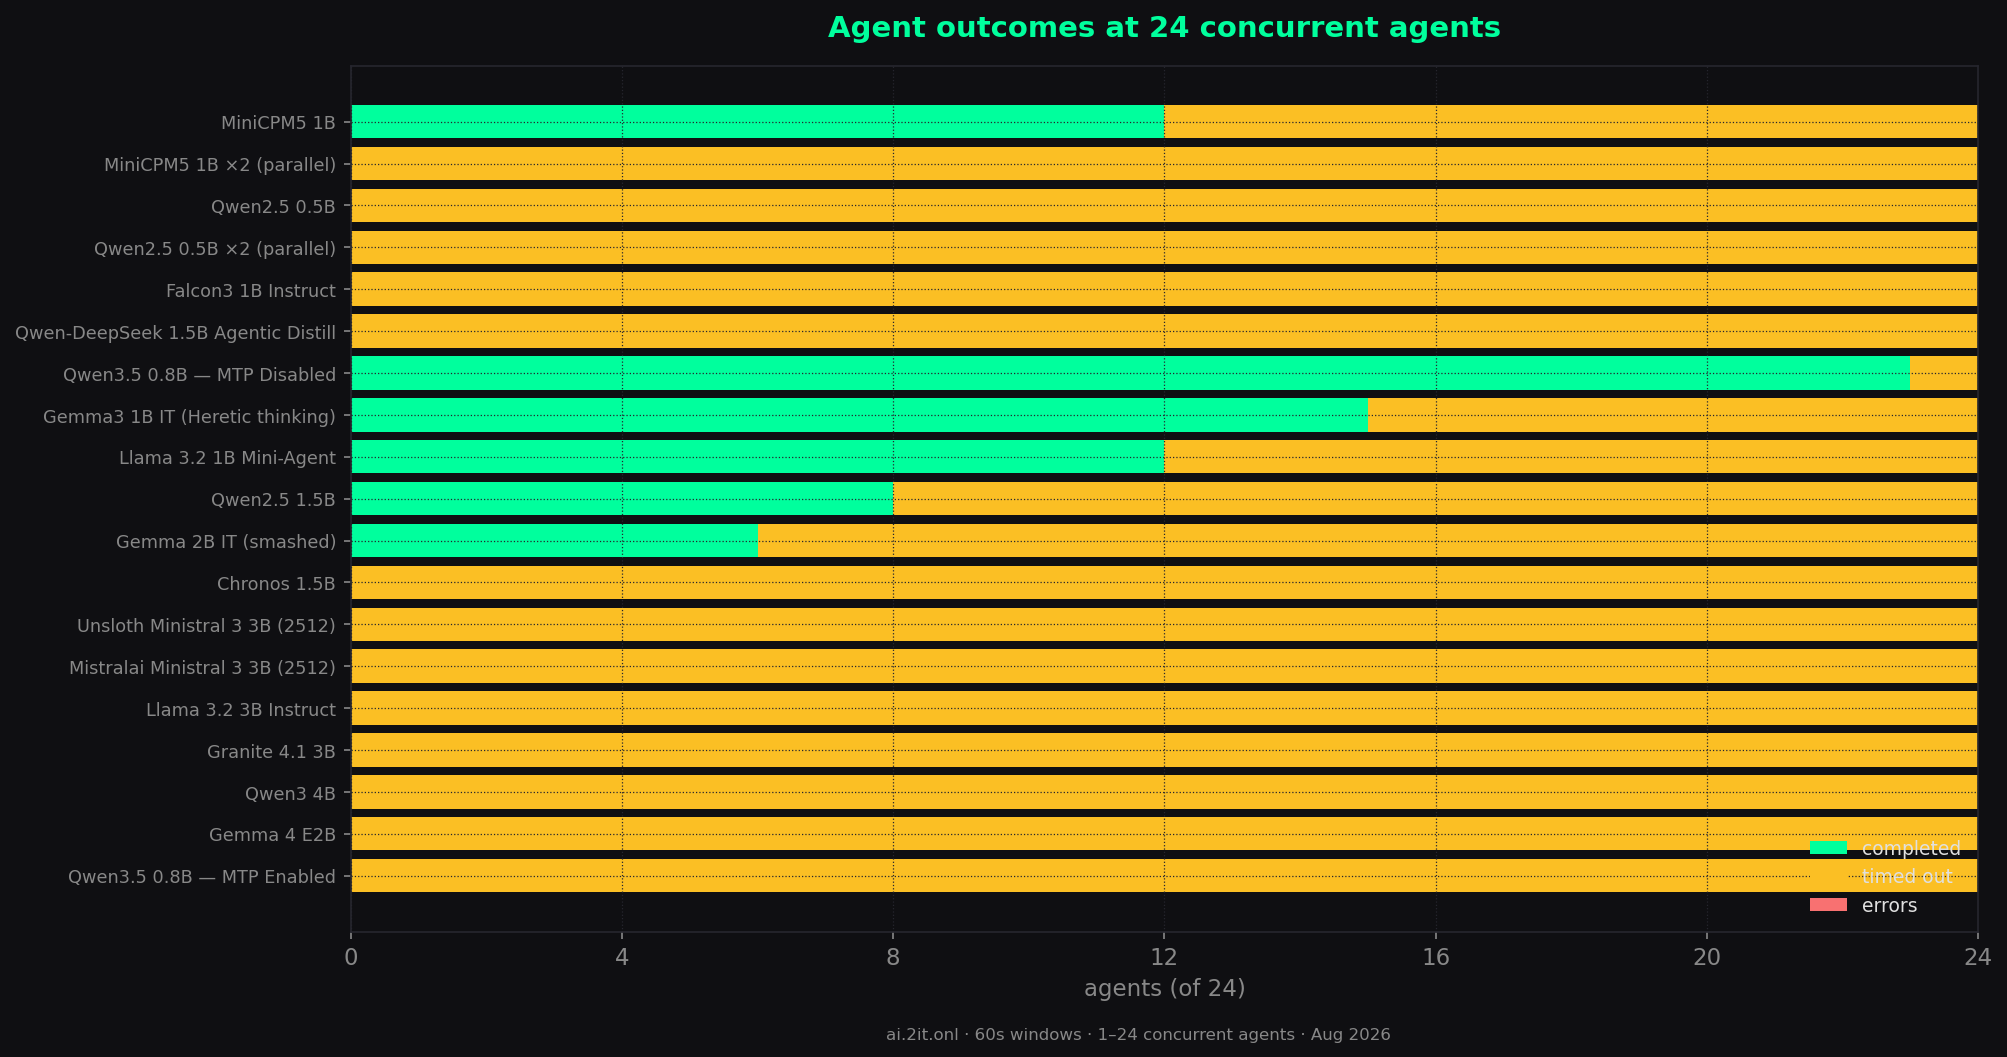
- Reliability is not the bottleneck. 288 runs, zero hard errors. Timeouts (budget exhaustion) are the only non-OK outcome.
- A 9950X3D + 32GB + 8GB VRAM can host the whole swarm. 24 concurrent 1B–3B agents ran with KV on GPU and no OOMs — this is genuinely consumer-hardware territory.
What’s next — bigger models & real-world use
This sweep is a living dataset — it’s not done yet. I plan to keep testing and adding models to the list as they land, so keep a lookout for new entries in the sidebar. Next up on the bench:
- Bigger models — climbing to roughly 9B parameters, about the max I can fit in 8GB of VRAM, to see how the concurrency curve changes as models outgrow the card.
- MoE models with offloaded experts — sparse models that push expert weights out to system RAM; the 9950X3D’s CCD0 affinity and 32GB of 1:1 DDR5 were built for exactly this. The question: does expert offloading serialize under load, or does MoE’s sparsity actually hold up better under concurrency than dense models?
And throughput only answers how fast a model can go — not how well it works. The strongest performers from this sweep also head onto real-world use datasets under the same harness and the same dirty rig:
- Agentic task mixes — multi-turn tool calling, structured JSON/action output, and code-editing loops, measuring parse success and instruction-following while 8–24 agents are in flight.
- Long-context drift — whether models stay coherent when agents hold full 32k contexts under compaction pressure, not just 60-second sprints.
- Quality vs token budget — the reasoning-share question made concrete: does the hidden thinking actually buy better task outcomes, or just slower answers?
- Latency budgets — which models stay inside interactive TTFT budgets at realistic concurrency, and which are batch-only.
Data & downloads
Every number above is reproducible: each model page links its sweep-summary.csv,
sweep-summary.json, the full report markdown, and the original white-background matplotlib
chart exports. The generation pipeline lives in build/ (dark-theme chart generator +
model page builder) and is re-runnable as the dataset grows.