Qwen2.5 0.5B ×2 (parallel)
server model id:
qwen2.5-0.5b-instruct / qwen2.5-0.5b-instruct-22× parallel instancesnon-thinkingKV F16ctx 32k0.5B params
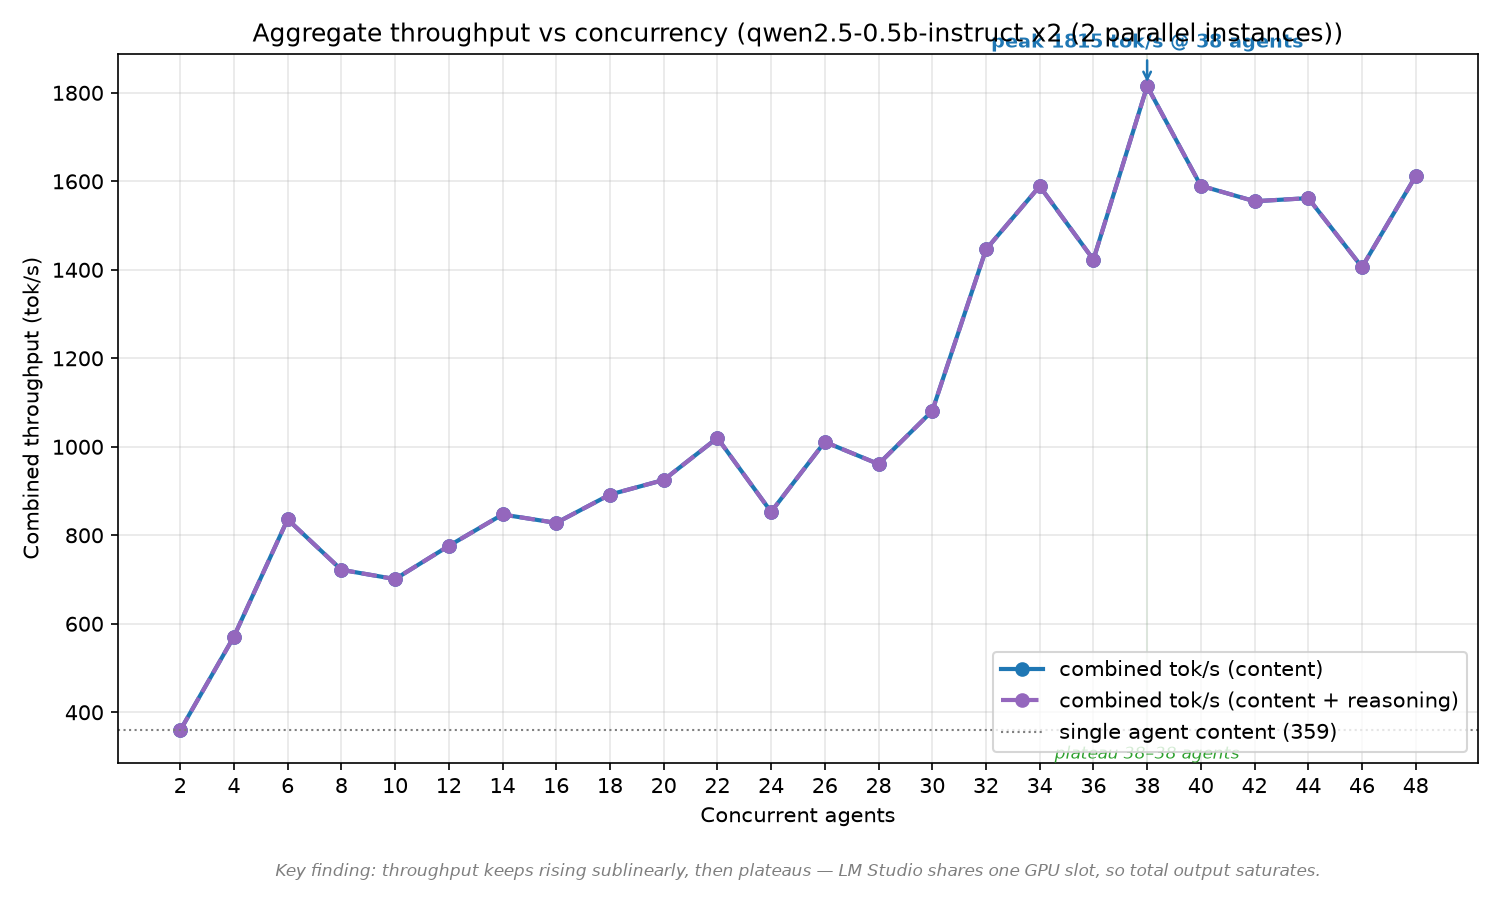
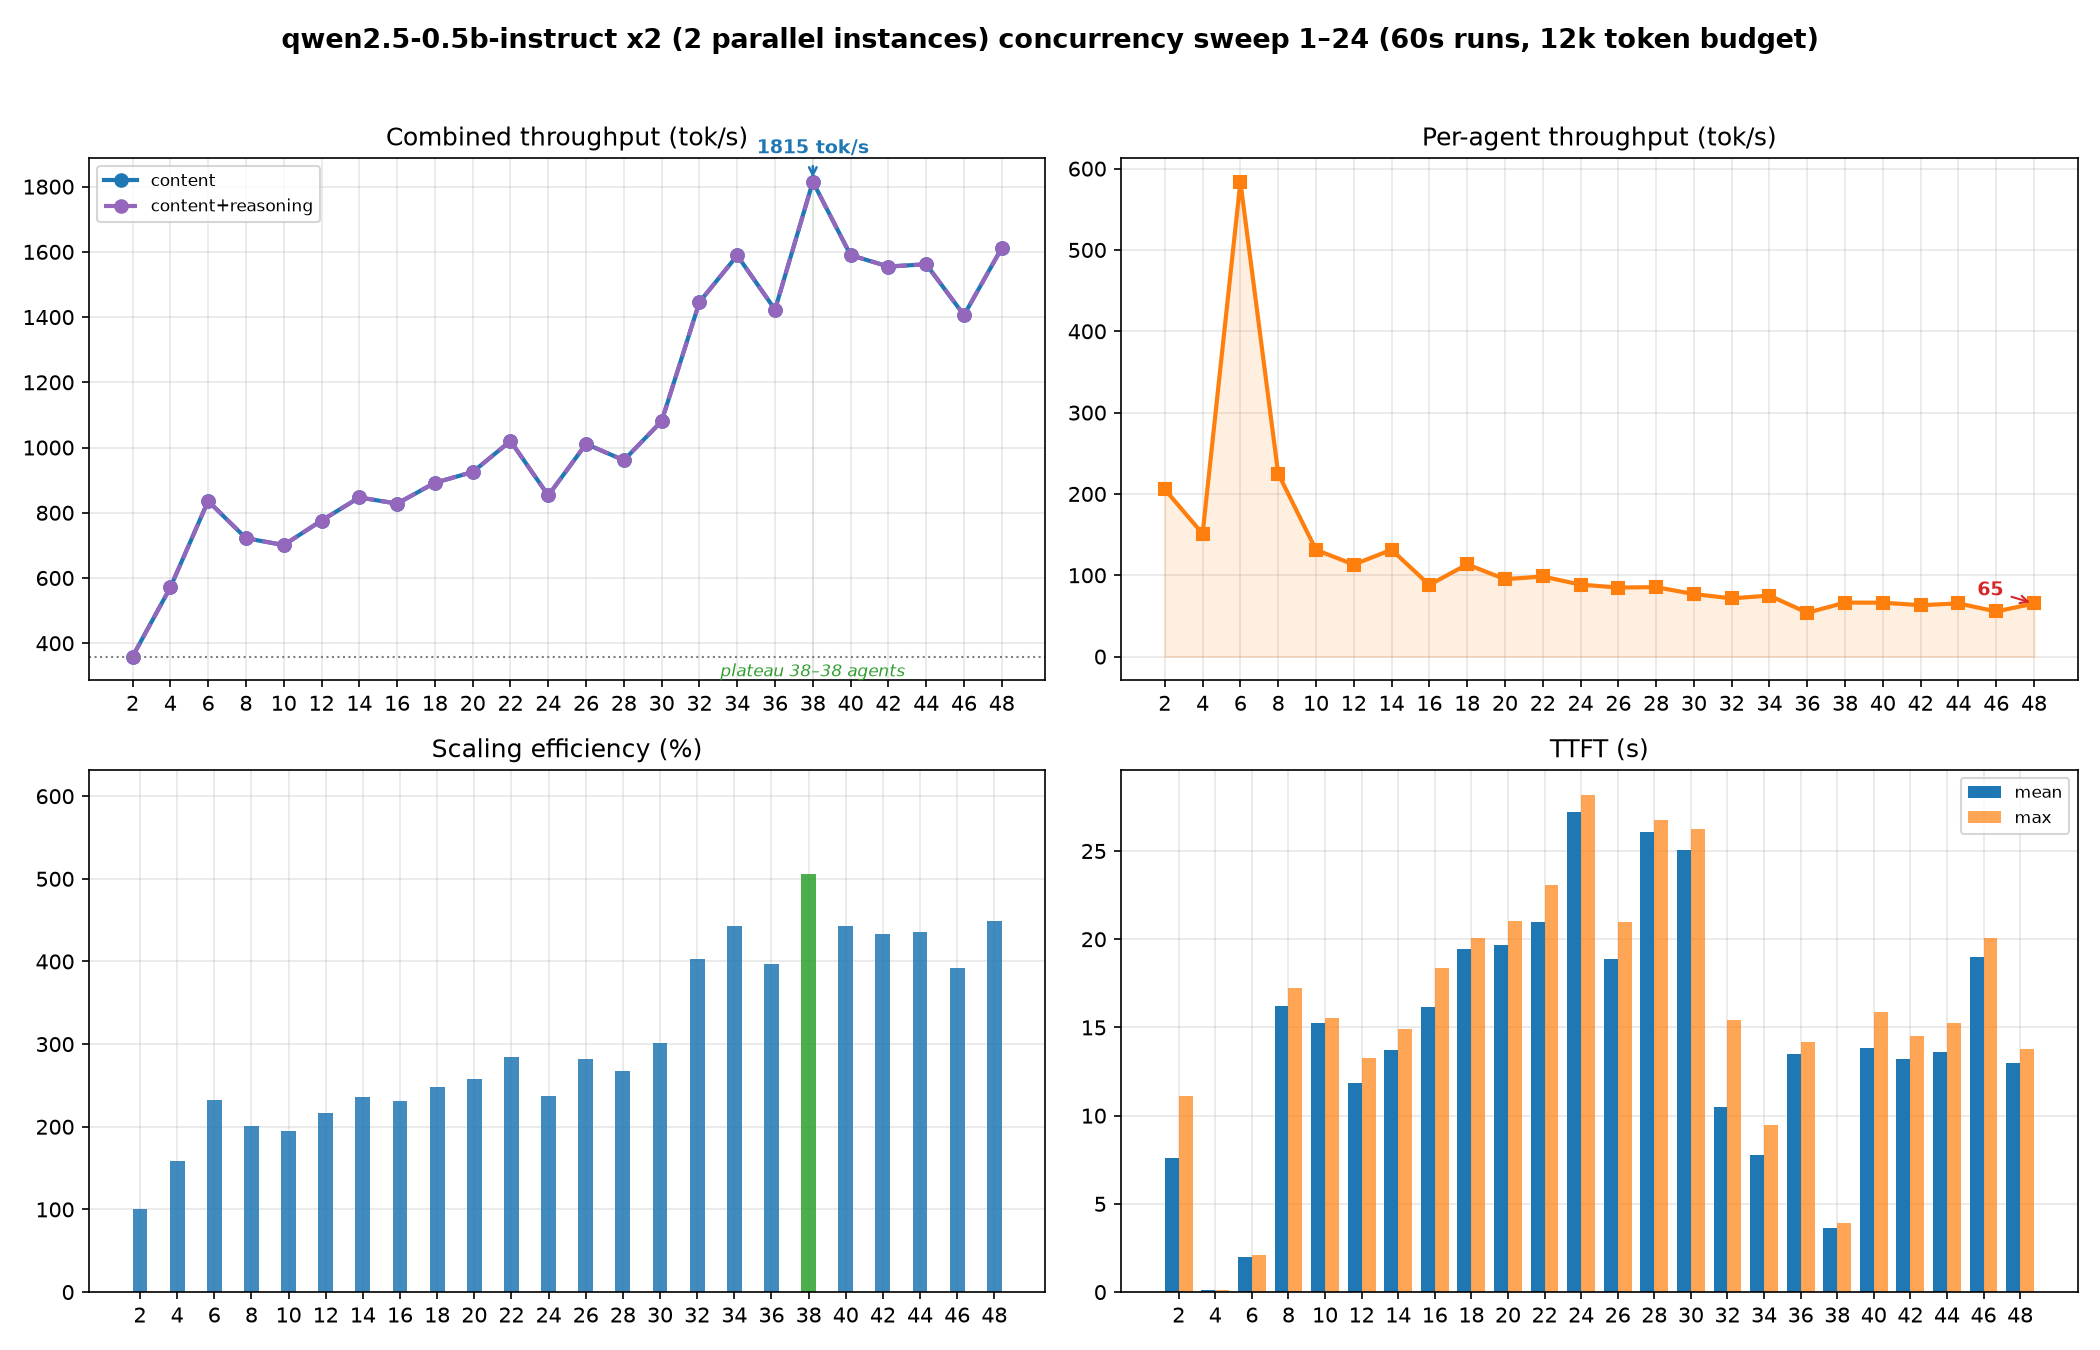
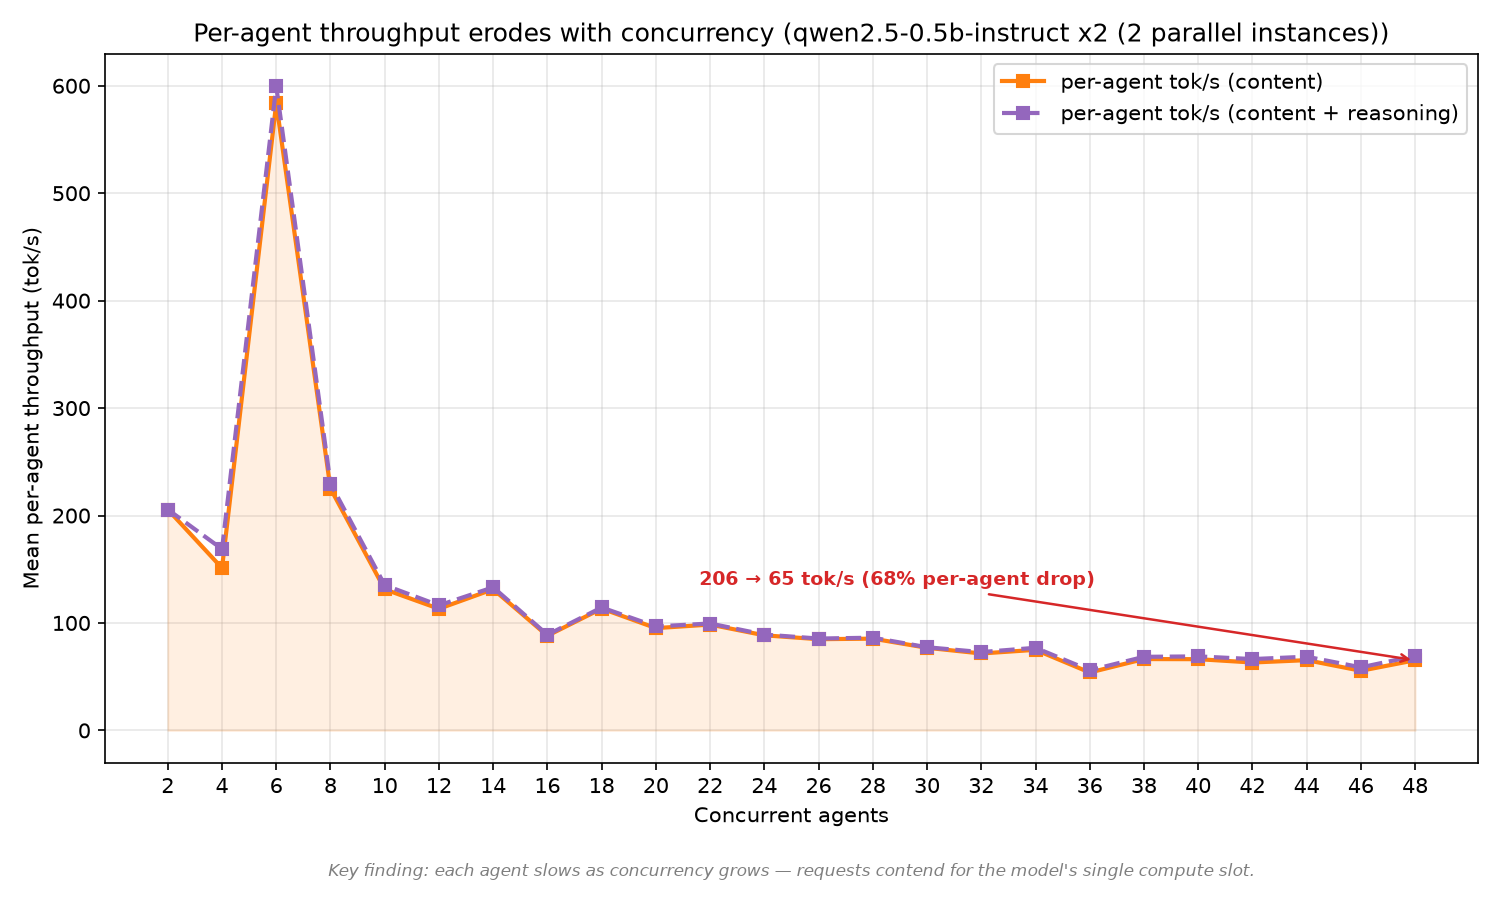
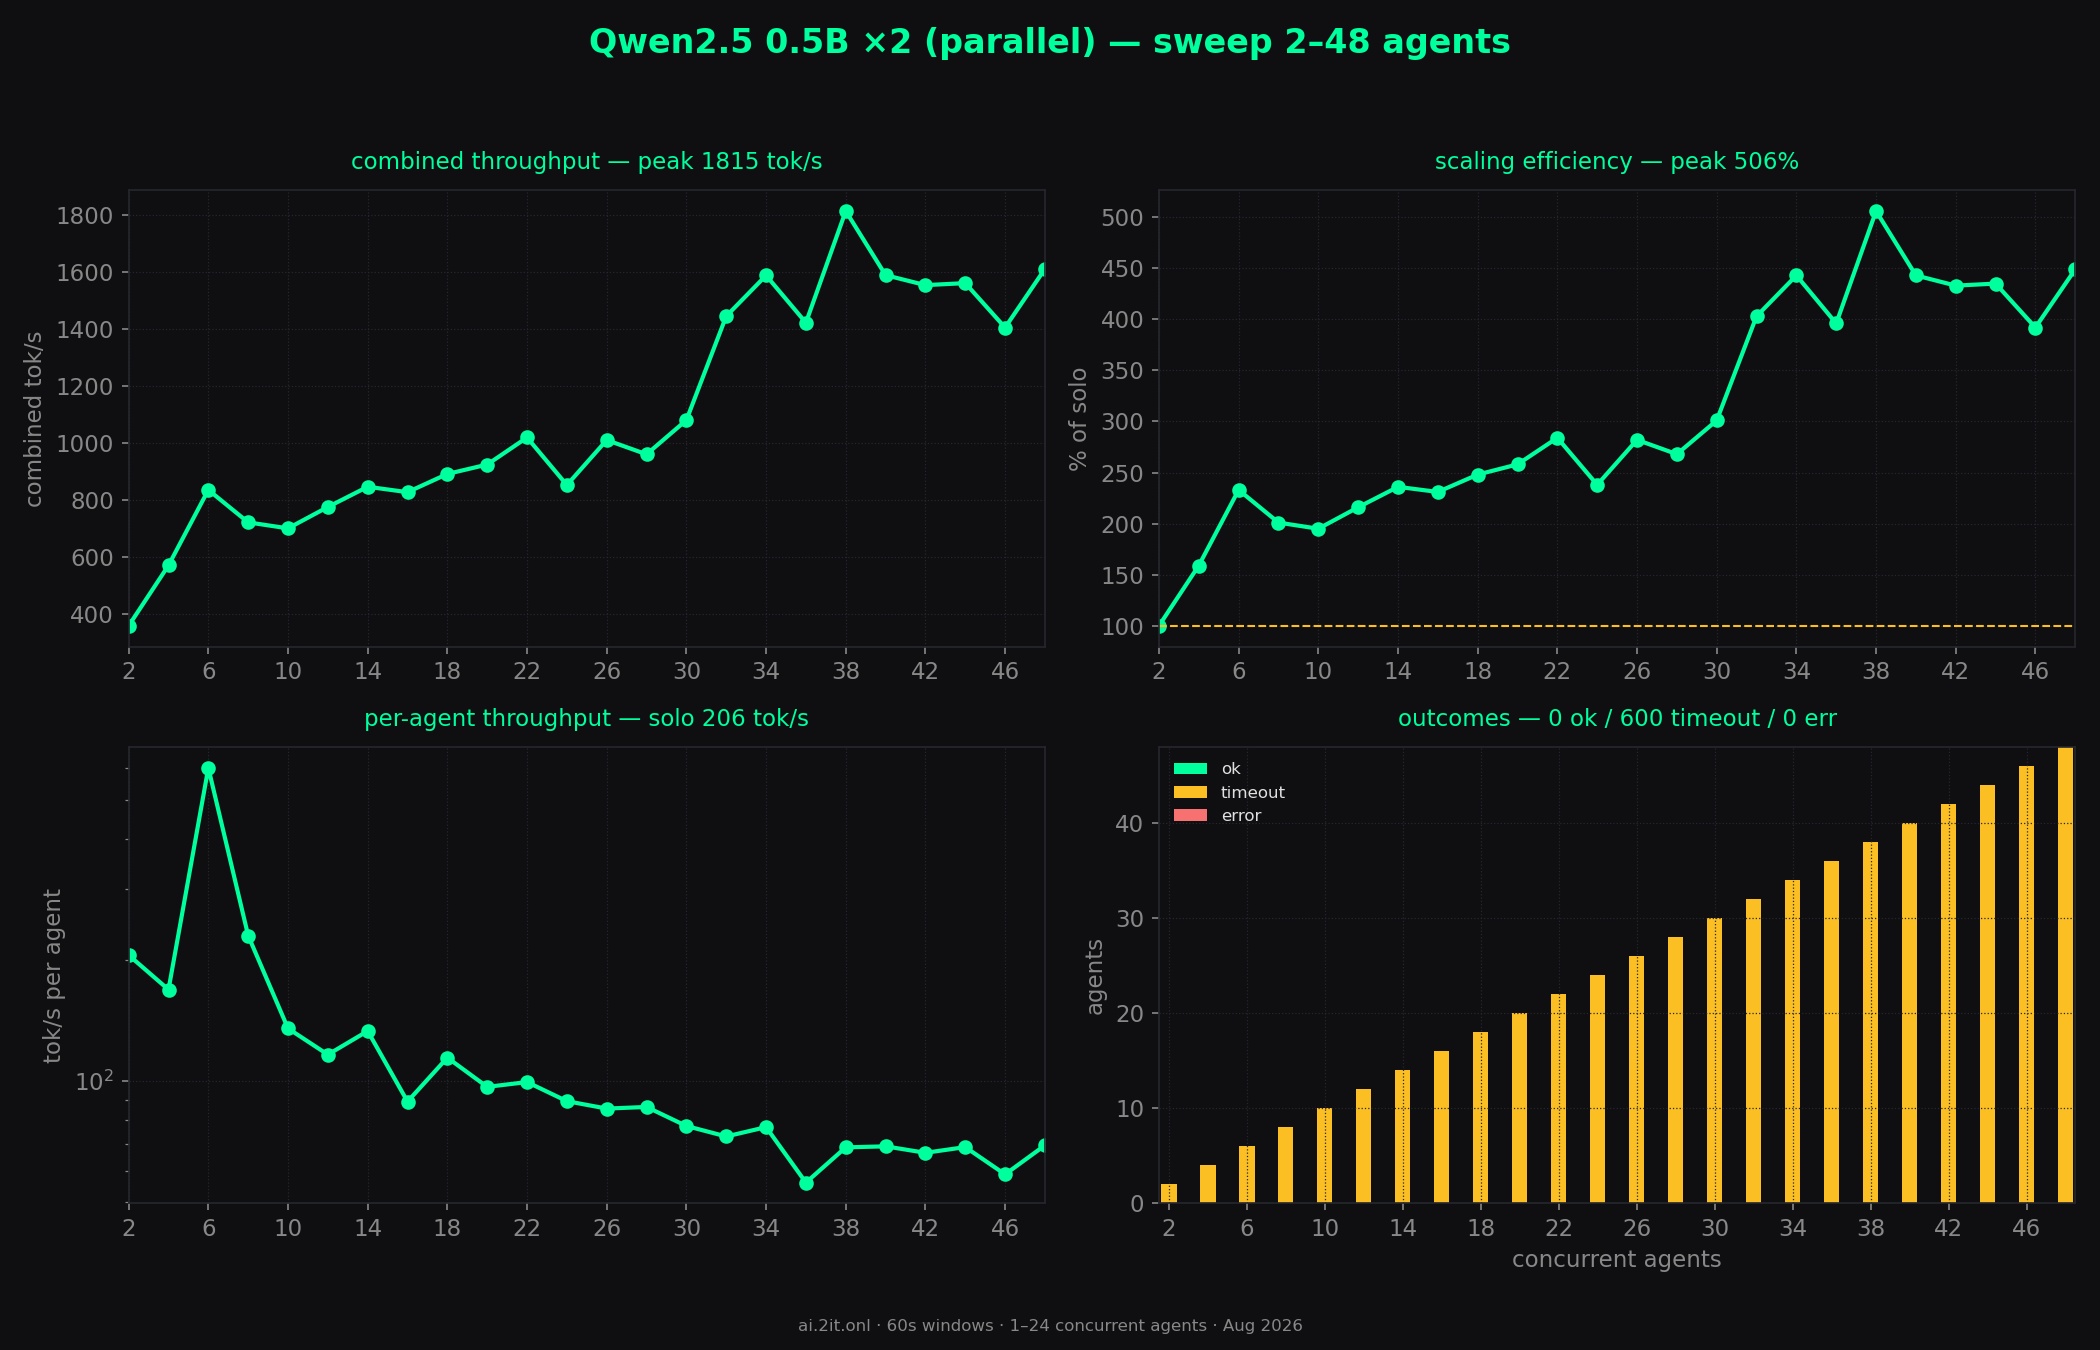
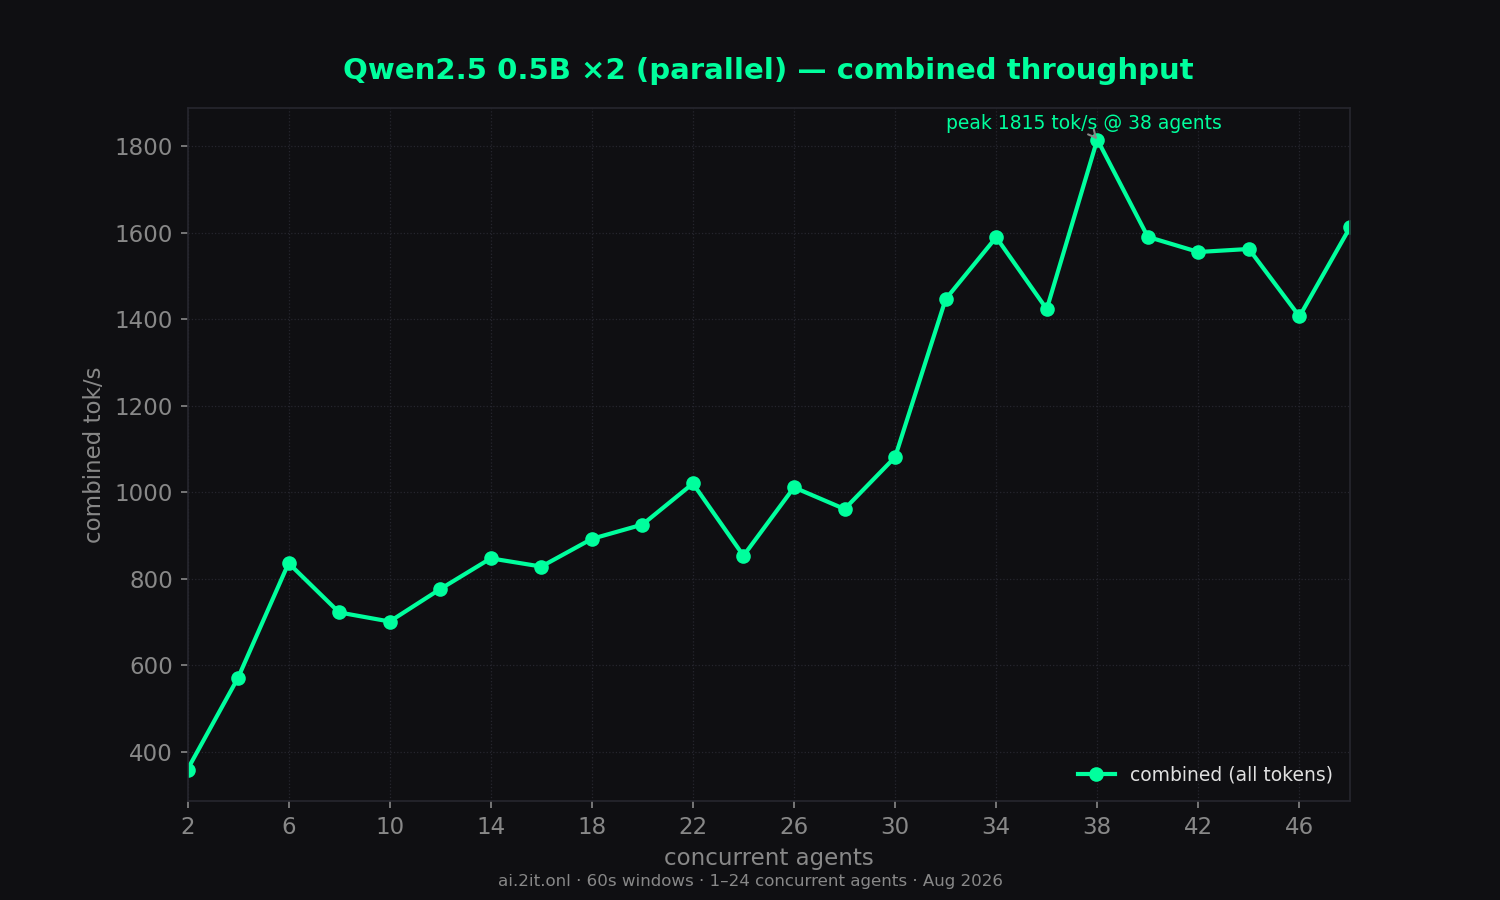
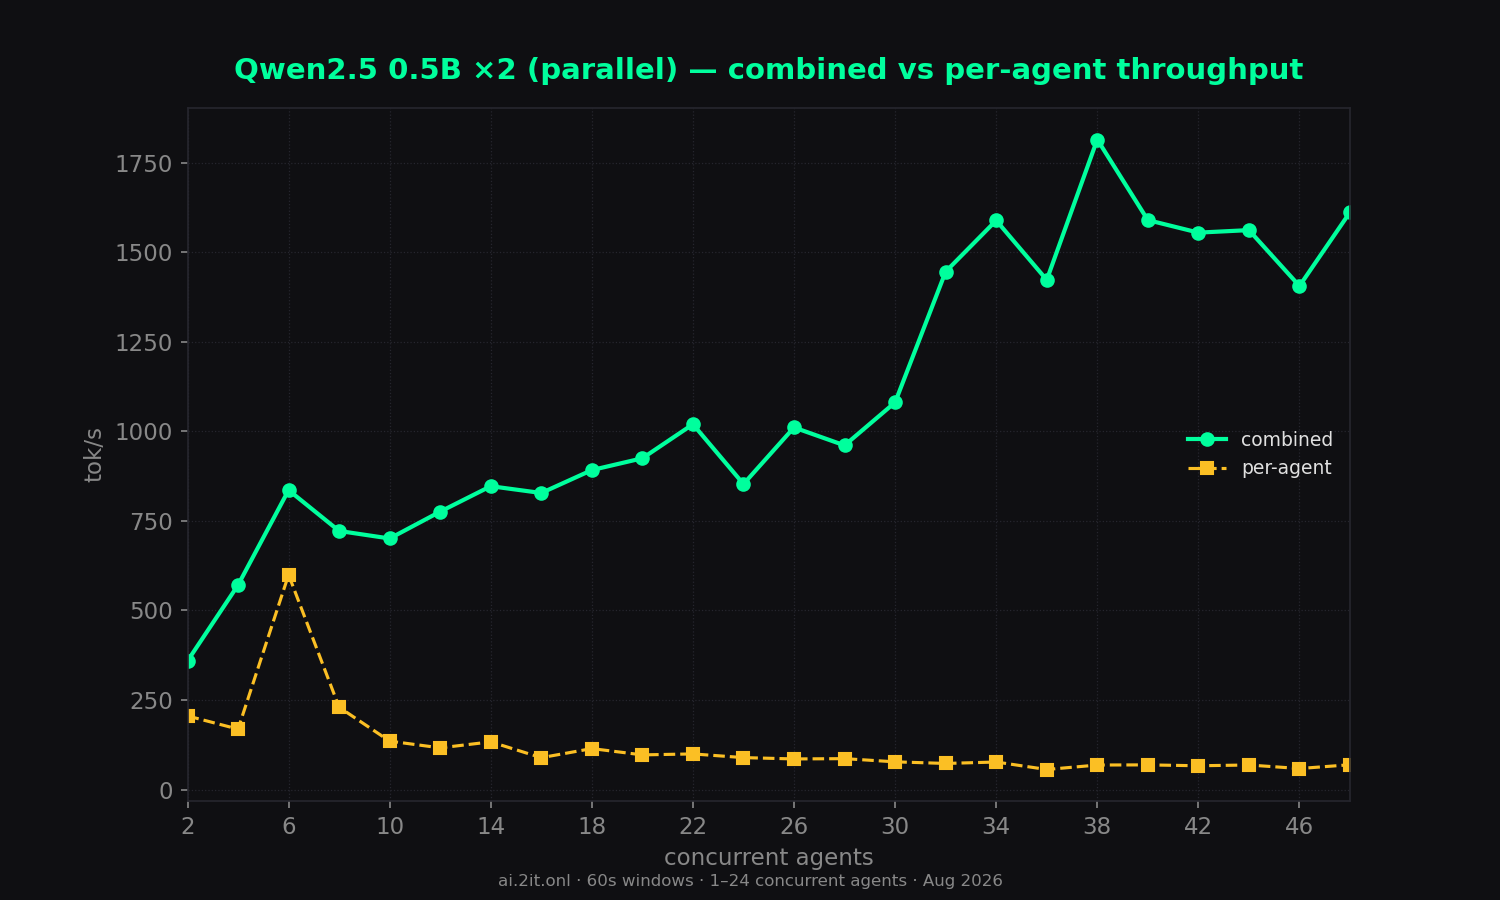
The same 0.5B model with two parallel LM Studio instances sharing the GPU: 1020 tok/s inside the 24-agent window, up to 1815 tok/s at 38 total agents (5.1x).
Key findings
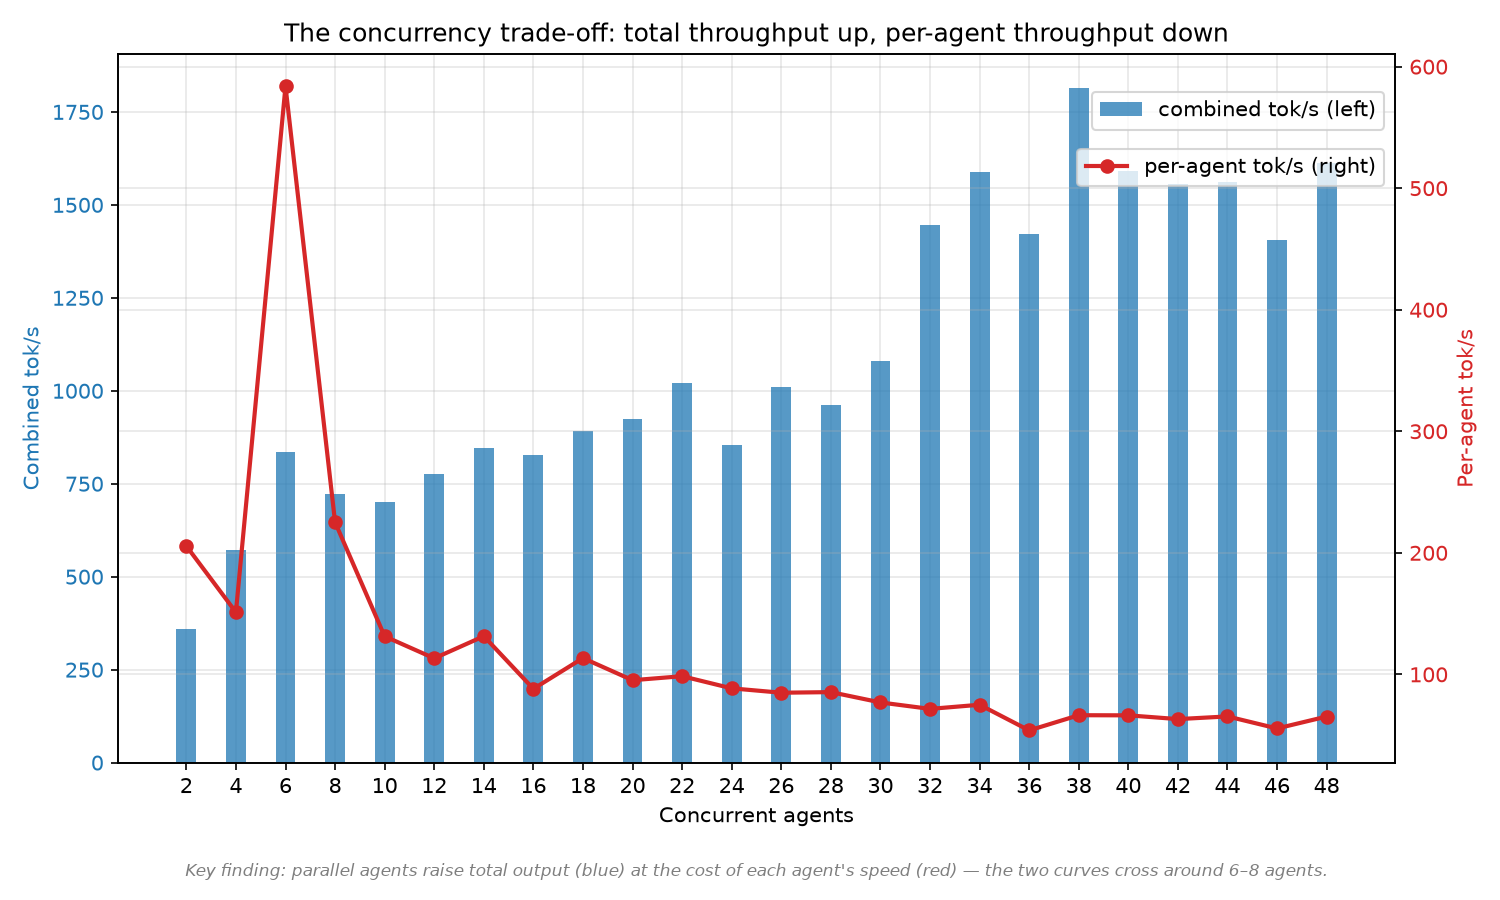
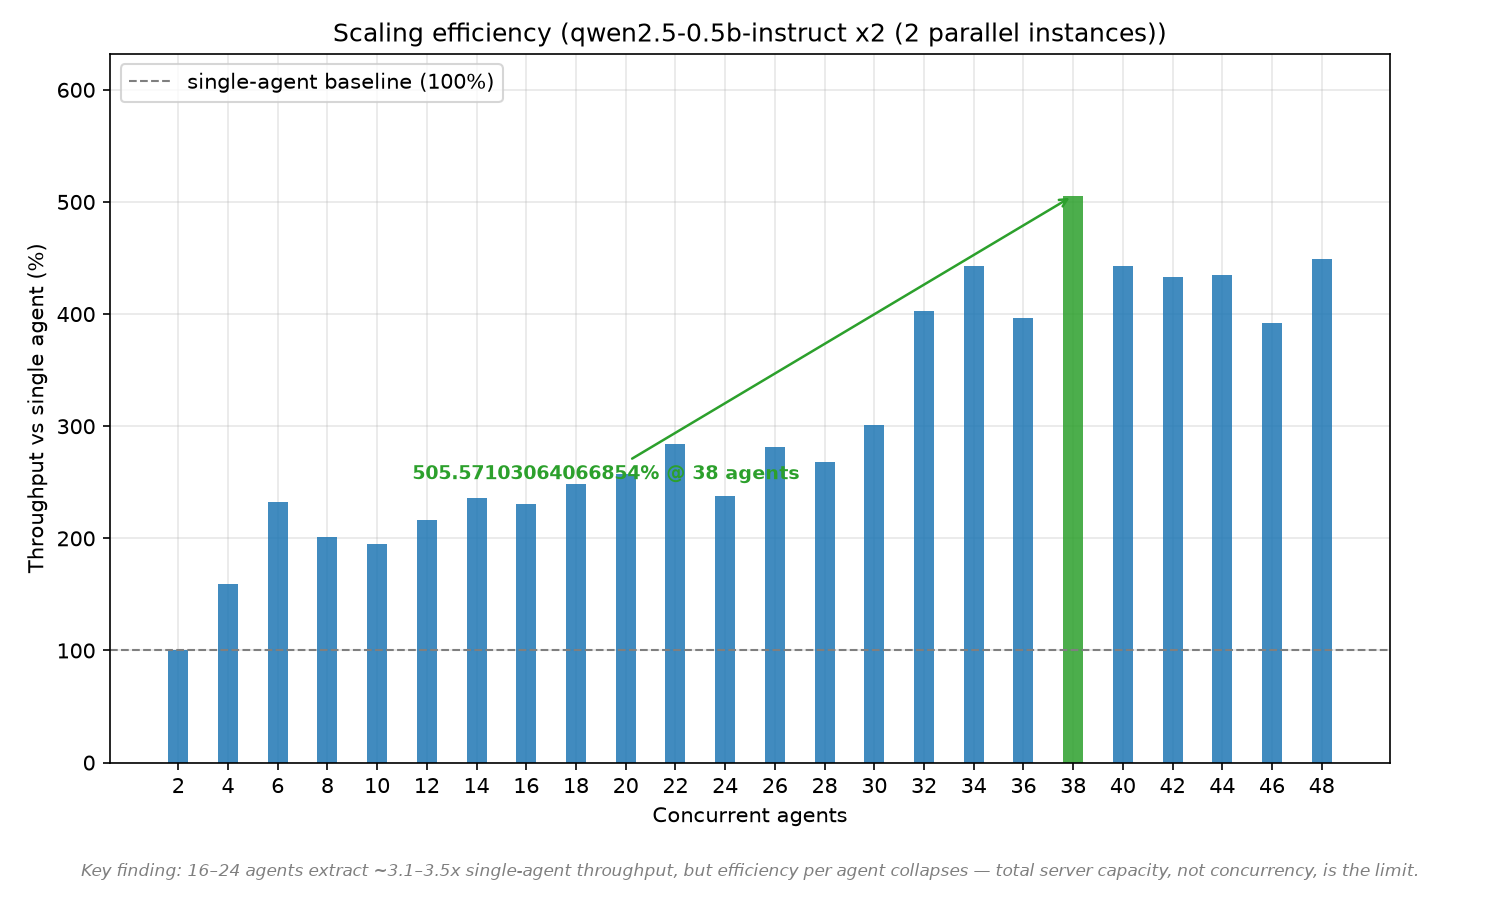
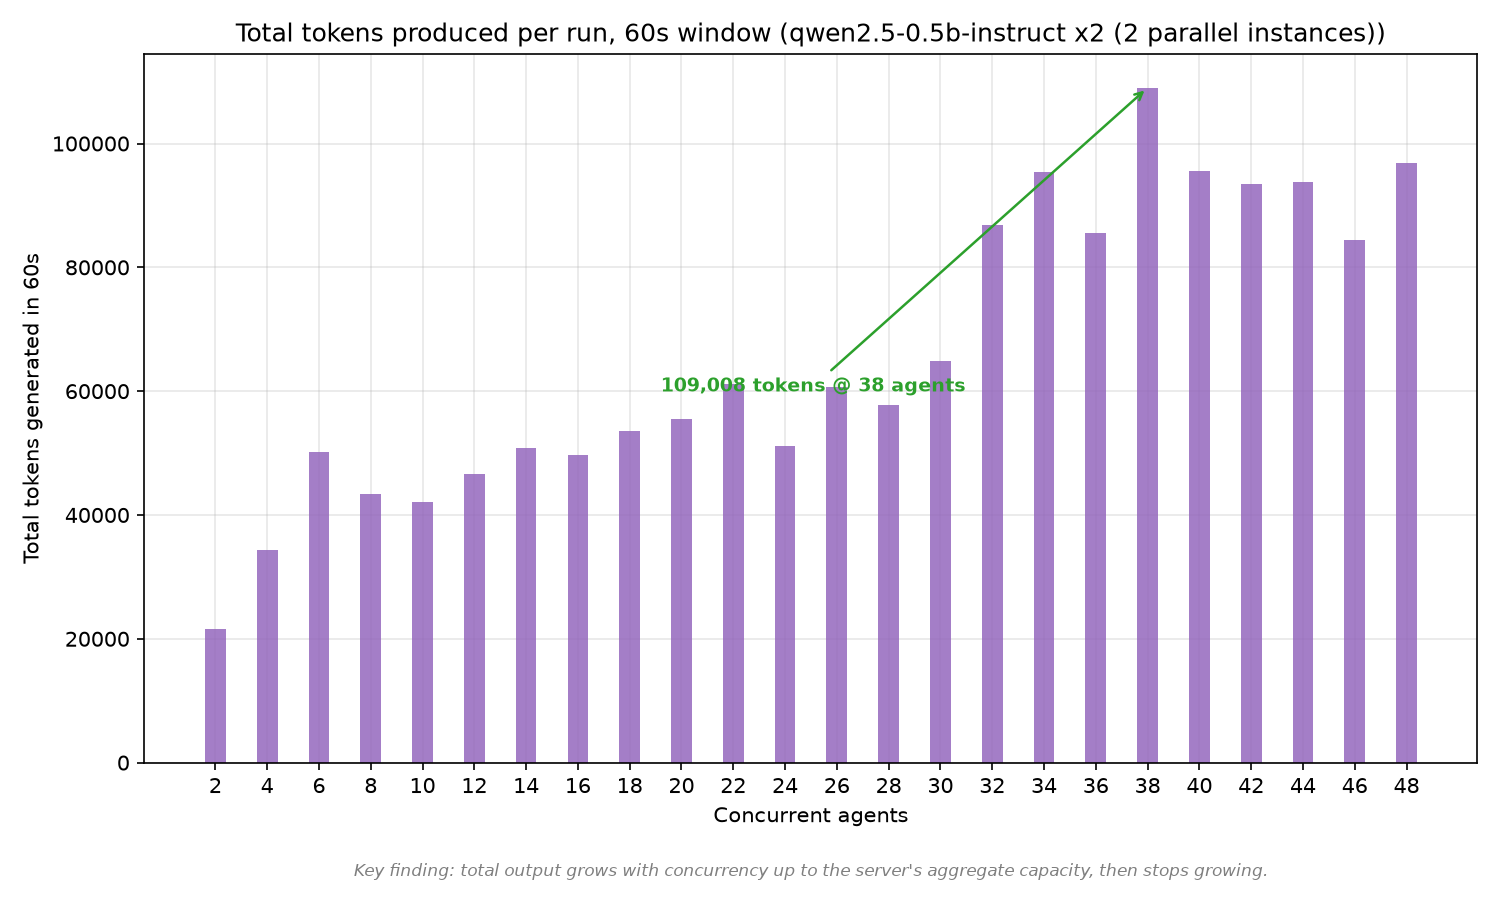
- Two instances roughly double throughput: combined output reaches 1815 tok/s at 38 total agents (5.1x the 2-agent baseline) and ~1400–1610 from 40–48 — roughly 2x the ~900–944 tok/s ceiling of the single-instance run. Running two API-handler slots in parallel works.
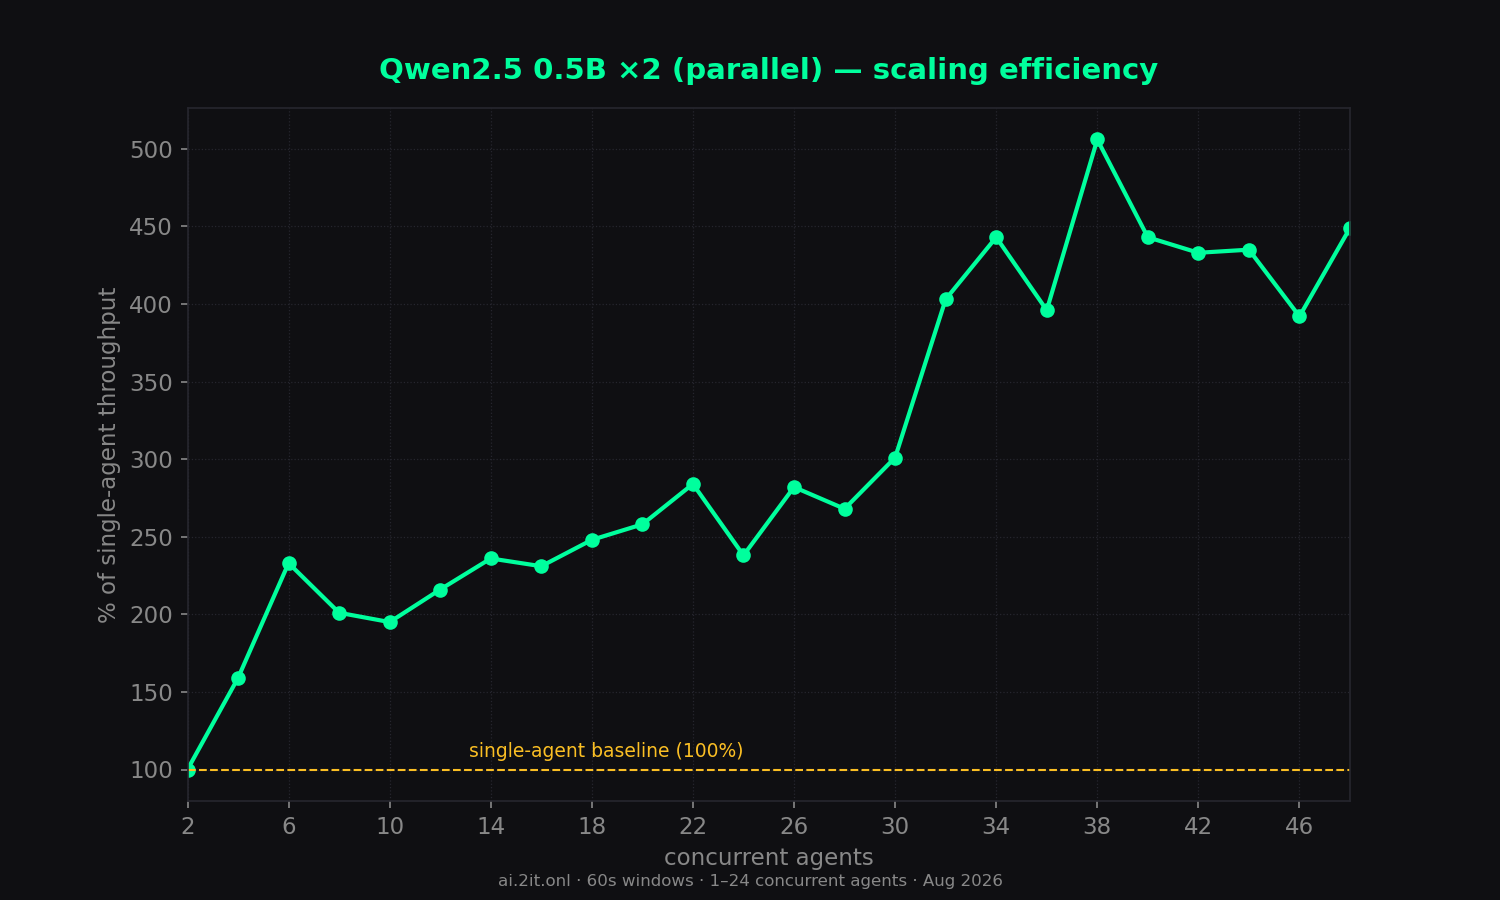
- Steeper scaling than single-instance: single-instance plateaued at ~267% (relative to its solo); the dual run keeps climbing to 506% at 38 — the extra slot gives real headroom.
- Solo-baseline caveat: the 2-agent row (1 per instance) is 359 tok/s, similar to the single-instance 354 — each slot independently sustains its solo speed, and combining them adds up.
- Noisy mid-range, then a jump at 30–34: throughput swings 701–1020 between 8–30, then jumps to ~1446–1815 at 32–38 — LM Studio's per-slot batching transitions.
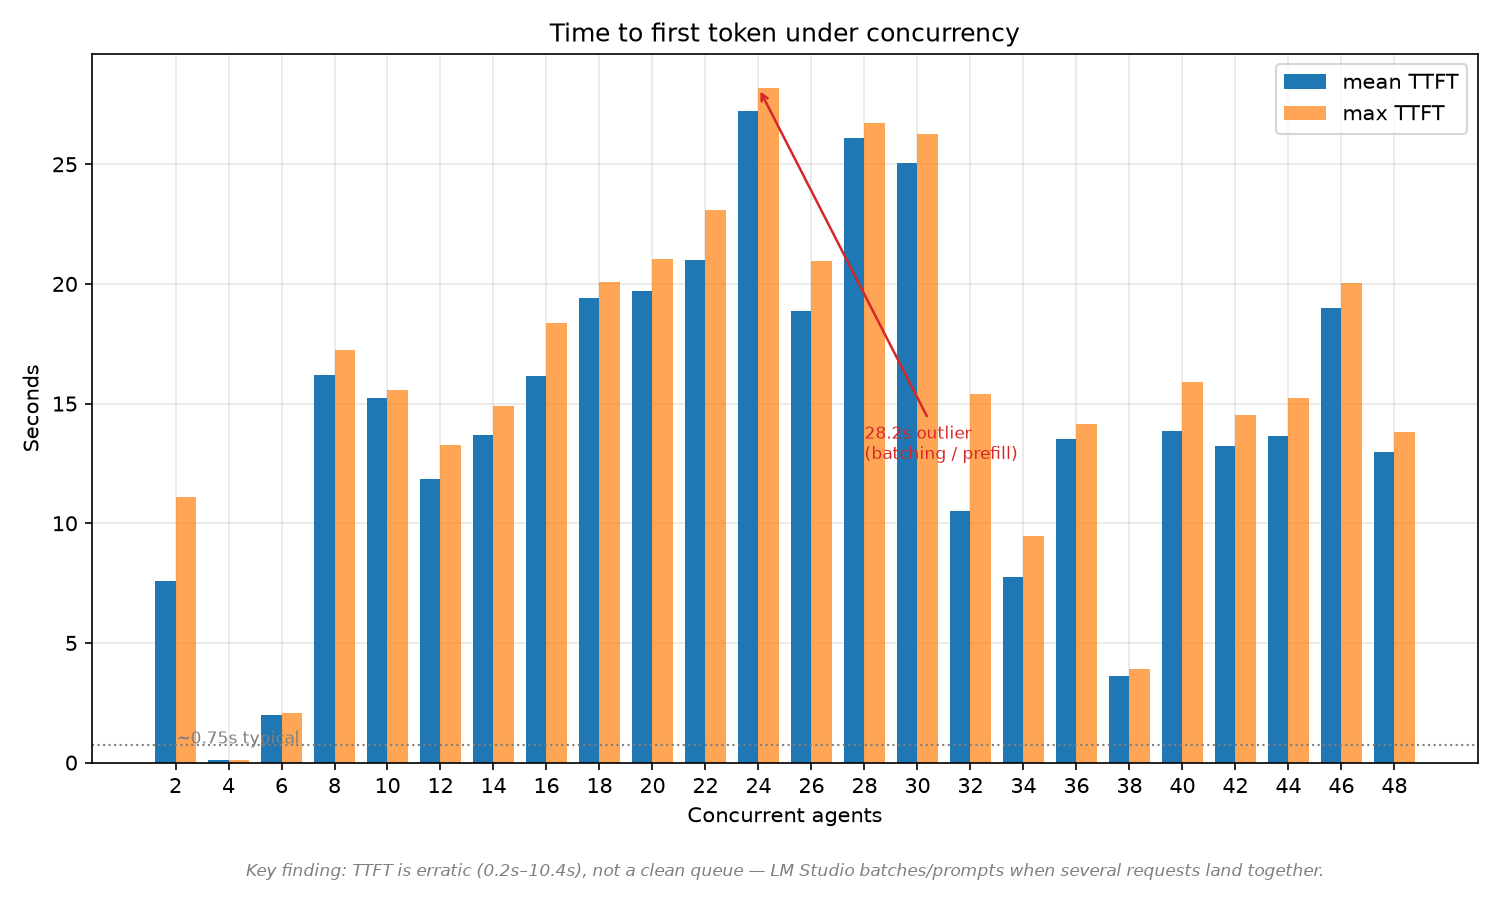
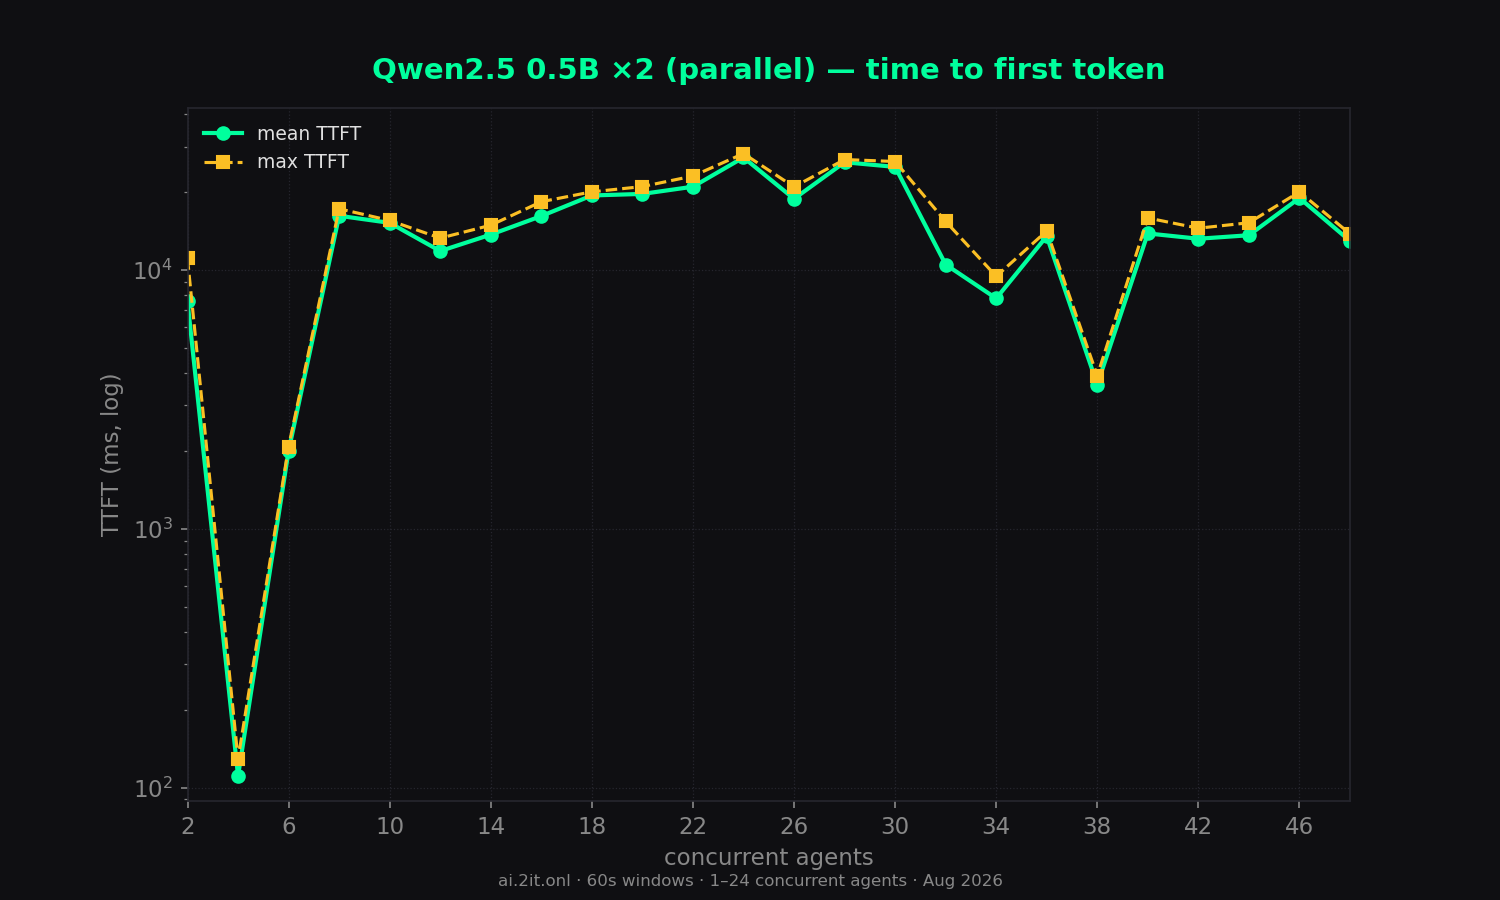
- TTFT: 111ms–27s, erratic like the single-instance run; no pathological outliers.
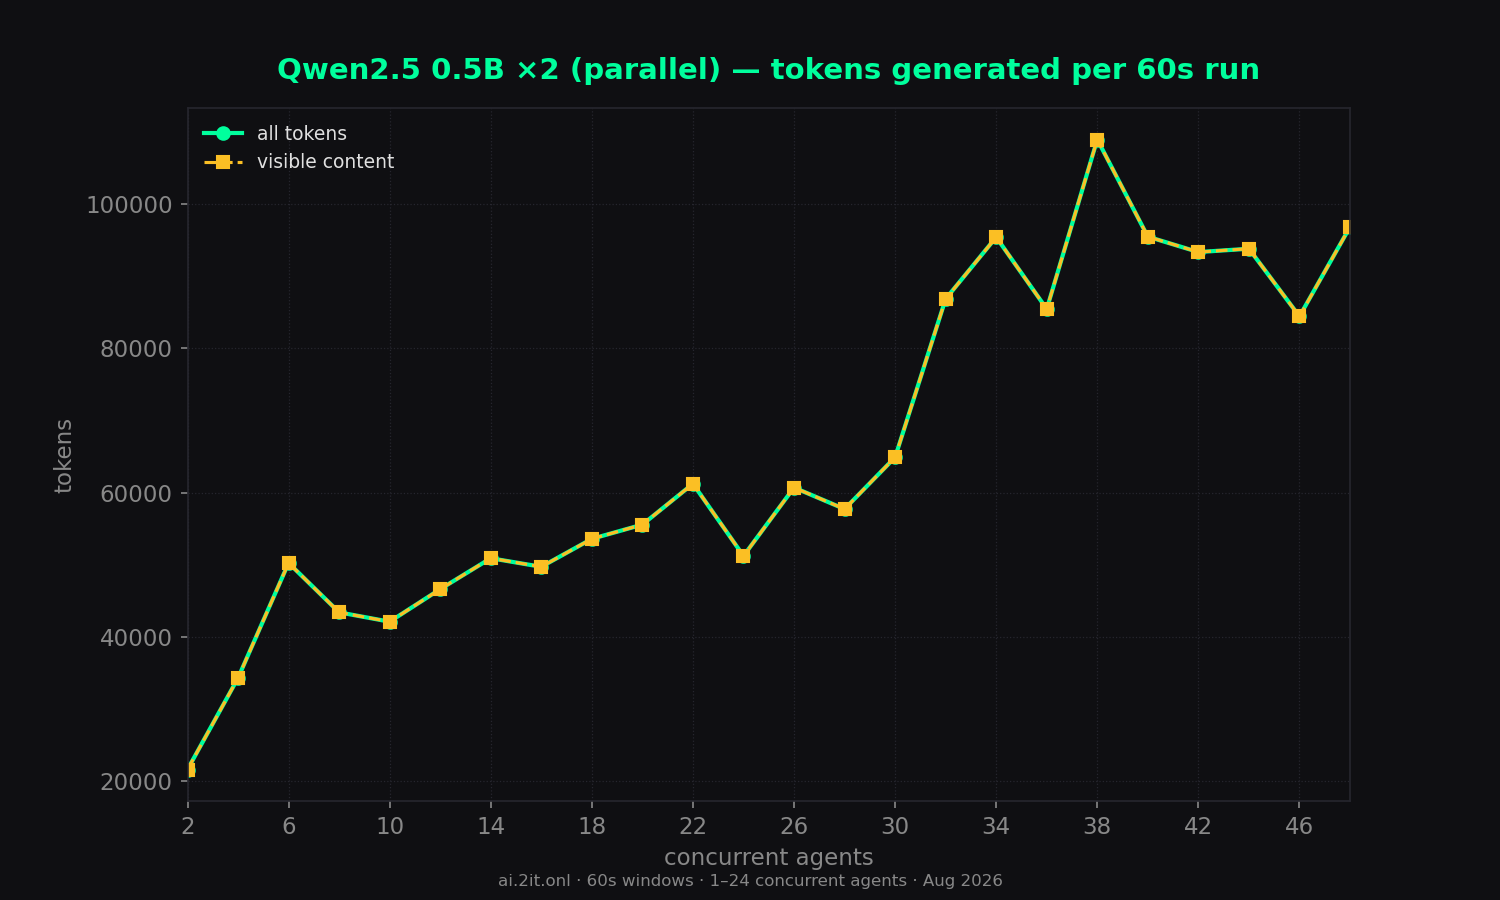
- All visible content, 0 reasoning tokens.
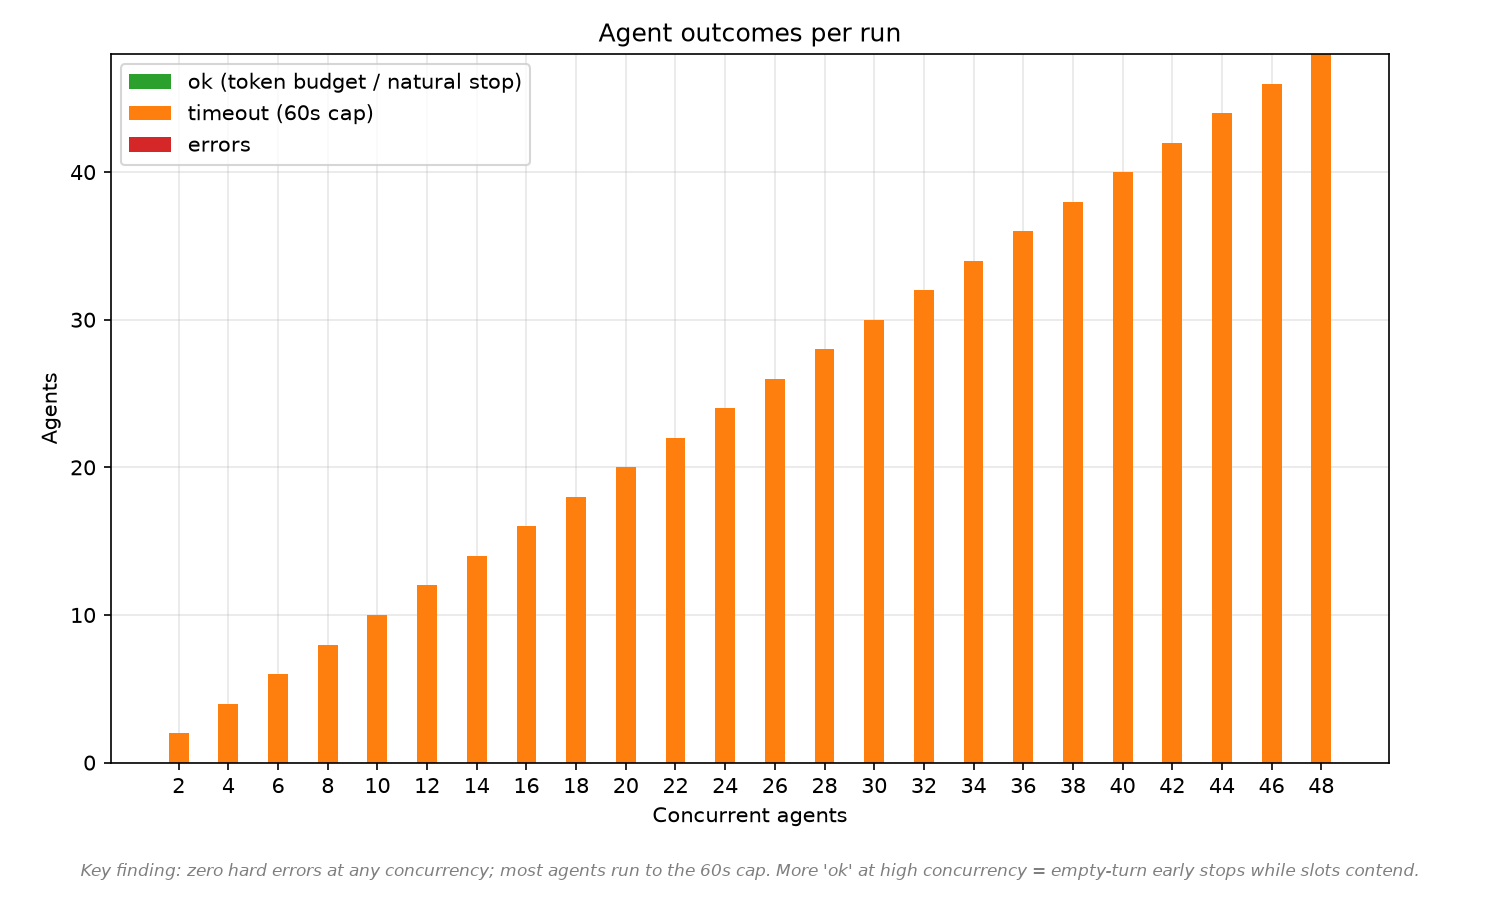
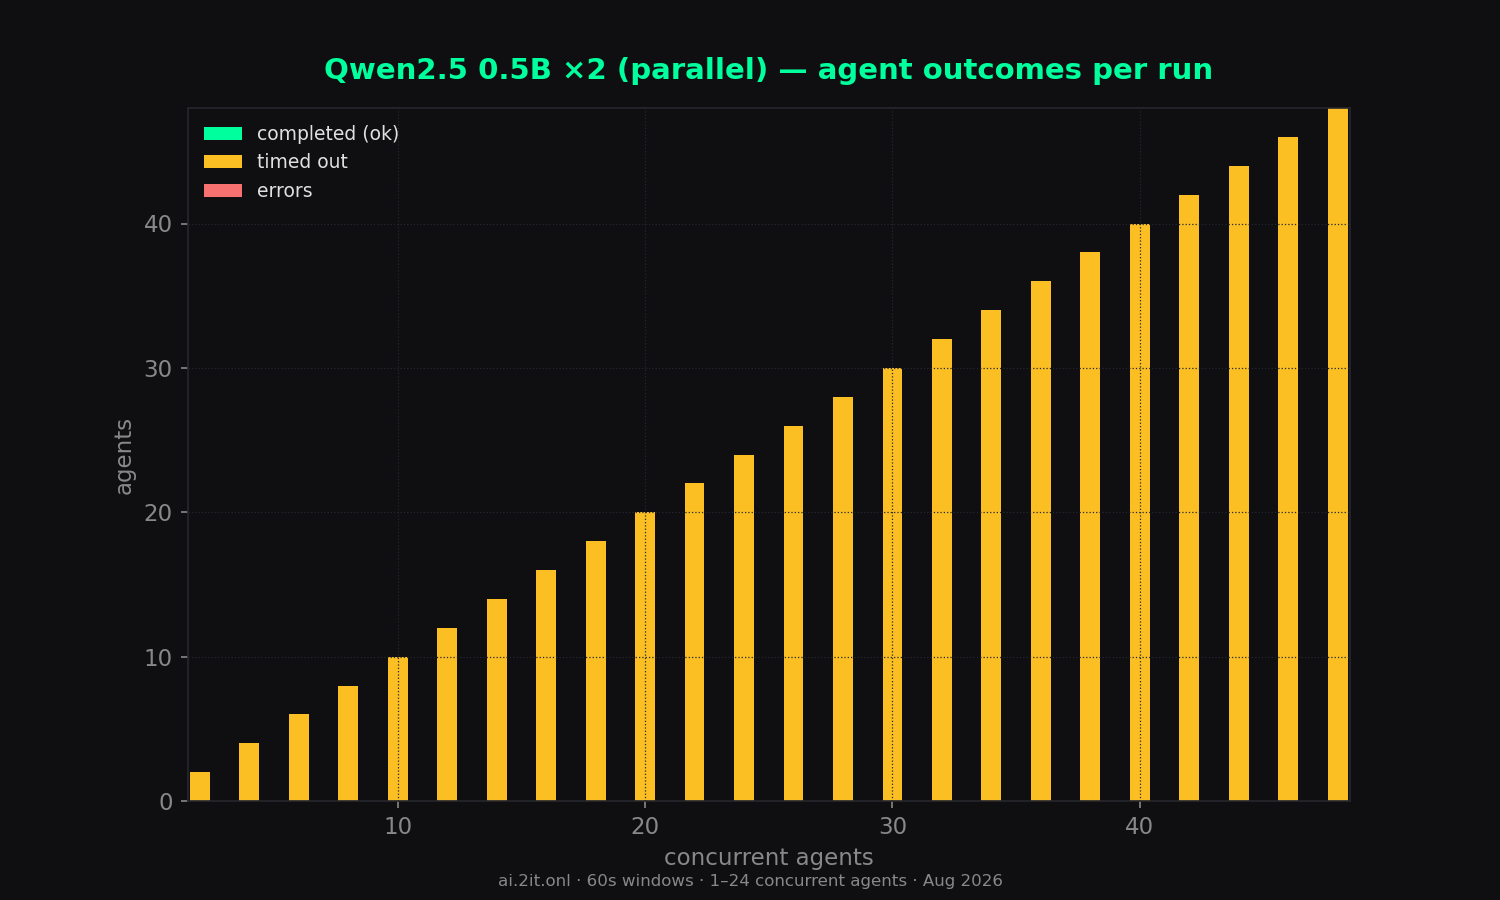
- Errors: 0 across all 24 levels.
Sweep — total concurrency 2–48
| agents | wall (s) | content | reason | total | comb tok/s | comb all | per-agent | per-agent all | scale % | TTFT mean | TTFT max | ok | timeout | err |
|---|---|---|---|---|---|---|---|---|---|---|---|---|---|---|
| 2 | 60.0 | 21,558 | 0 | 21,558 | 359 | 359 | 205.6 | 205.6 | 100% | 7.6s | 11.1s | 0 | 2 | 0 |
| 4 | 60.0 | 34,264 | 0 | 34,264 | 571 | 571 | 151.1 | 168.8 | 159% | 111ms | 129ms | 0 | 4 | 0 |
| 6 | 60.0 | 50,226 | 0 | 50,226 | 836 | 836 | 583.9 | 599.6 | 233% | 2.0s | 2.1s | 0 | 6 | 0 |
| 8 | 60.0 | 43,370 | 0 | 43,370 | 722 | 722 | 225.1 | 229.8 | 201% | 16.2s | 17.3s | 0 | 8 | 0 |
| 10 | 60.0 | 42,075 | 0 | 42,075 | 701 | 701 | 131.3 | 135.2 | 195% | 15.2s | 15.5s | 0 | 10 | 0 |
| 12 | 60.0 | 46,594 | 0 | 46,594 | 776 | 776 | 113.2 | 116.4 | 216% | 11.8s | 13.3s | 0 | 12 | 0 |
| 14 | 60.0 | 50,885 | 0 | 50,885 | 847 | 847 | 131.4 | 133.2 | 236% | 13.7s | 14.9s | 0 | 14 | 0 |
| 16 | 60.0 | 49,695 | 0 | 49,695 | 828 | 828 | 88.1 | 89.0 | 231% | 16.2s | 18.4s | 0 | 16 | 0 |
| 18 | 60.0 | 53,576 | 0 | 53,576 | 892 | 892 | 113.4 | 114.4 | 248% | 19.4s | 20.1s | 0 | 18 | 0 |
| 20 | 60.0 | 55,550 | 0 | 55,550 | 925 | 925 | 95.2 | 96.8 | 258% | 19.7s | 21.0s | 0 | 20 | 0 |
| 22 | 60.0 | 61,222 | 0 | 61,222 | 1,020 | 1,020 | 98.5 | 99.5 | 284% | 21.0s | 23.1s | 0 | 22 | 0 |
| 24 | 60.1 | 51,204 | 0 | 51,204 | 853 | 853 | 88.5 | 89.2 | 238% | 27.2s | 28.2s | 0 | 24 | 0 |
| 26 | 60.1 | 60,695 | 0 | 60,695 | 1,011 | 1,011 | 84.9 | 85.5 | 282% | 18.9s | 21.0s | 0 | 26 | 0 |
| 28 | 60.1 | 57,712 | 0 | 57,712 | 961 | 961 | 85.4 | 86.3 | 268% | 26.1s | 26.7s | 0 | 28 | 0 |
| 30 | 60.1 | 64,897 | 0 | 64,897 | 1,081 | 1,081 | 76.9 | 77.4 | 301% | 25.0s | 26.3s | 0 | 30 | 0 |
| 32 | 60.1 | 86,878 | 0 | 86,878 | 1,446 | 1,446 | 71.6 | 72.9 | 403% | 10.5s | 15.4s | 0 | 32 | 0 |
| 34 | 60.1 | 95,454 | 0 | 95,454 | 1,589 | 1,589 | 75.0 | 76.9 | 443% | 7.8s | 9.5s | 0 | 34 | 0 |
| 36 | 60.1 | 85,474 | 0 | 85,474 | 1,423 | 1,423 | 53.9 | 56.0 | 396% | 13.5s | 14.2s | 0 | 36 | 0 |
| 38 peak | 60.1 | 109,008 | 0 | 109,008 | 1,815 | 1,815 | 66.4 | 68.5 | 506% | 3.6s | 3.9s | 0 | 38 | 0 |
| 40 | 60.1 | 95,521 | 0 | 95,521 | 1,590 | 1,590 | 66.3 | 68.9 | 443% | 13.9s | 15.9s | 0 | 40 | 0 |
| 42 | 60.1 | 93,382 | 0 | 93,382 | 1,555 | 1,555 | 63.2 | 66.4 | 433% | 13.2s | 14.5s | 0 | 42 | 0 |
| 44 | 60.1 | 93,846 | 0 | 93,846 | 1,562 | 1,562 | 65.4 | 68.6 | 435% | 13.6s | 15.2s | 0 | 44 | 0 |
| 46 | 60.1 | 84,457 | 0 | 84,457 | 1,406 | 1,406 | 55.5 | 58.7 | 392% | 19.0s | 20.1s | 0 | 46 | 0 |
| 48 | 60.1 | 96,869 | 0 | 96,869 | 1,612 | 1,612 | 65.3 | 69.3 | 449% | 13.0s | 13.8s | 0 | 48 | 0 |
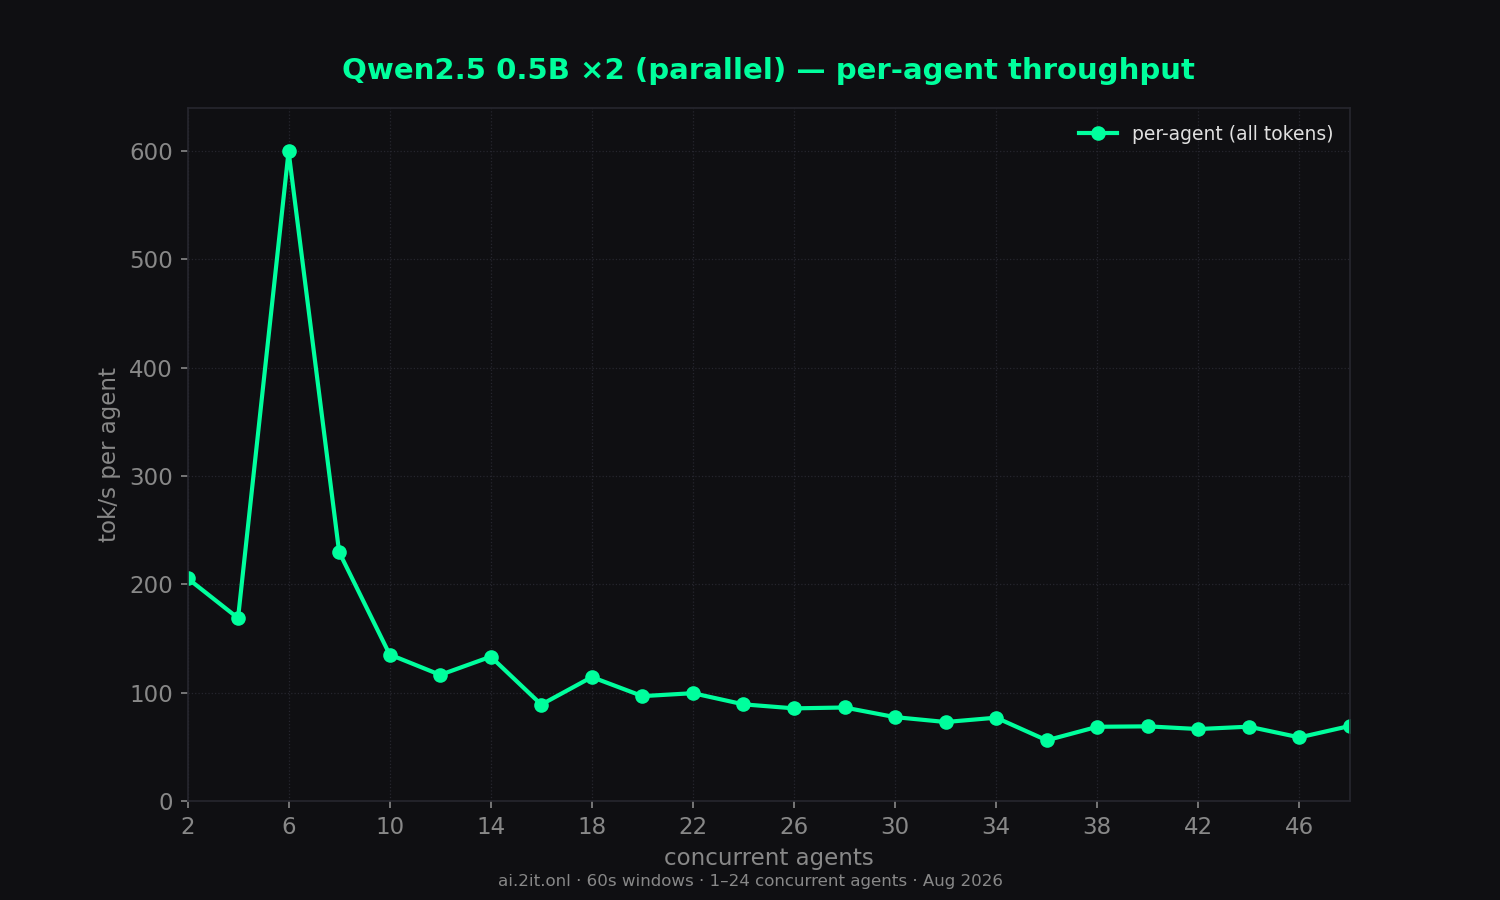
Parallel run: N agents ran on each of two LM Studio instances simultaneously (total 2×N). * burst artifact — agents queued ~11–16s then generated in a short burst; the per-agent timer inflates the number. Trust combined throughput and TTFT columns. Peak row = highest combined (all-token) throughput.
Charts
Raw data & downloads
- report.md6 KB
- sweep-summary.csv2 KB
- sweep-summary.json11 KB
- combined_throughput.png130 KB · original matplotlib export
- combined_vs_per_agent.png107 KB · original matplotlib export
- dashboard_1_24.png182 KB · original matplotlib export
- outcome_breakdown.png59 KB · original matplotlib export
- per_agent_throughput.png117 KB · original matplotlib export
- scaling_efficiency.png84 KB · original matplotlib export
- time_to_first_token.png67 KB · original matplotlib export
- total_tokens_generated.png74 KB · original matplotlib export