Mistralai Ministral 3 3B (2512)
server model id:
mistralai/ministral-3-3b-instruct-2512non-thinkingKV Q4_0ctx 32k3B params
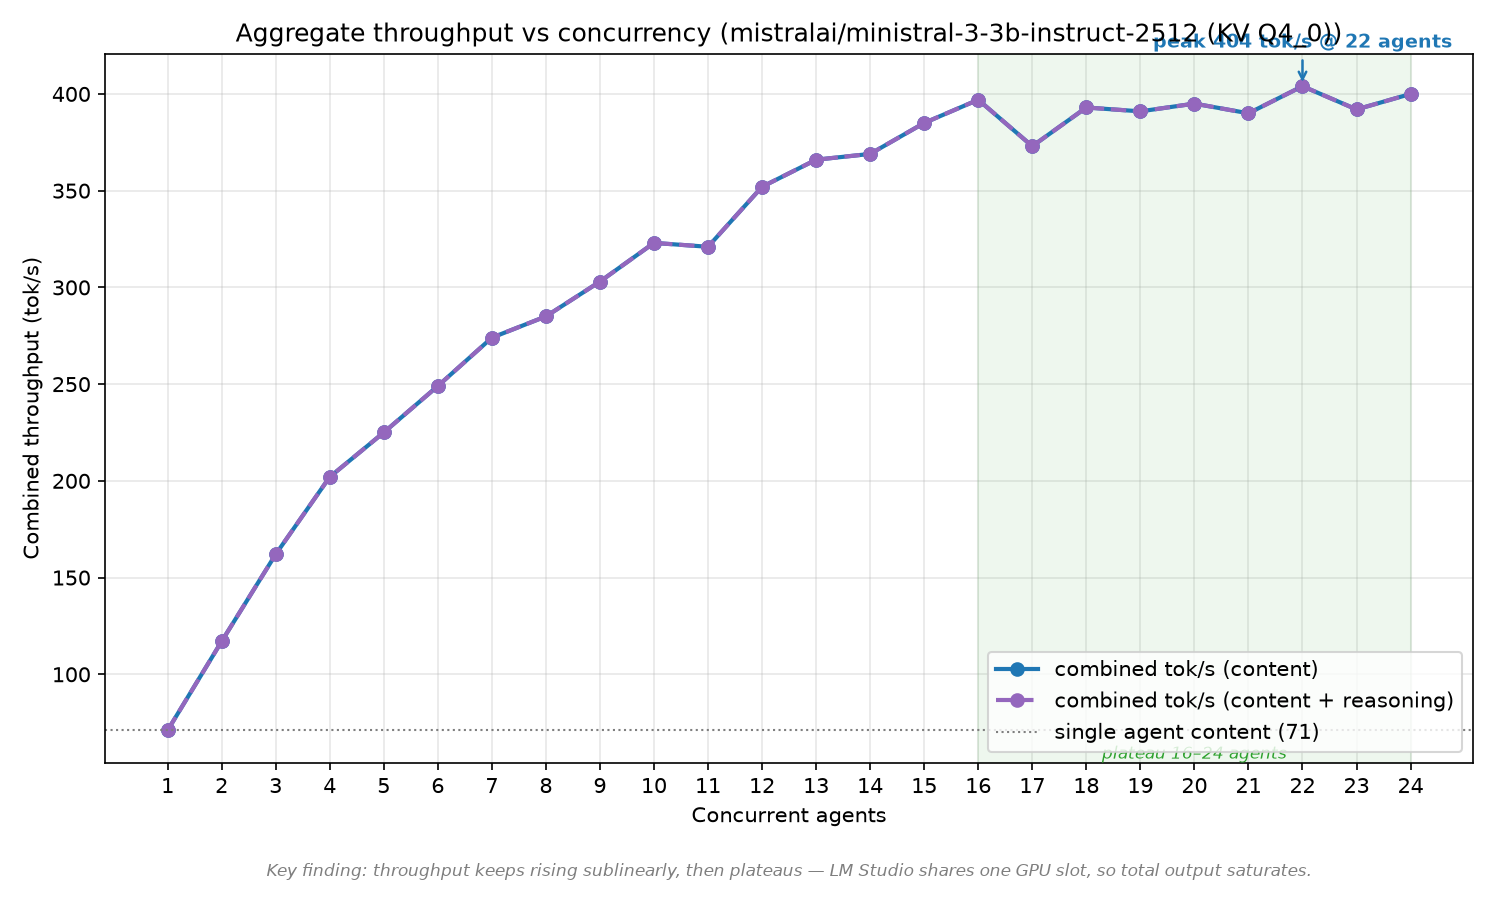
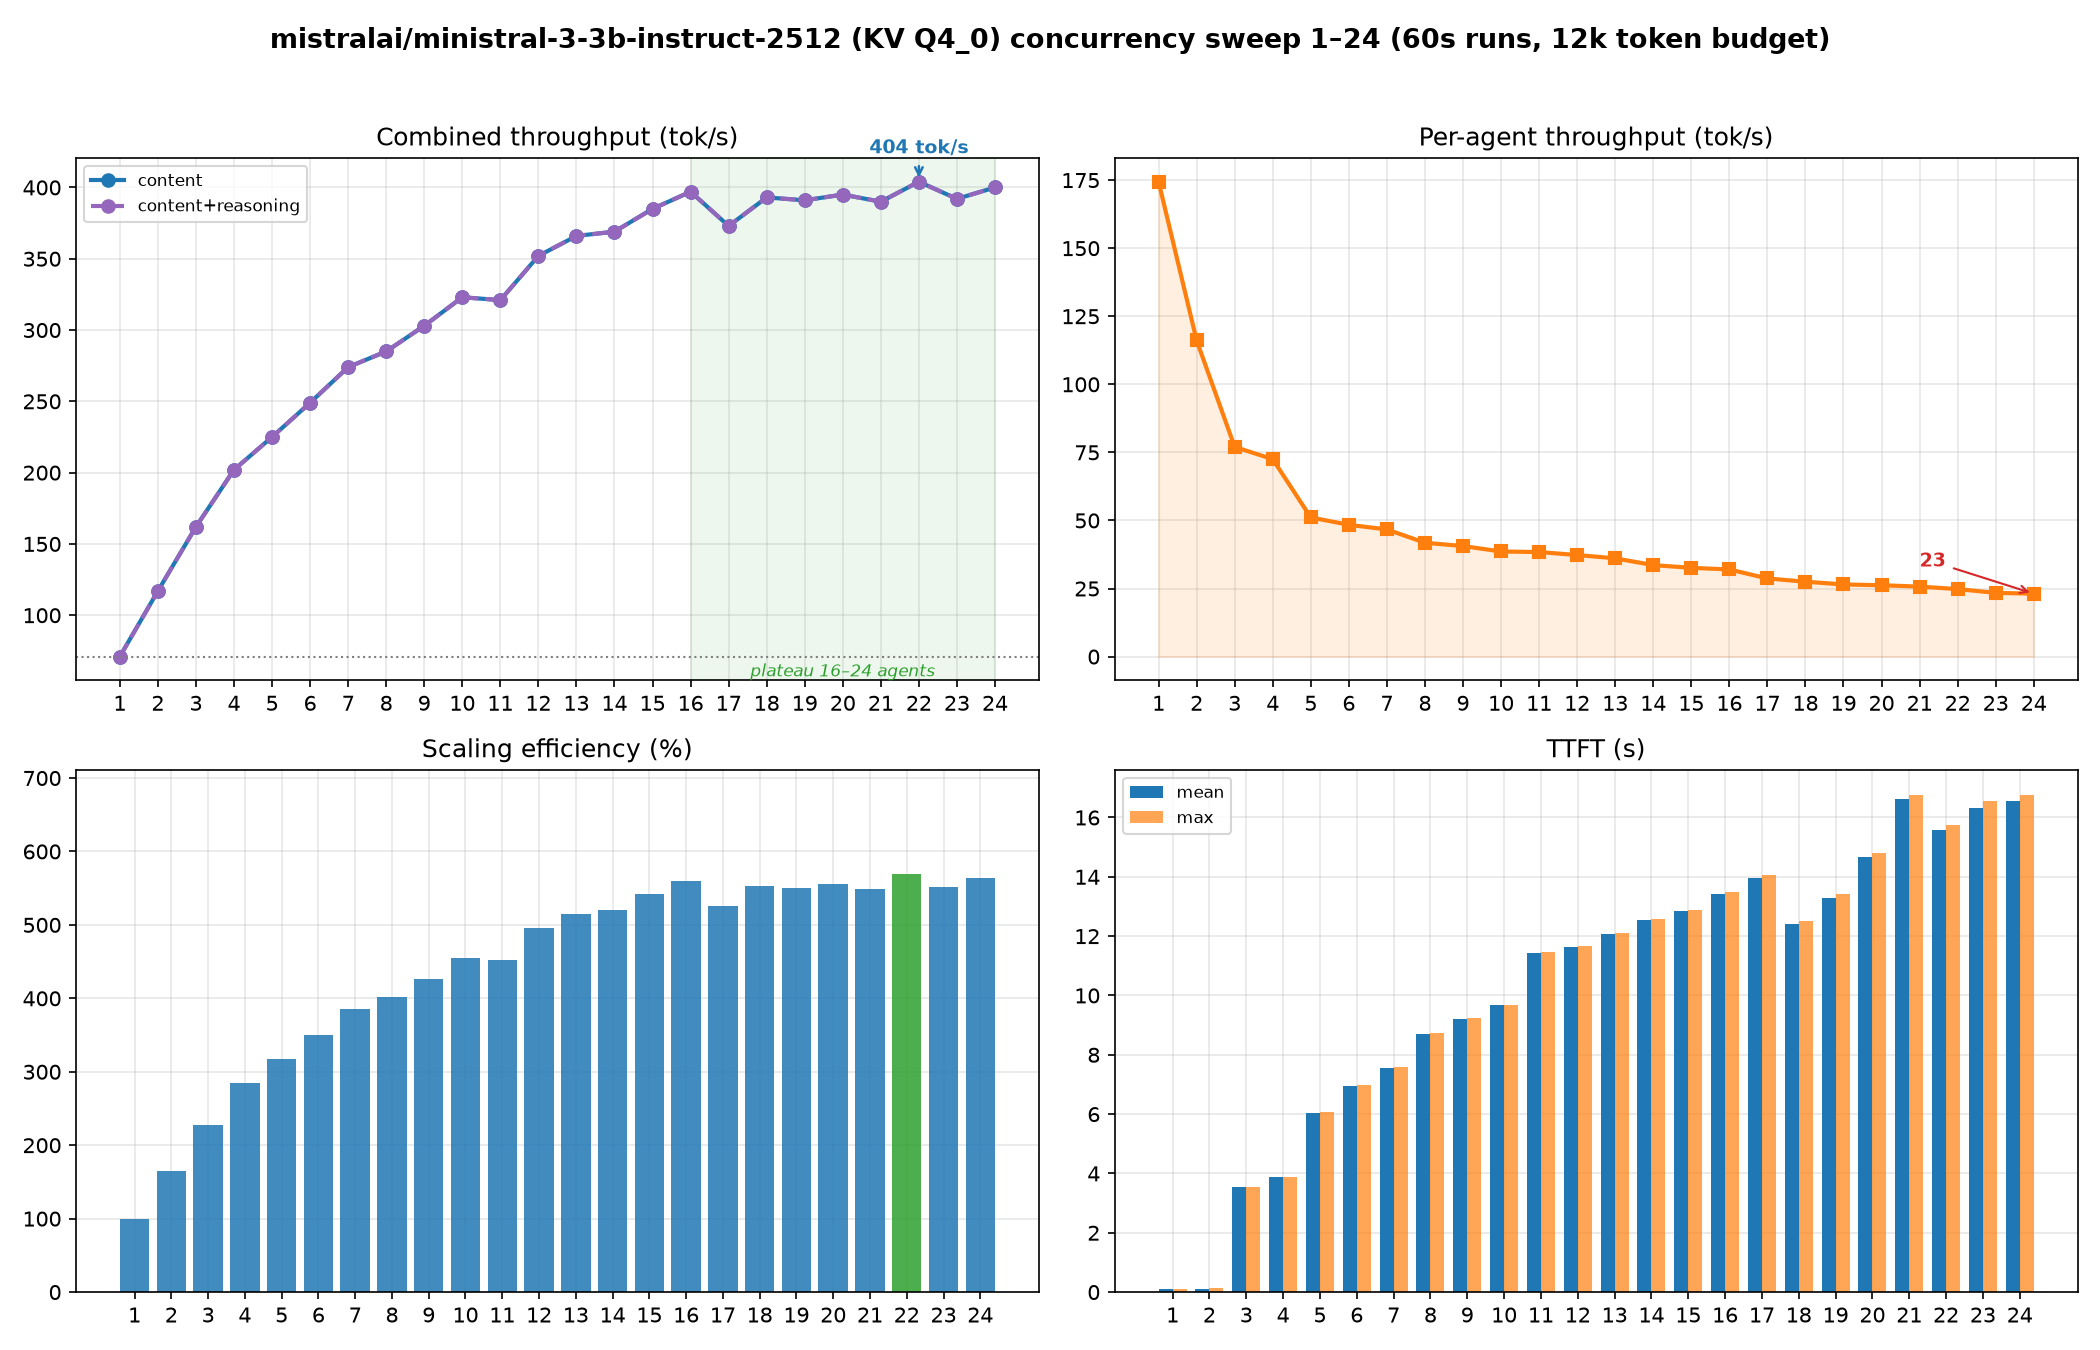
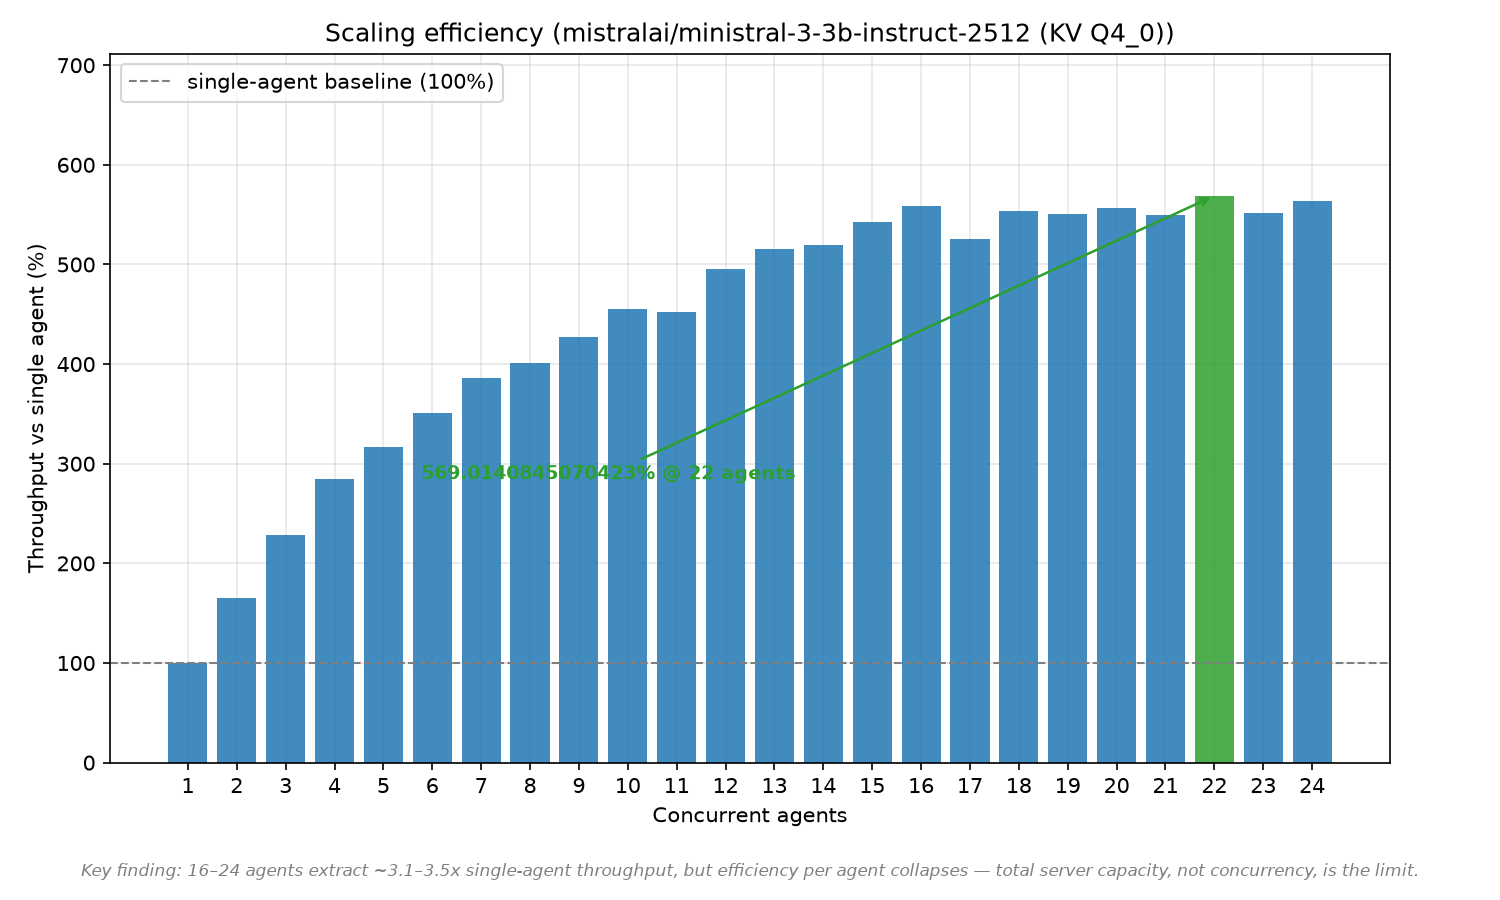
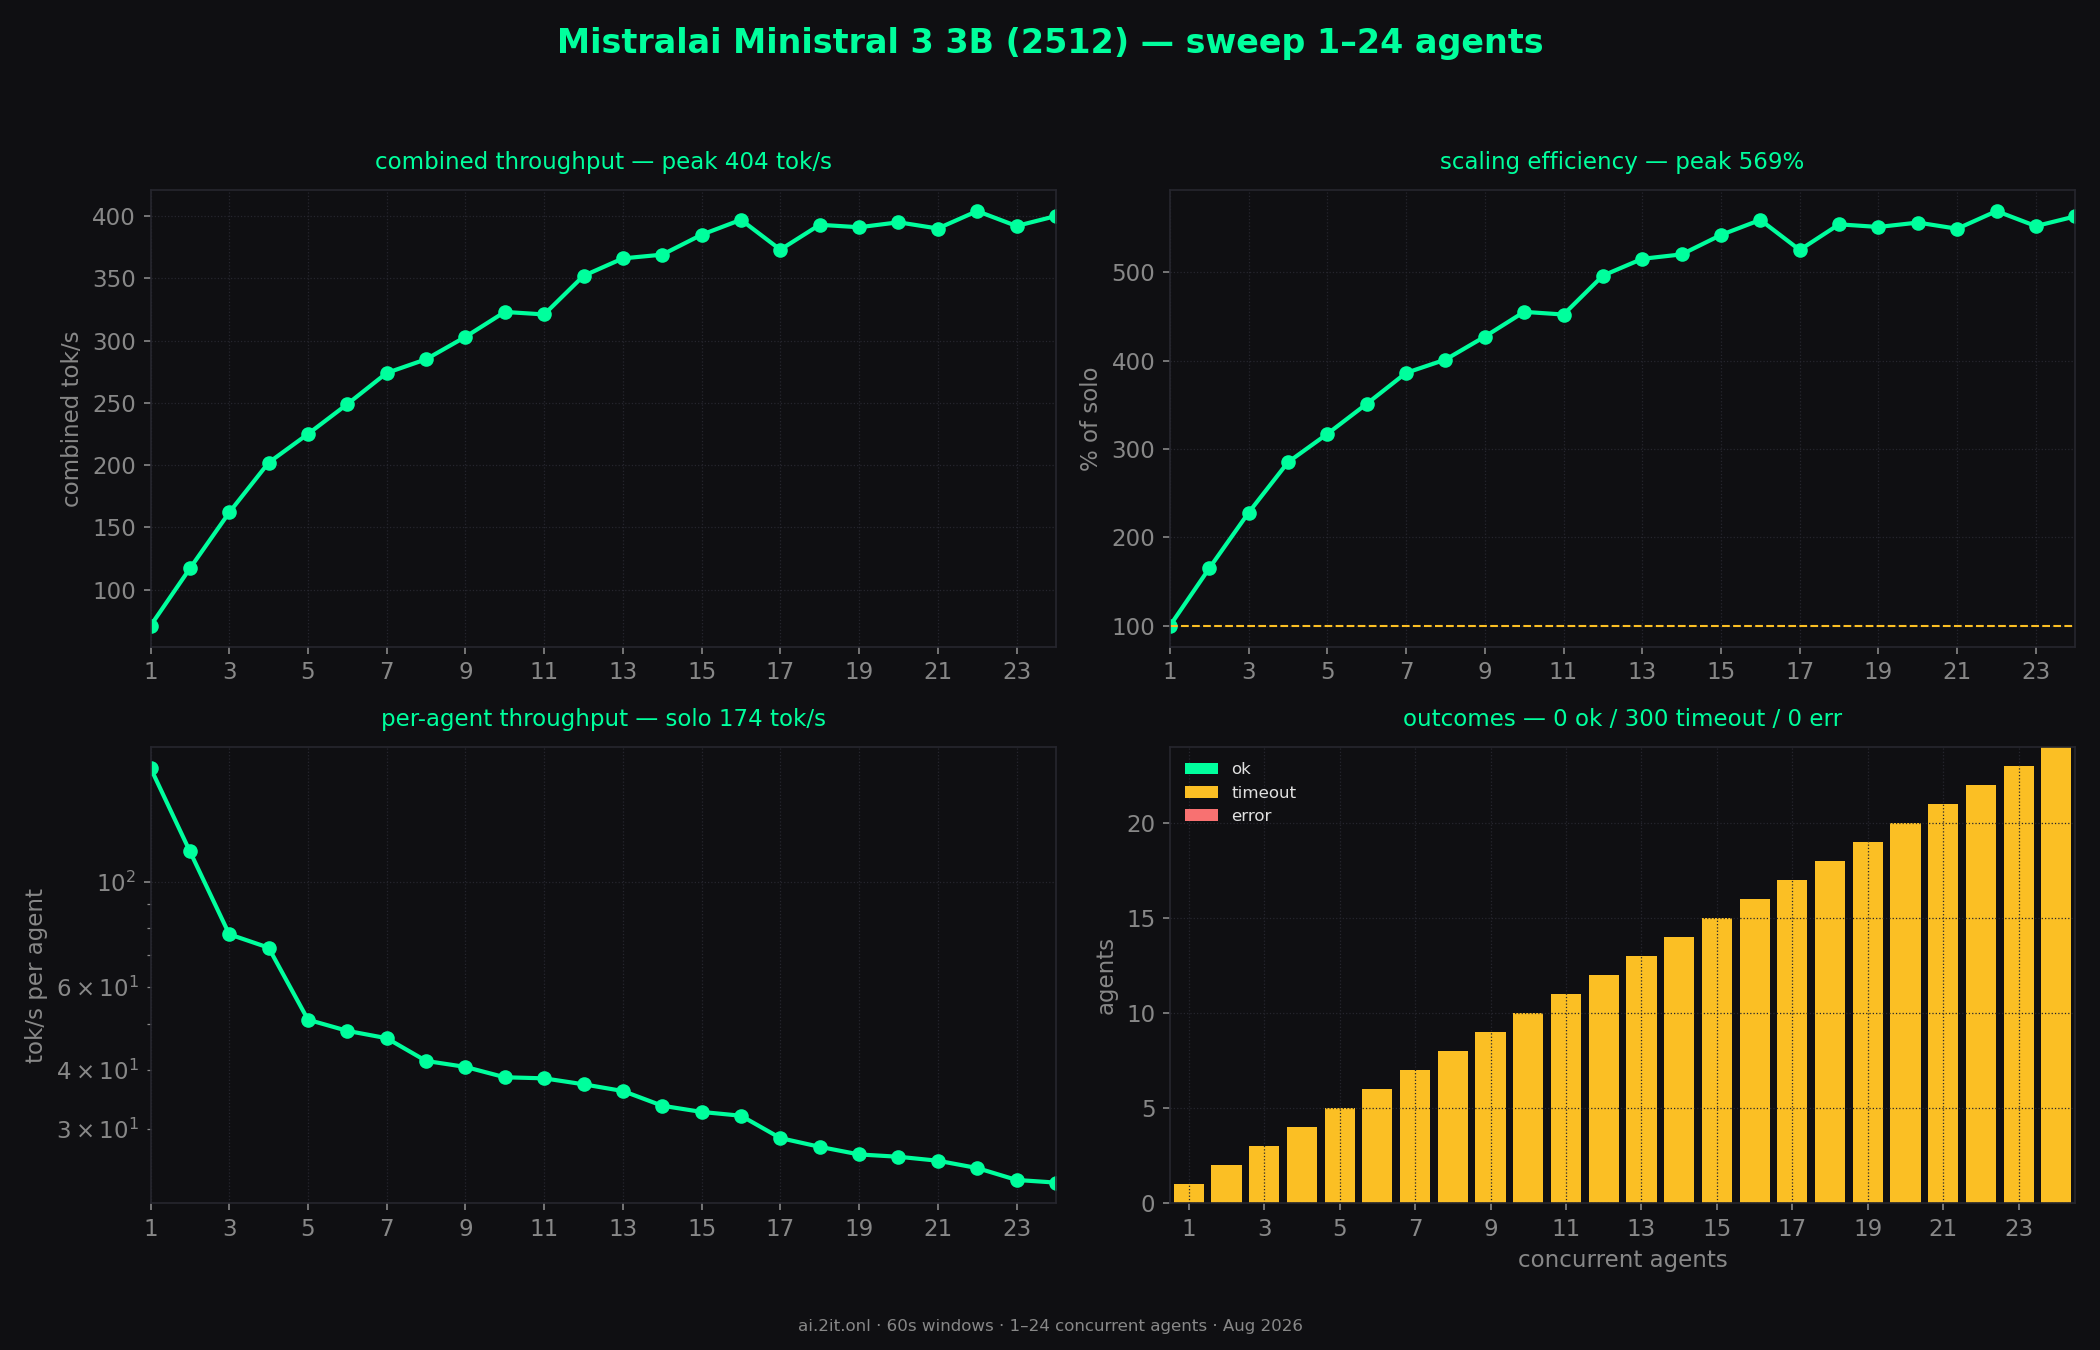
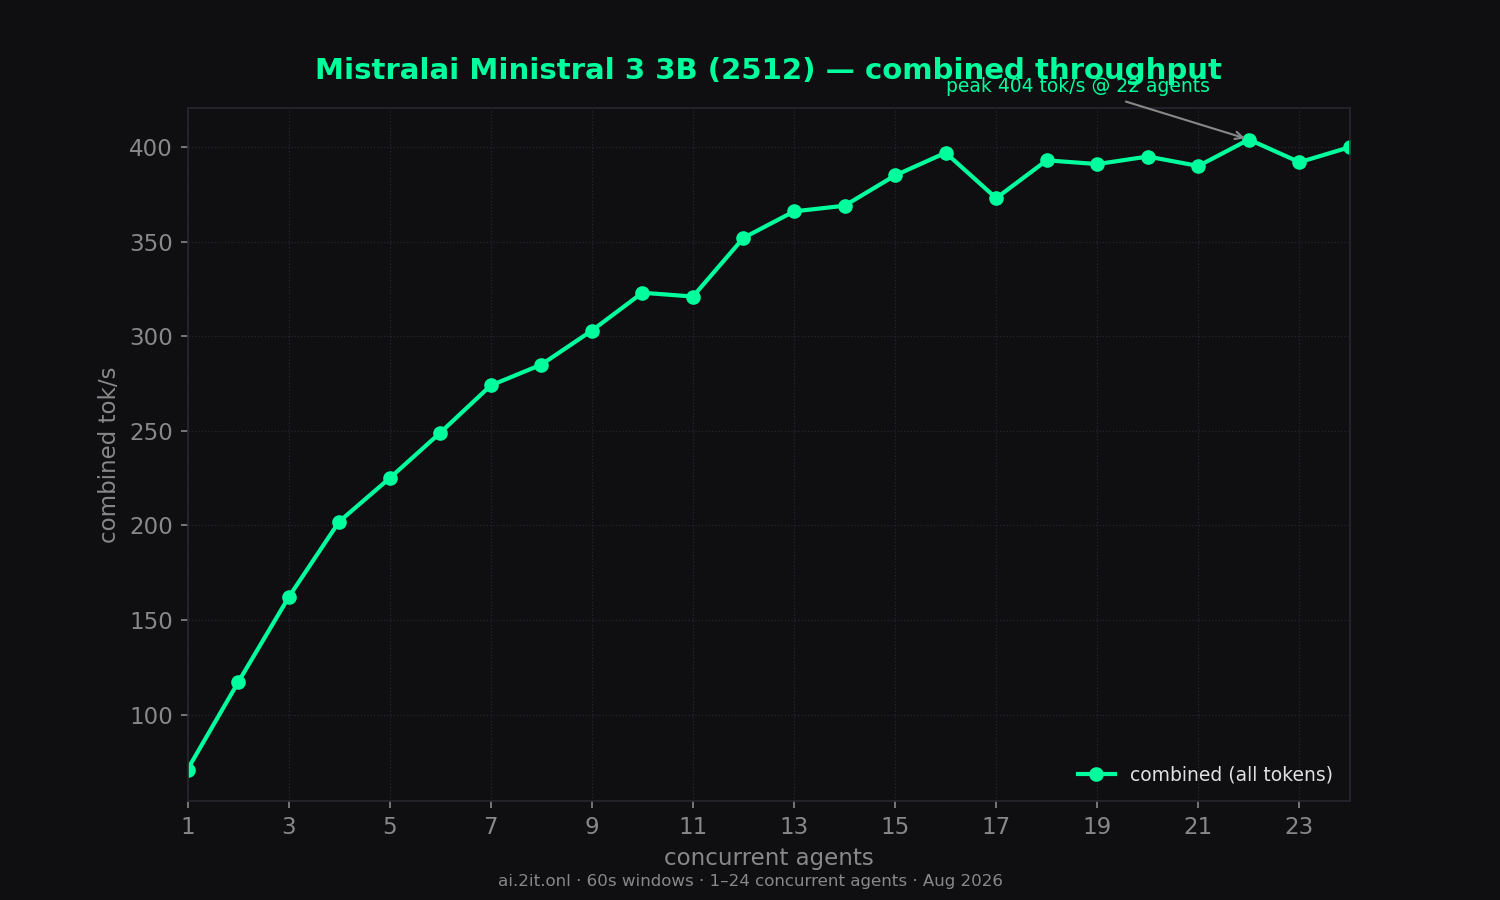
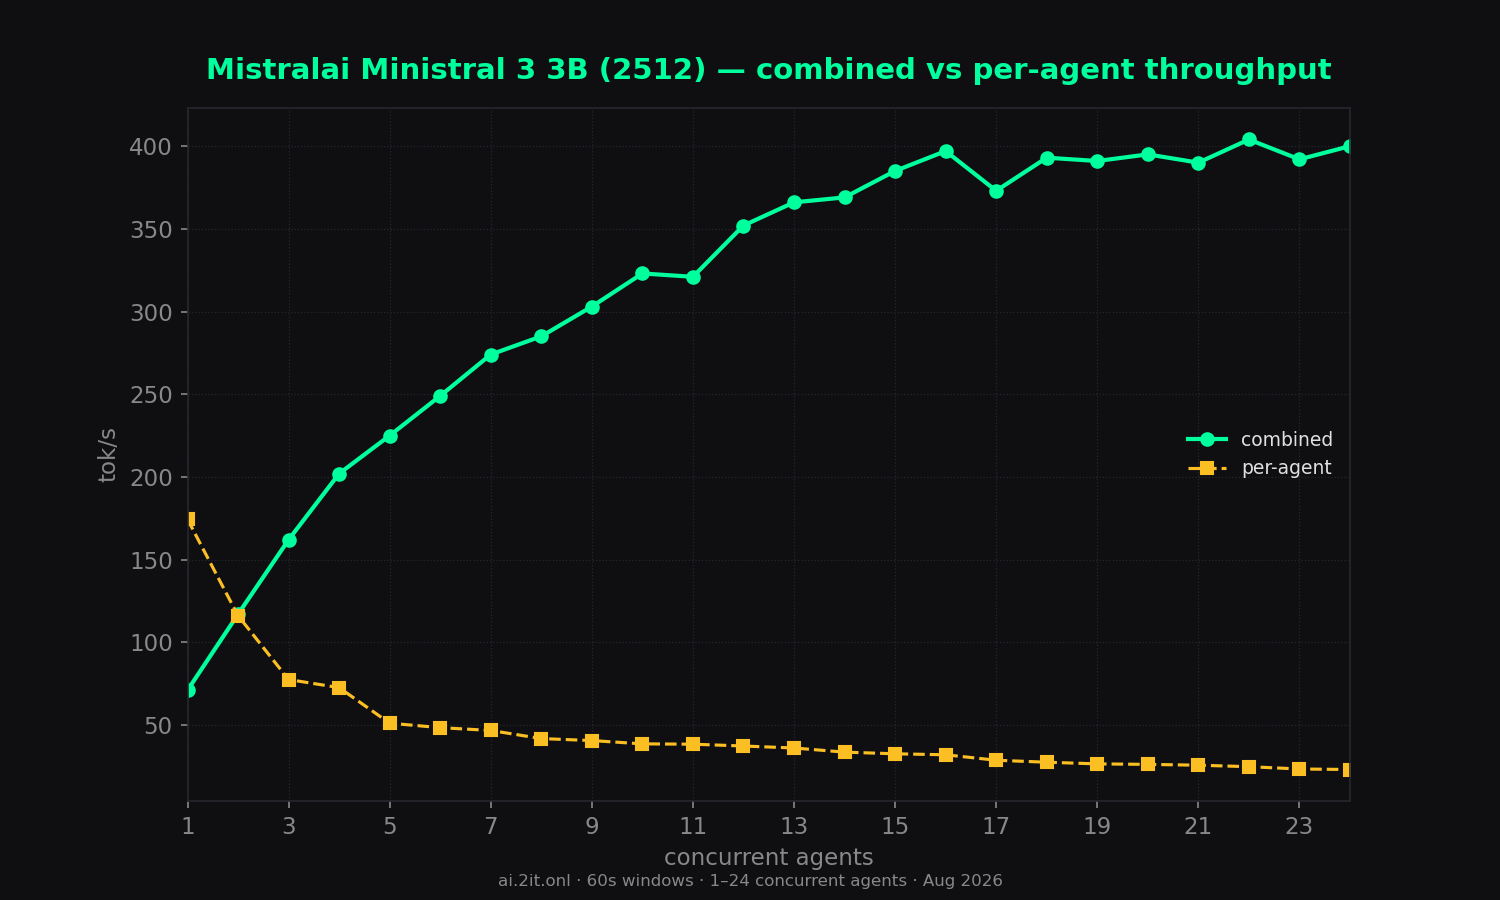
The official build vs the unsloth sibling at the same Q4_0 KV: 71 tok/s solo, smooth monotonic scaling to 404 tok/s at 22 agents — faster at every concurrency below the top end.
Key findings
- Clean, all-content output: 0 reasoning tokens everywhere.
- Much better behaved than the unsloth build at the same KV Q4_0: solo throughput is 71 tok/s vs 47 for
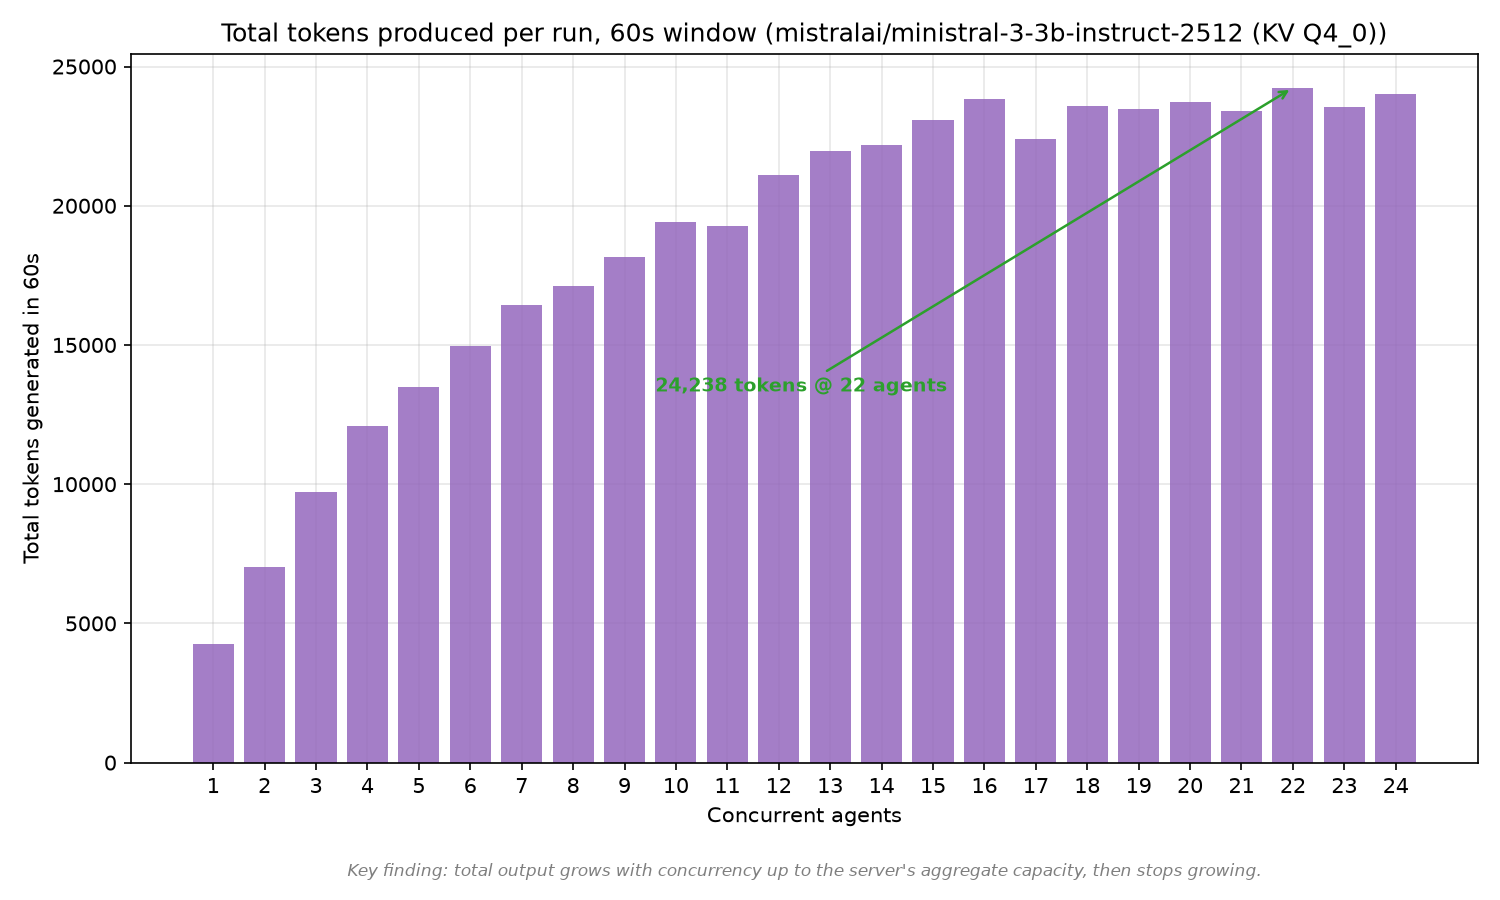
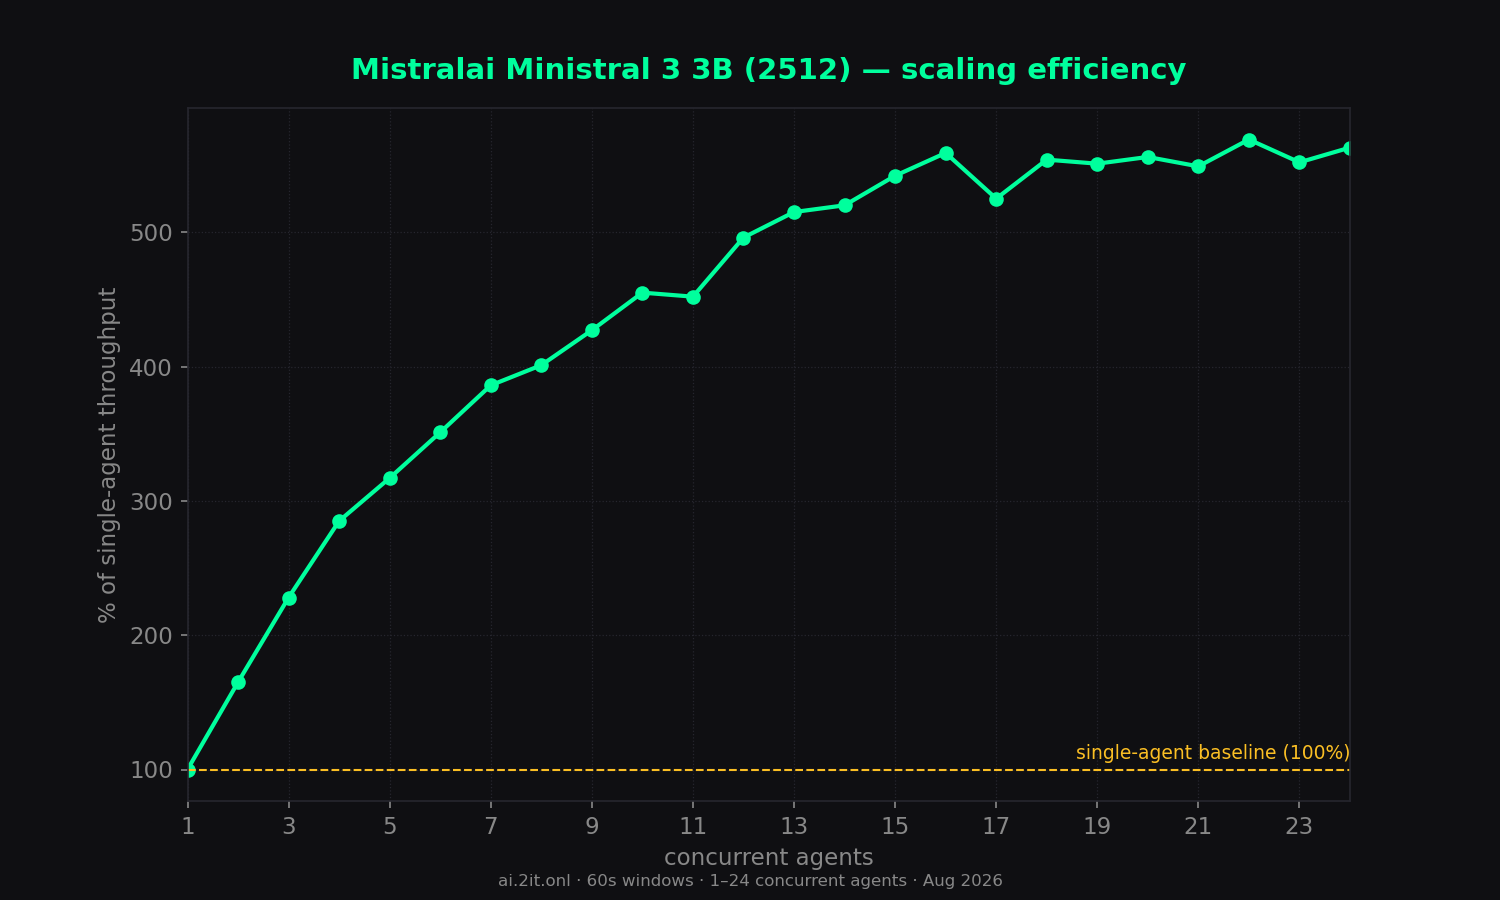
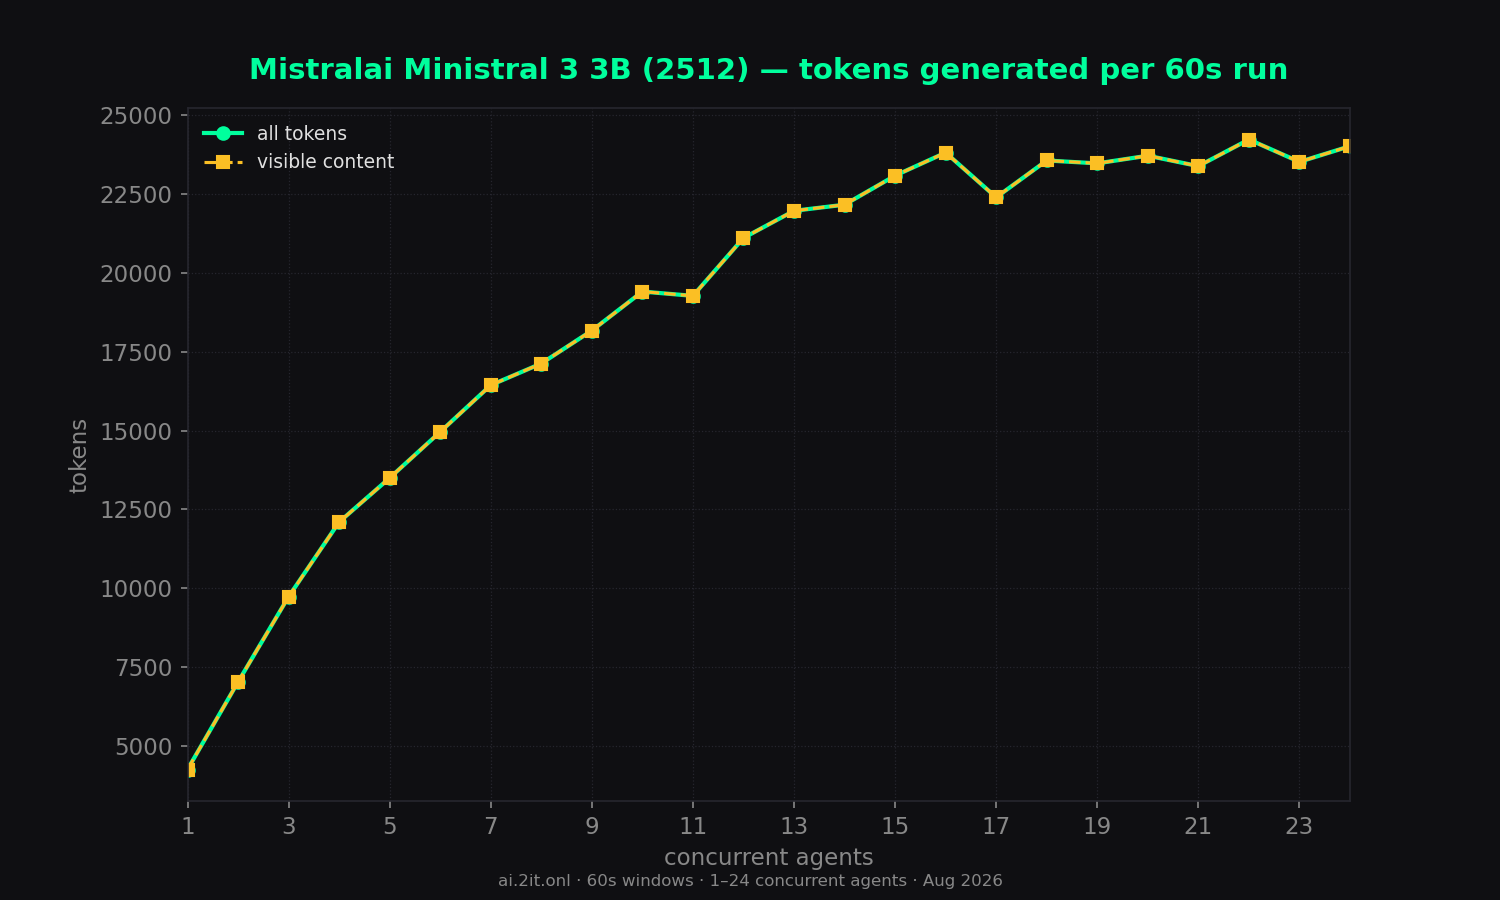
unsloth/ministral-3-3b-instruct-2512(same 4-bit KV), and the scaling curve is smooth and monotonic (71 → 400 tok/s) instead of unsloth's erratic 106–365 swings. - Peak 404 tok/s at 22 agents (5.7x); essentially flat at ~390–400 from 16–24. Near-identical absolute peak to the unsloth build (~410), so the two builds converge at high concurrency even though mistralai wins solo.
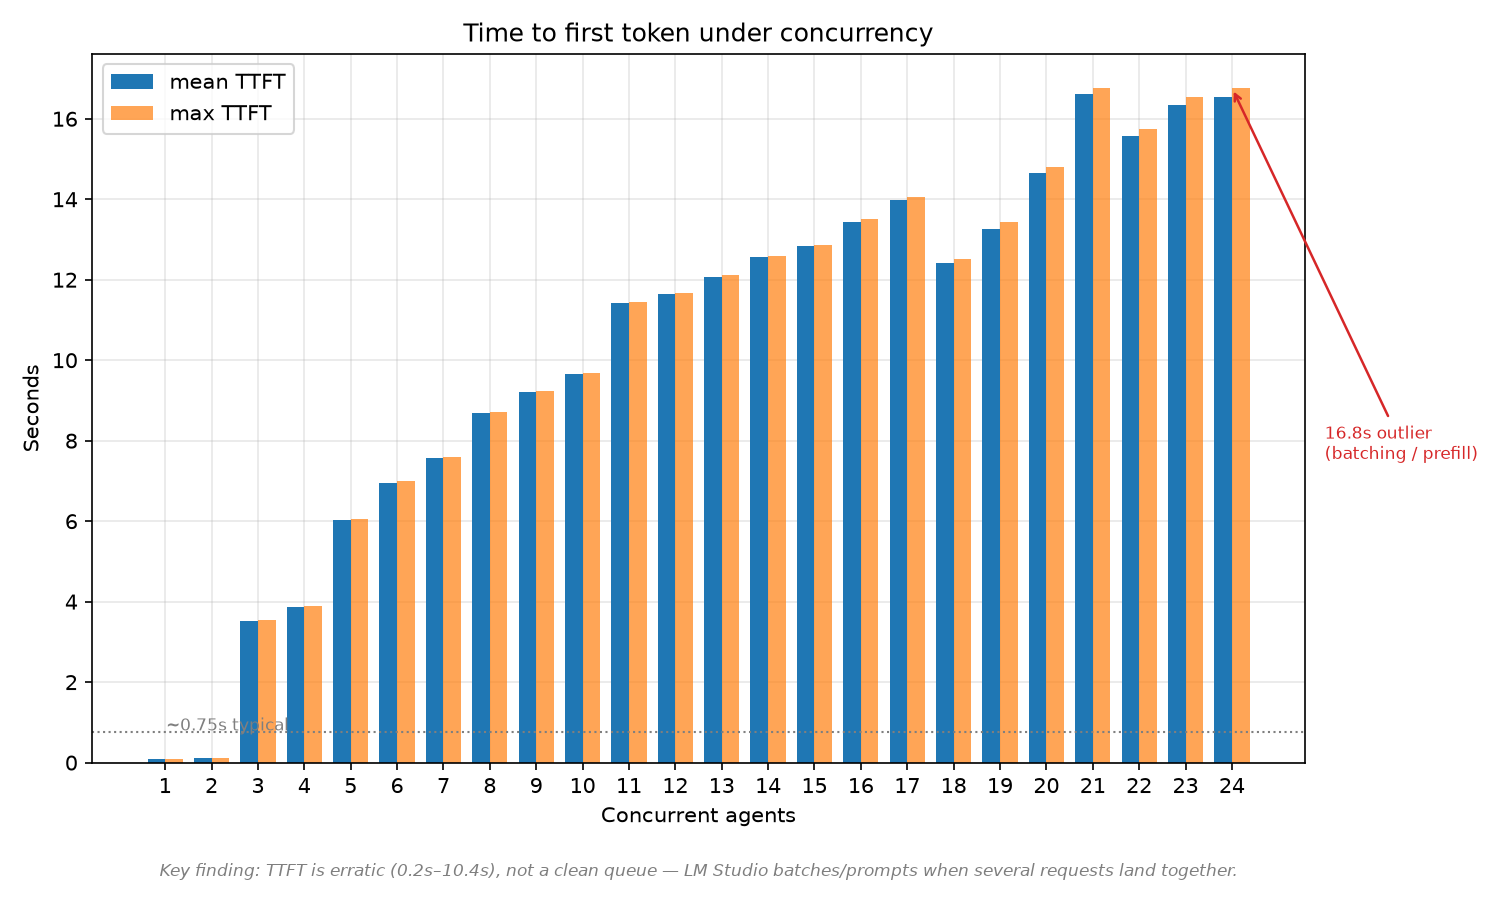
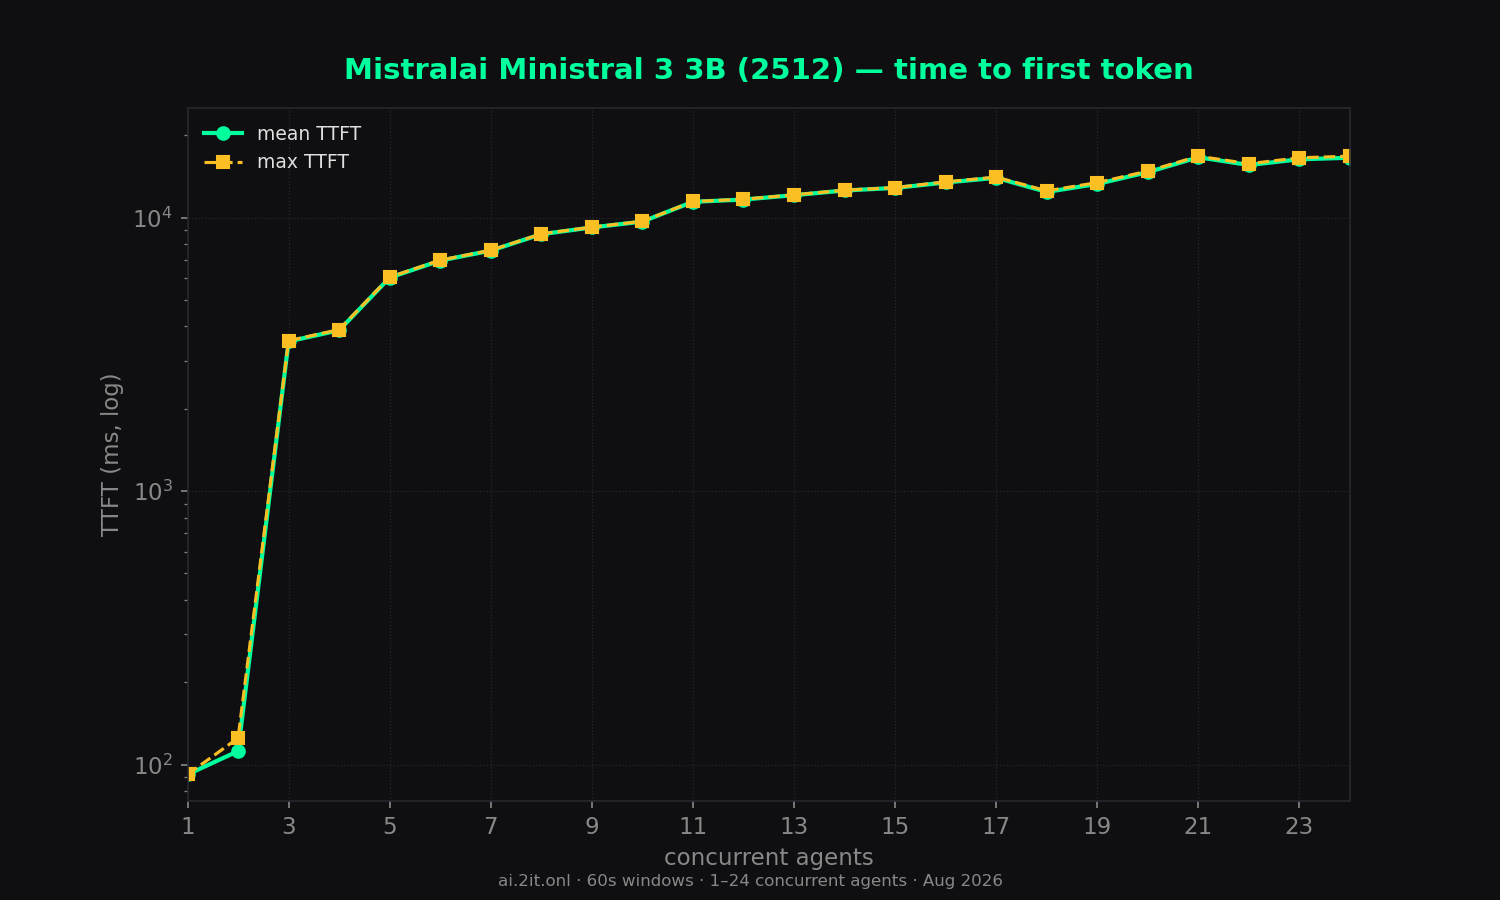
- TTFT: 92ms solo → ~16.5s at 24; smooth growth, no outliers.
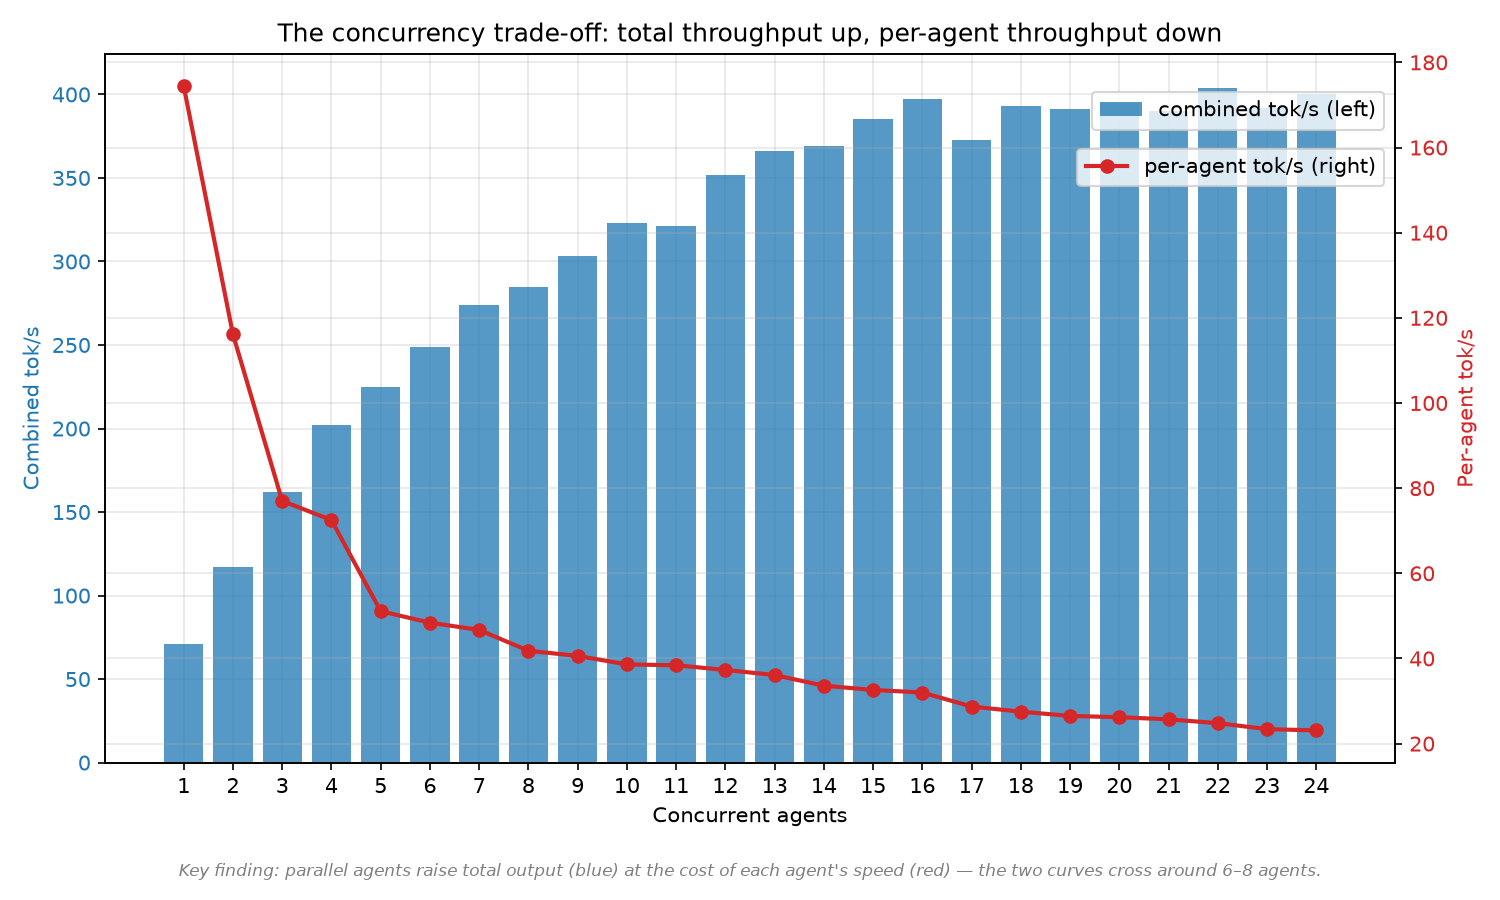
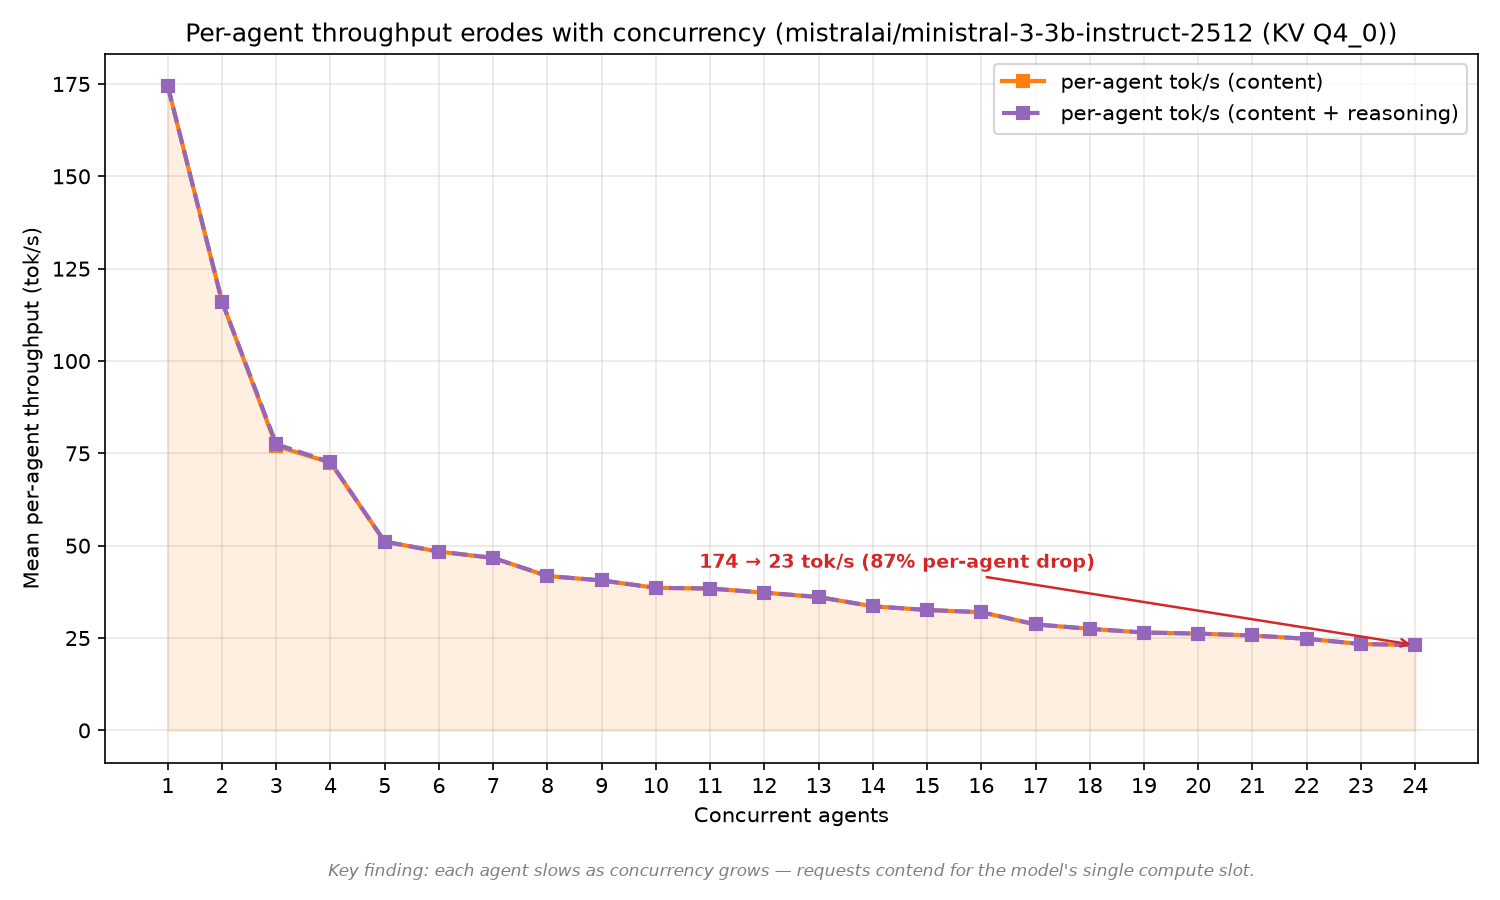
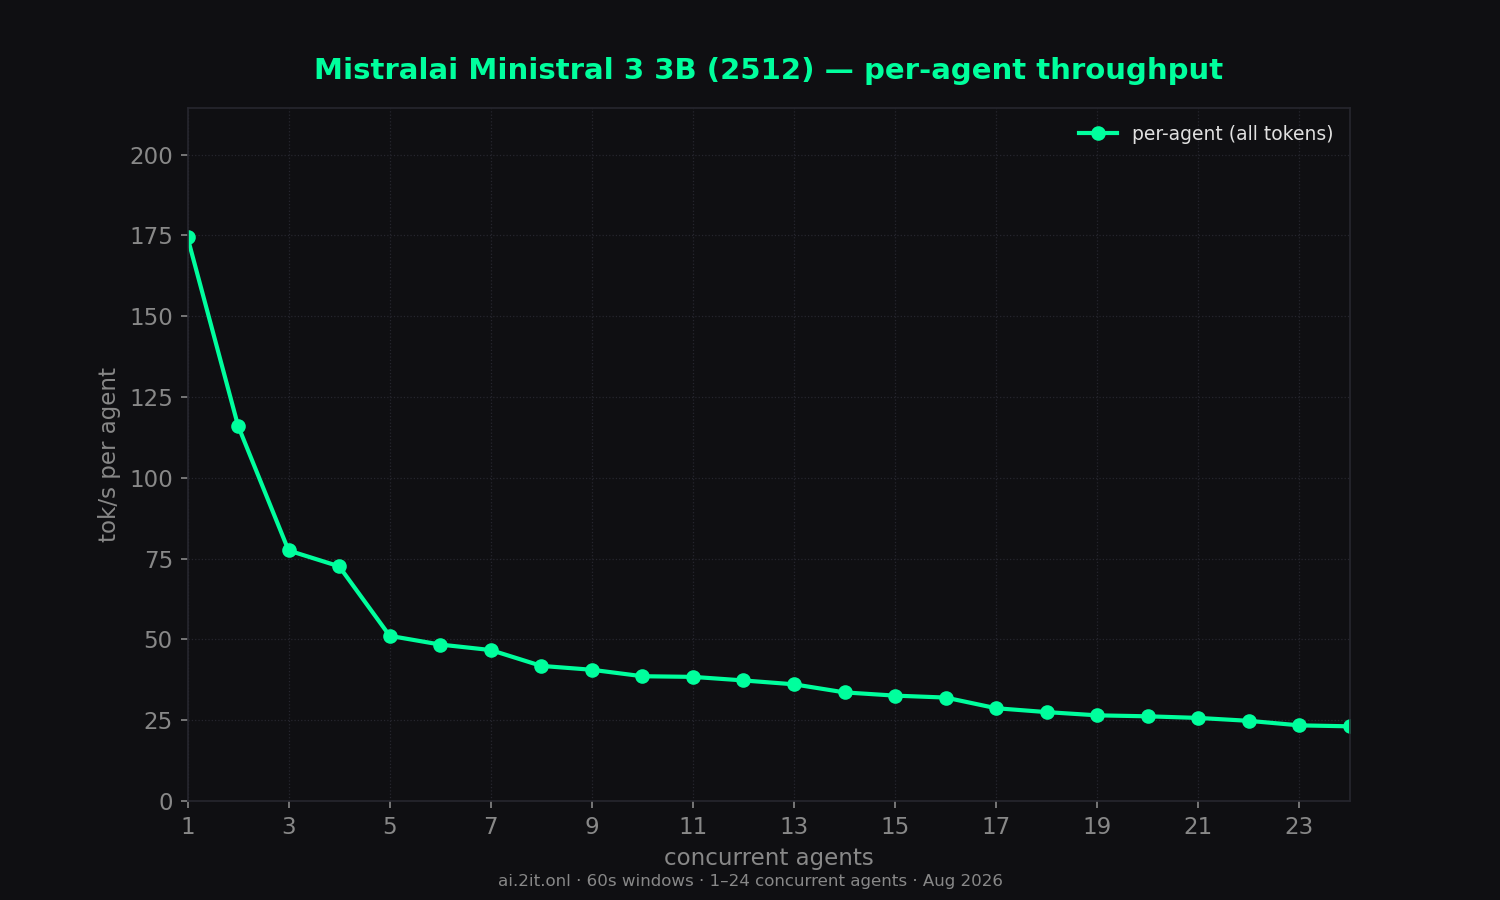
- Per-agent speed: ~23–25 tok/s at high concurrency (vs ~174 solo burst metric).
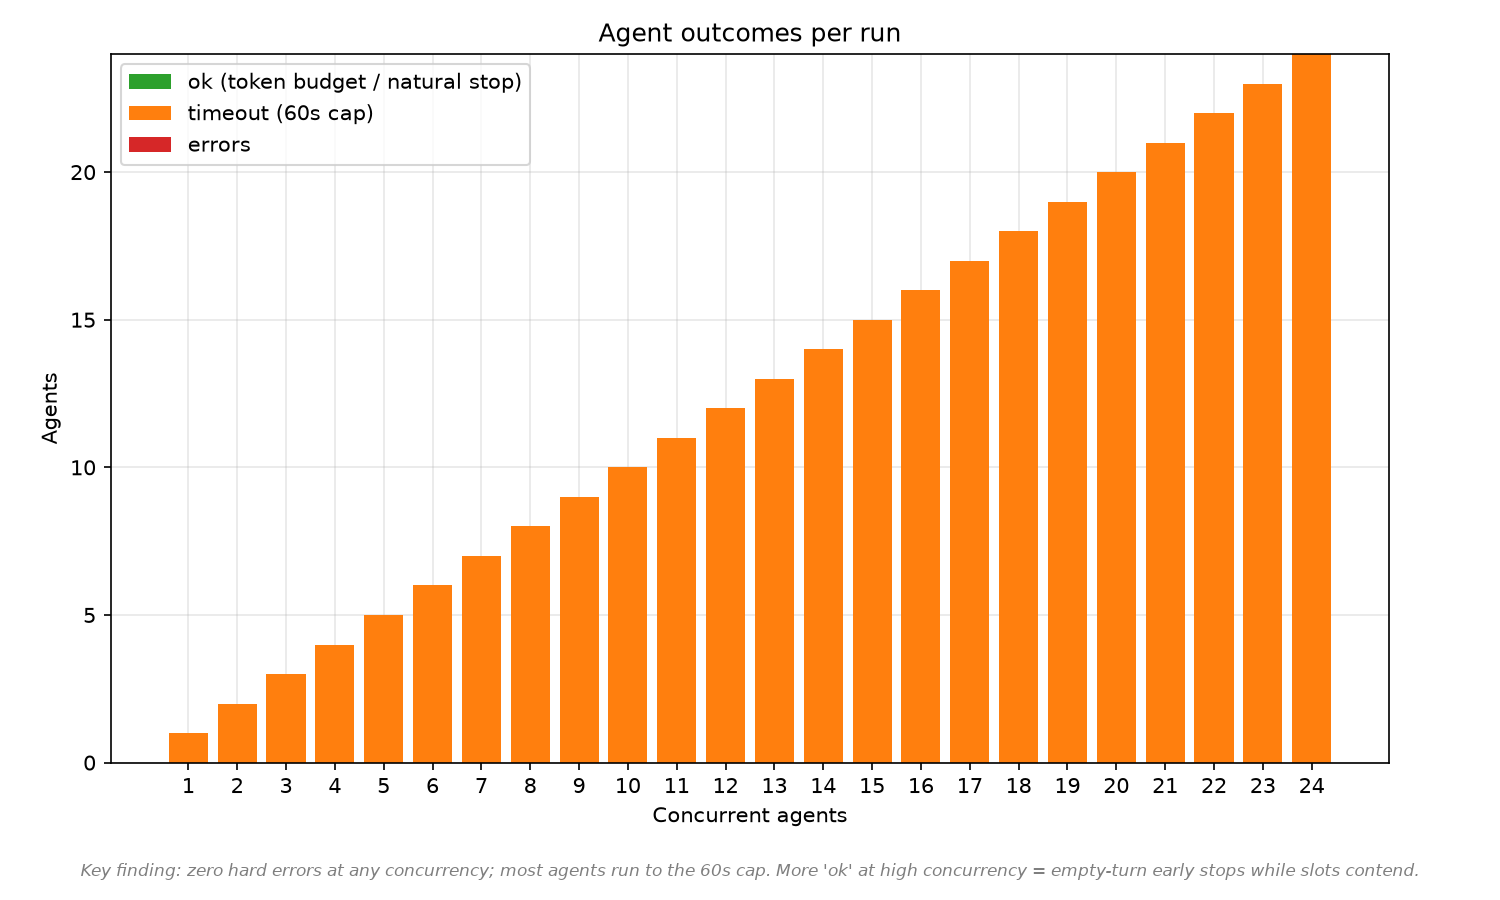
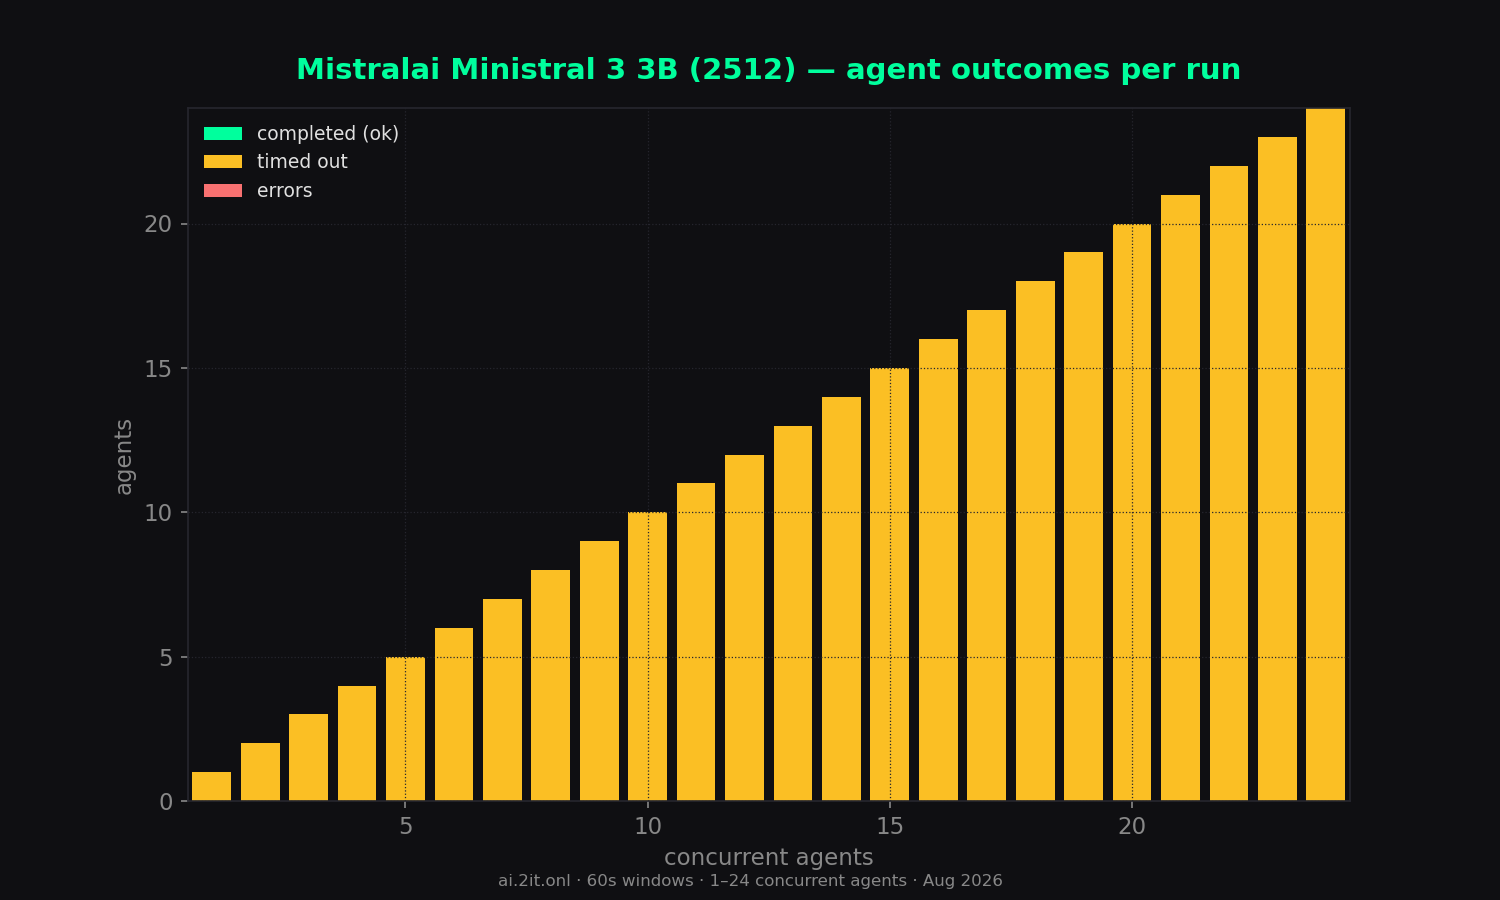
- Errors: 0 across all 24 runs.
Sweep — total concurrency 1–24
| agents | wall (s) | content | reason | total | comb tok/s | comb all | per-agent | per-agent all | scale % | TTFT mean | TTFT max | ok | timeout | err |
|---|---|---|---|---|---|---|---|---|---|---|---|---|---|---|
| 1 | 60.0 | 4,248 | 0 | 4,248 | 71 | 71 | 174.4 | 174.4 | 100% | 92ms | 92ms | 0 | 1 | 0 |
| 2 | 60.0 | 7,026 | 0 | 7,026 | 117 | 117 | 116.1 | 116.1 | 165% | 112ms | 125ms | 0 | 2 | 0 |
| 3 | 60.0 | 9,730 | 0 | 9,730 | 162 | 162 | 77.0 | 77.5 | 228% | 3.5s | 3.5s | 0 | 3 | 0 |
| 4 | 60.0 | 12,100 | 0 | 12,100 | 202 | 202 | 72.5 | 72.6 | 285% | 3.9s | 3.9s | 0 | 4 | 0 |
| 5 | 60.0 | 13,500 | 0 | 13,500 | 225 | 225 | 51.1 | 51.1 | 317% | 6.0s | 6.1s | 0 | 5 | 0 |
| 6 | 60.0 | 14,961 | 0 | 14,961 | 249 | 249 | 48.4 | 48.4 | 351% | 7.0s | 7.0s | 0 | 6 | 0 |
| 7 | 60.0 | 16,443 | 0 | 16,443 | 274 | 274 | 46.7 | 46.7 | 386% | 7.6s | 7.6s | 0 | 7 | 0 |
| 8 | 60.0 | 17,130 | 0 | 17,130 | 285 | 285 | 41.8 | 41.8 | 401% | 8.7s | 8.7s | 0 | 8 | 0 |
| 9 | 60.0 | 18,175 | 0 | 18,175 | 303 | 303 | 40.6 | 40.6 | 427% | 9.2s | 9.2s | 0 | 9 | 0 |
| 10 | 60.0 | 19,413 | 0 | 19,413 | 323 | 323 | 38.6 | 38.6 | 455% | 9.7s | 9.7s | 0 | 10 | 0 |
| 11 | 60.0 | 19,277 | 0 | 19,277 | 321 | 321 | 38.4 | 38.4 | 452% | 11.4s | 11.5s | 0 | 11 | 0 |
| 12 | 60.0 | 21,114 | 0 | 21,114 | 352 | 352 | 37.3 | 37.3 | 496% | 11.6s | 11.7s | 0 | 12 | 0 |
| 13 | 60.0 | 21,976 | 0 | 21,976 | 366 | 366 | 36.1 | 36.1 | 515% | 12.1s | 12.1s | 0 | 13 | 0 |
| 14 | 60.0 | 22,169 | 0 | 22,169 | 369 | 369 | 33.6 | 33.6 | 520% | 12.6s | 12.6s | 0 | 14 | 0 |
| 15 | 60.0 | 23,092 | 0 | 23,092 | 385 | 385 | 32.6 | 32.6 | 542% | 12.8s | 12.9s | 0 | 15 | 0 |
| 16 | 60.0 | 23,822 | 0 | 23,822 | 397 | 397 | 32.0 | 32.0 | 559% | 13.4s | 13.5s | 0 | 16 | 0 |
| 17 | 60.1 | 22,402 | 0 | 22,402 | 373 | 373 | 28.7 | 28.7 | 525% | 14.0s | 14.1s | 0 | 17 | 0 |
| 18 | 60.0 | 23,572 | 0 | 23,572 | 393 | 393 | 27.5 | 27.5 | 554% | 12.4s | 12.5s | 0 | 18 | 0 |
| 19 | 60.0 | 23,481 | 0 | 23,481 | 391 | 391 | 26.5 | 26.5 | 551% | 13.3s | 13.4s | 0 | 19 | 0 |
| 20 | 60.0 | 23,724 | 0 | 23,724 | 395 | 395 | 26.2 | 26.2 | 556% | 14.7s | 14.8s | 0 | 20 | 0 |
| 21 | 60.0 | 23,393 | 0 | 23,393 | 390 | 390 | 25.7 | 25.7 | 549% | 16.6s | 16.8s | 0 | 21 | 0 |
| 22 peak | 60.0 | 24,238 | 0 | 24,238 | 404 | 404 | 24.8 | 24.8 | 569% | 15.6s | 15.7s | 0 | 22 | 0 |
| 23 | 60.1 | 23,529 | 0 | 23,529 | 392 | 392 | 23.4 | 23.4 | 552% | 16.3s | 16.5s | 0 | 23 | 0 |
| 24 | 60.1 | 24,026 | 0 | 24,026 | 400 | 400 | 23.1 | 23.1 | 563% | 16.5s | 16.8s | 0 | 24 | 0 |
* burst artifact — agents queued ~11–16s then generated in a short burst; the per-agent timer inflates the number. Trust combined throughput and TTFT columns. Peak row = highest combined (all-token) throughput.
Charts
Raw data & downloads
- report.md6 KB
- sweep-summary.csv2 KB
- sweep-summary.json11 KB
- combined_throughput.png118 KB · original matplotlib export
- combined_vs_per_agent.png104 KB · original matplotlib export
- dashboard_1_24.png166 KB · original matplotlib export
- outcome_breakdown.png57 KB · original matplotlib export
- per_agent_throughput.png106 KB · original matplotlib export
- scaling_efficiency.png86 KB · original matplotlib export
- time_to_first_token.png70 KB · original matplotlib export
- total_tokens_generated.png74 KB · original matplotlib export