MiniCPM5 1B
server model id:
minicpm5-1b-claude-opus-fable5-v2-thinkingthinkingKV F16ctx 32k1B params
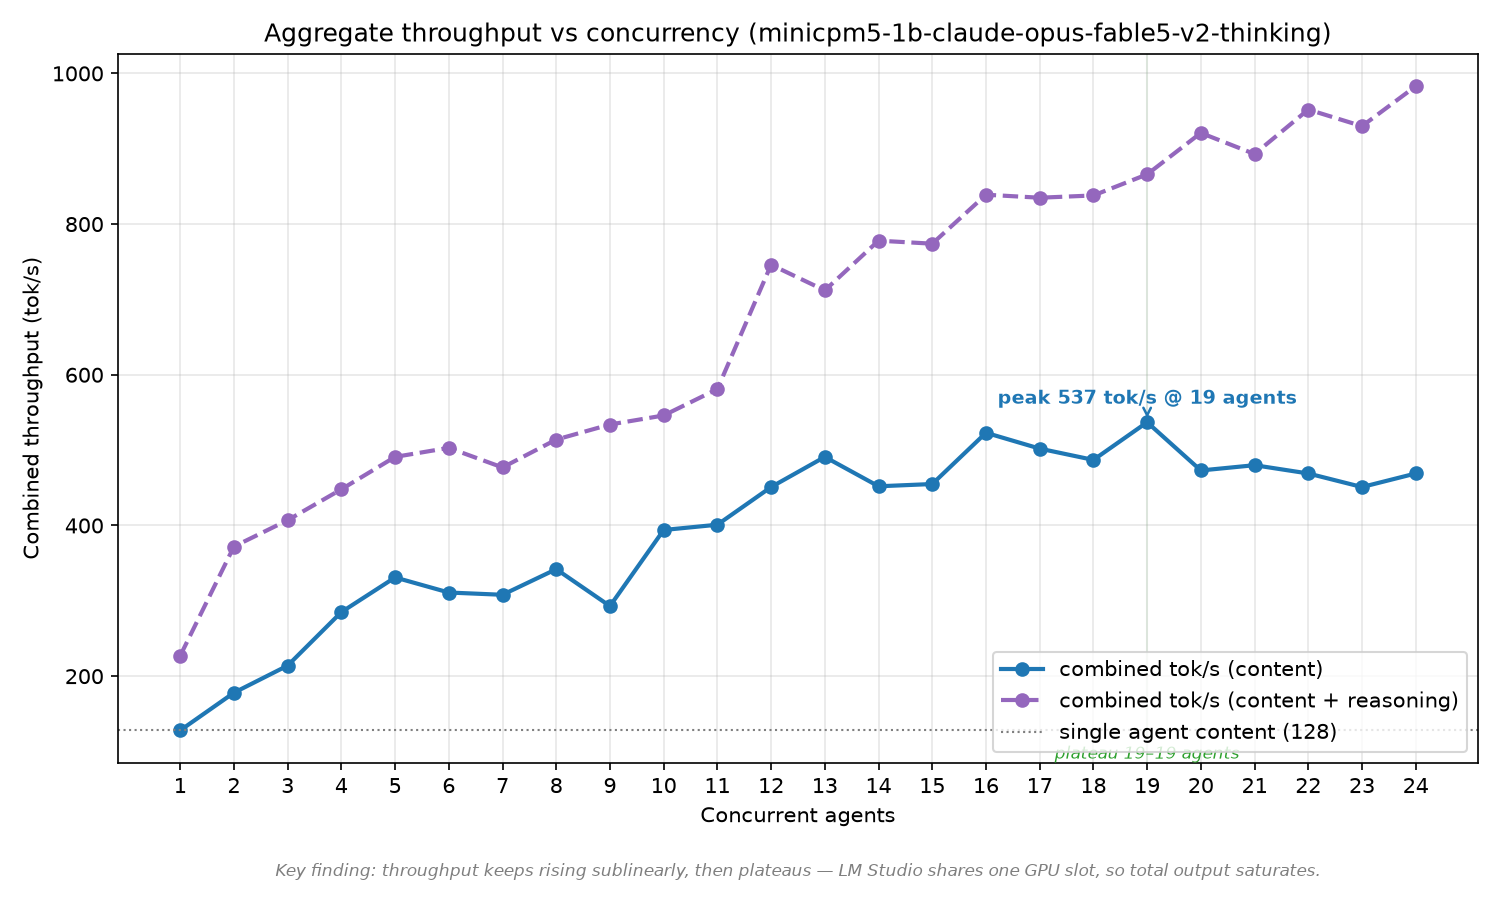
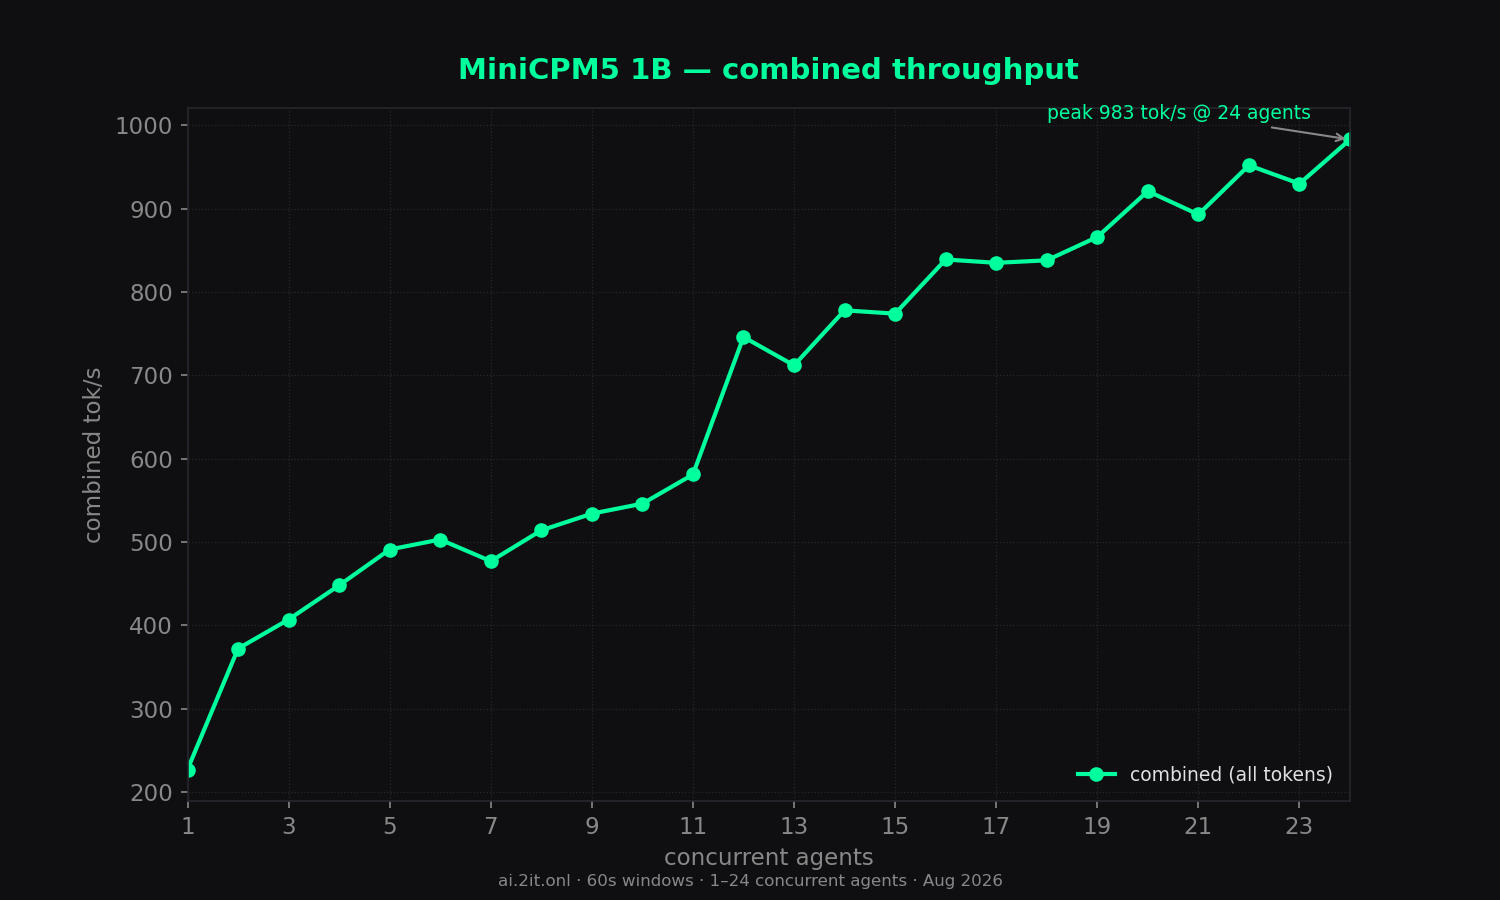
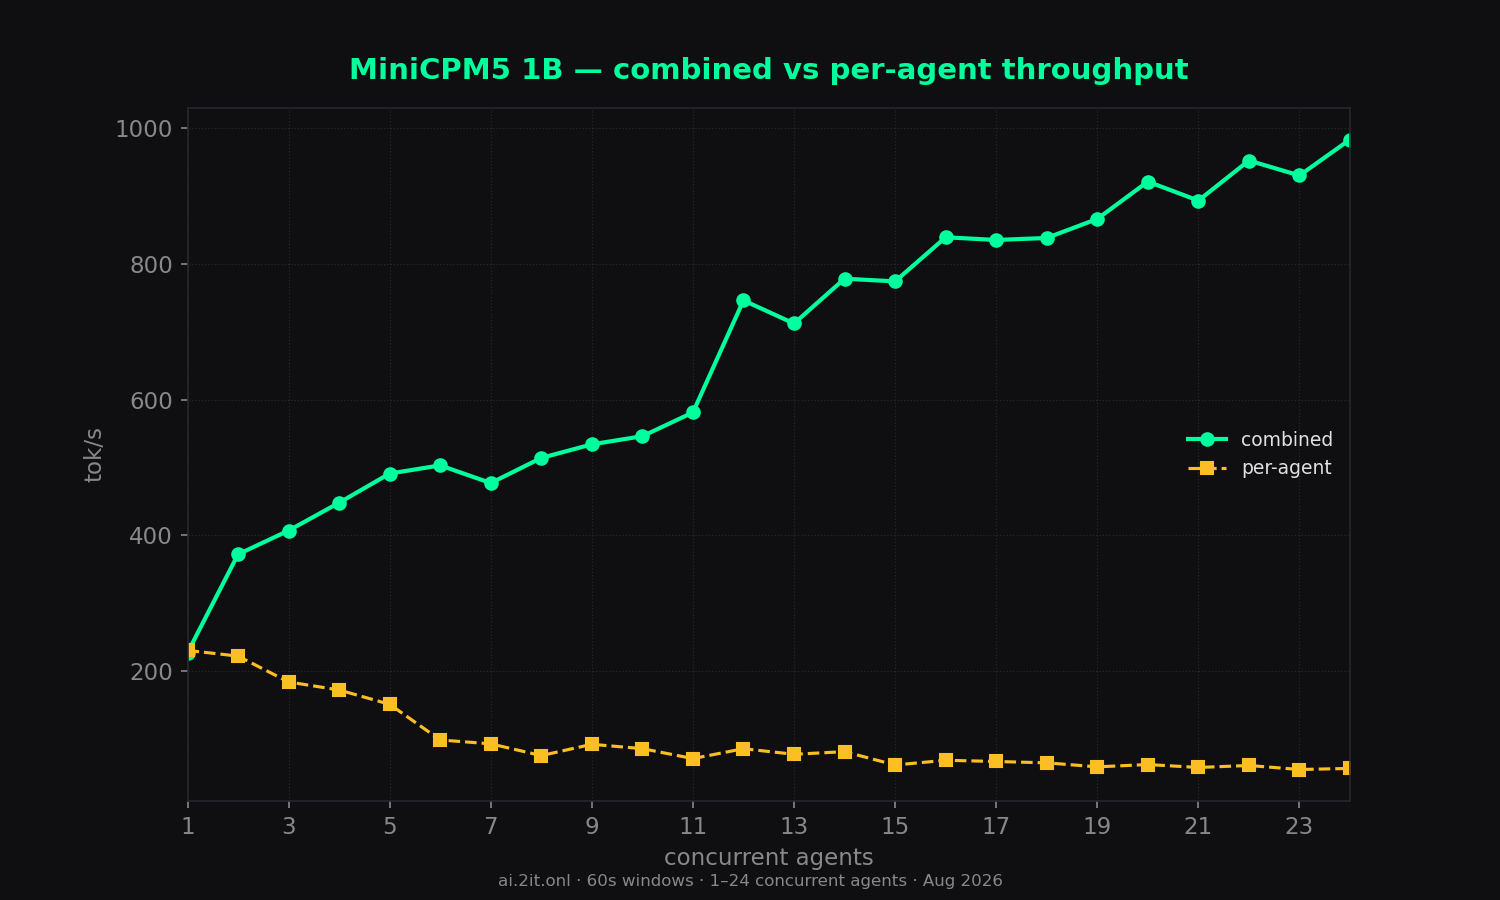
All-in throughput king (983 tok/s) but half its output is hidden reasoning and TTFT climbs to 52s.
Key findings
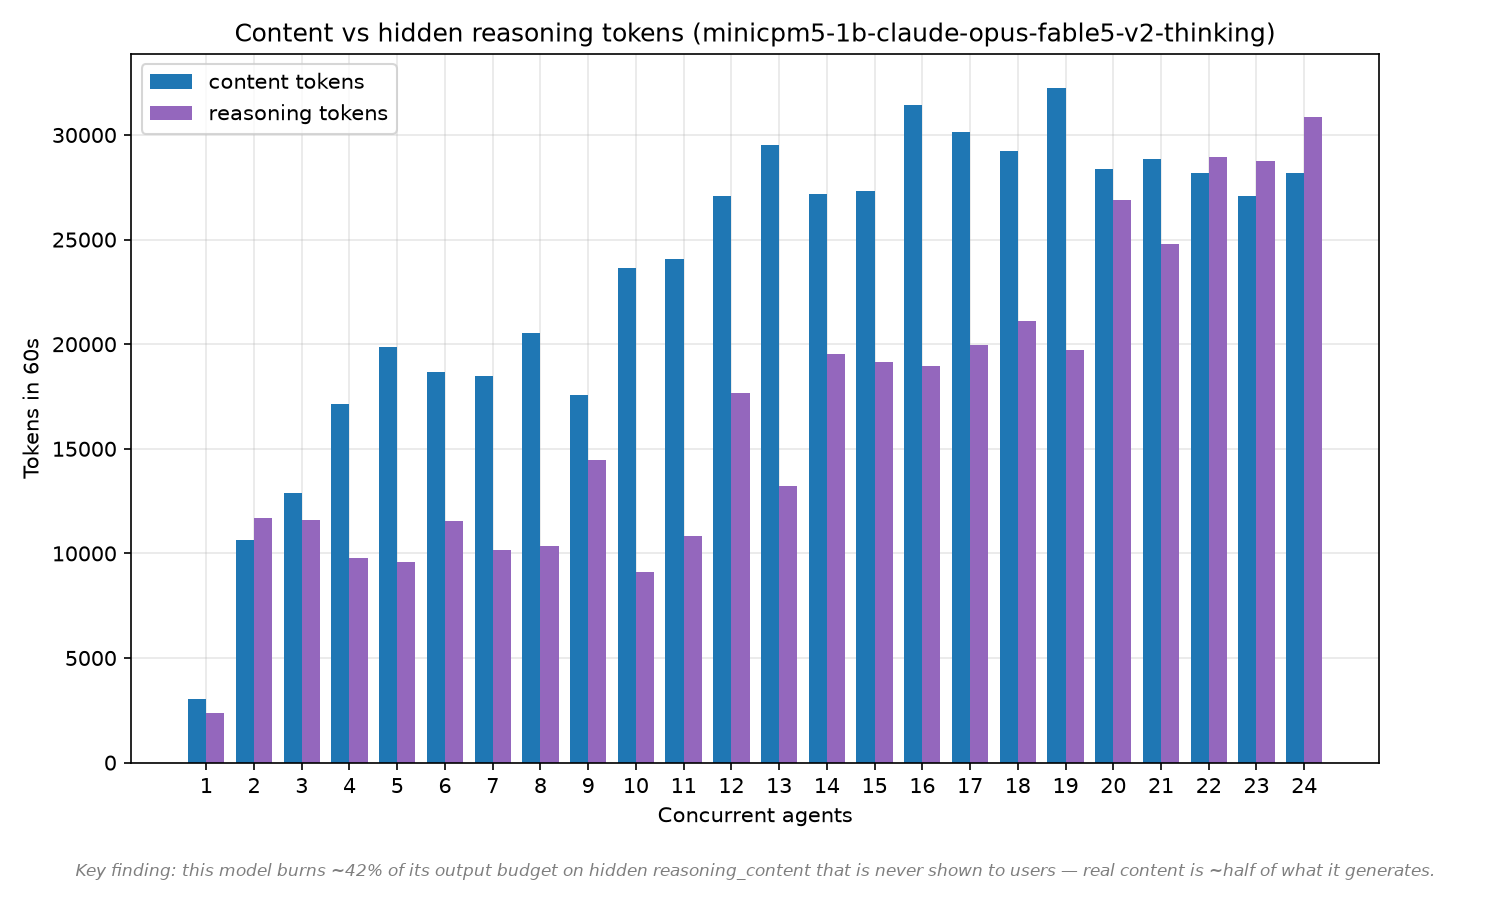
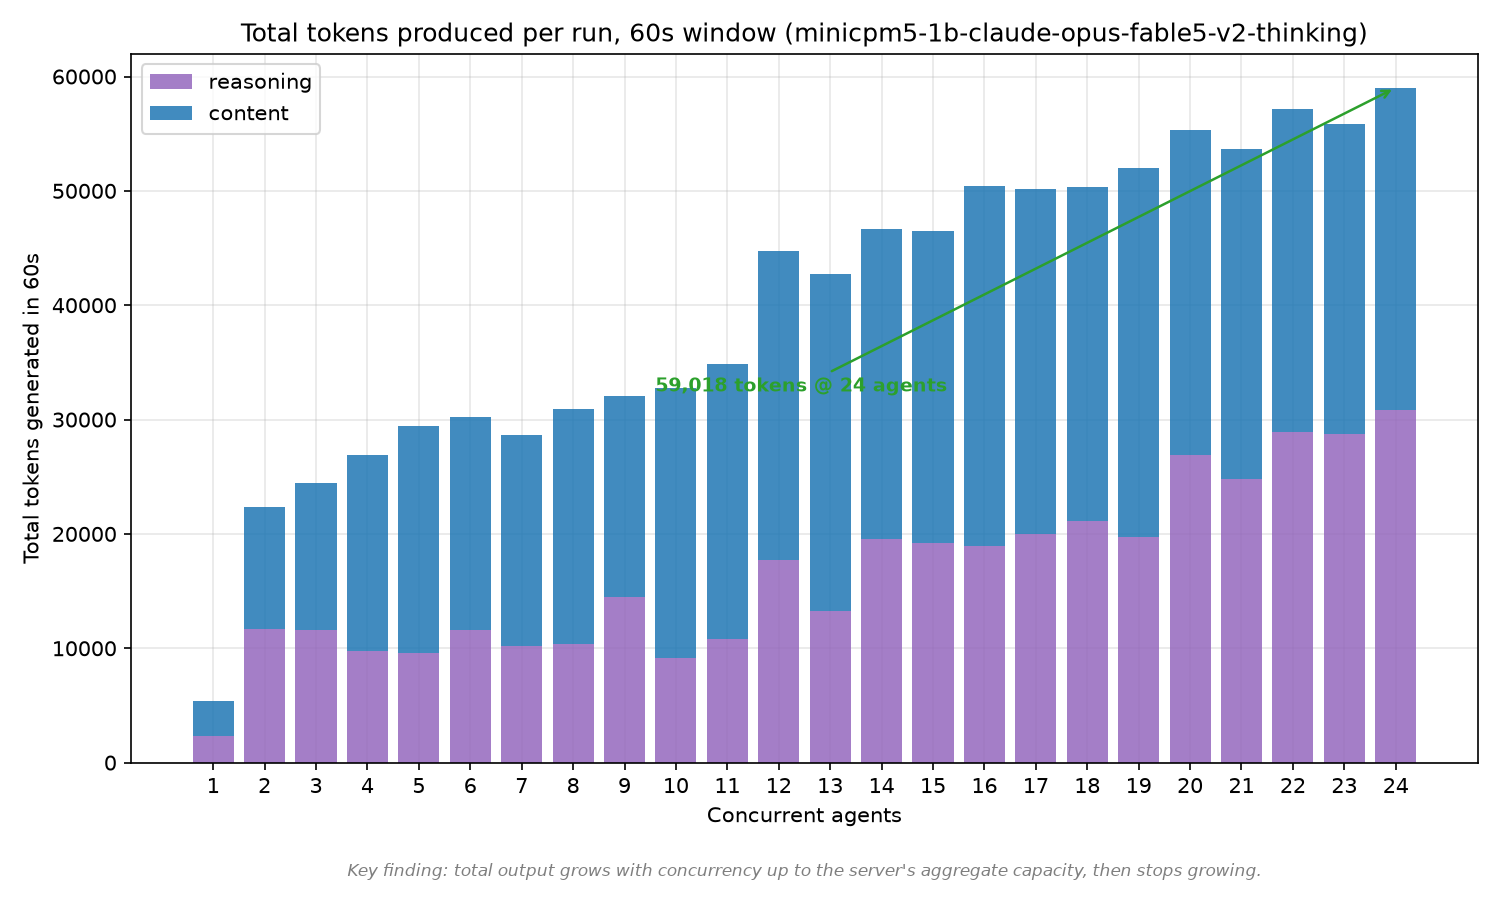
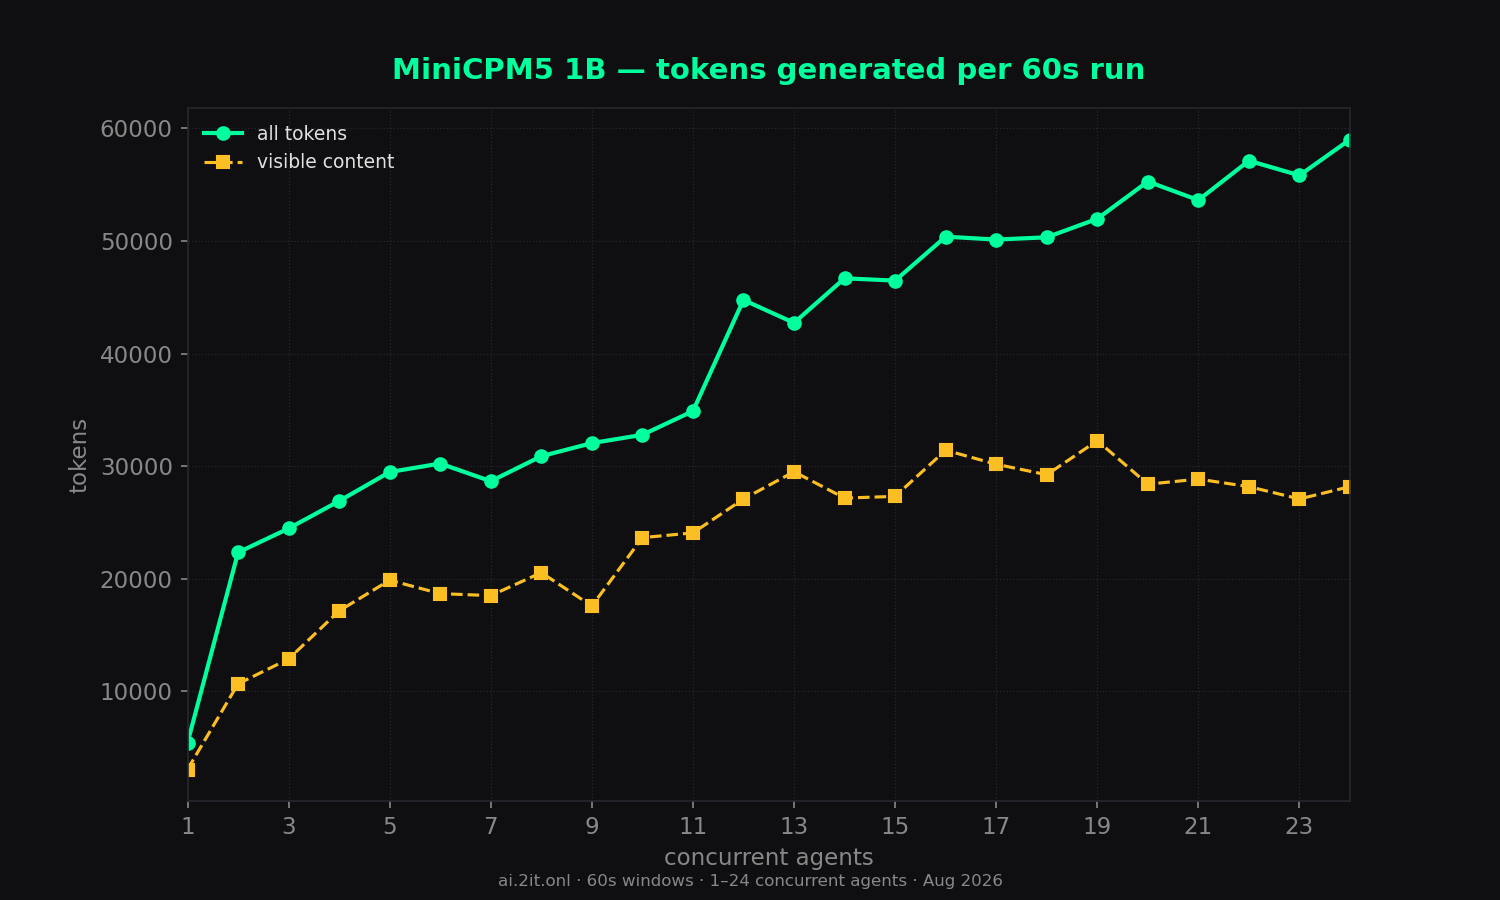
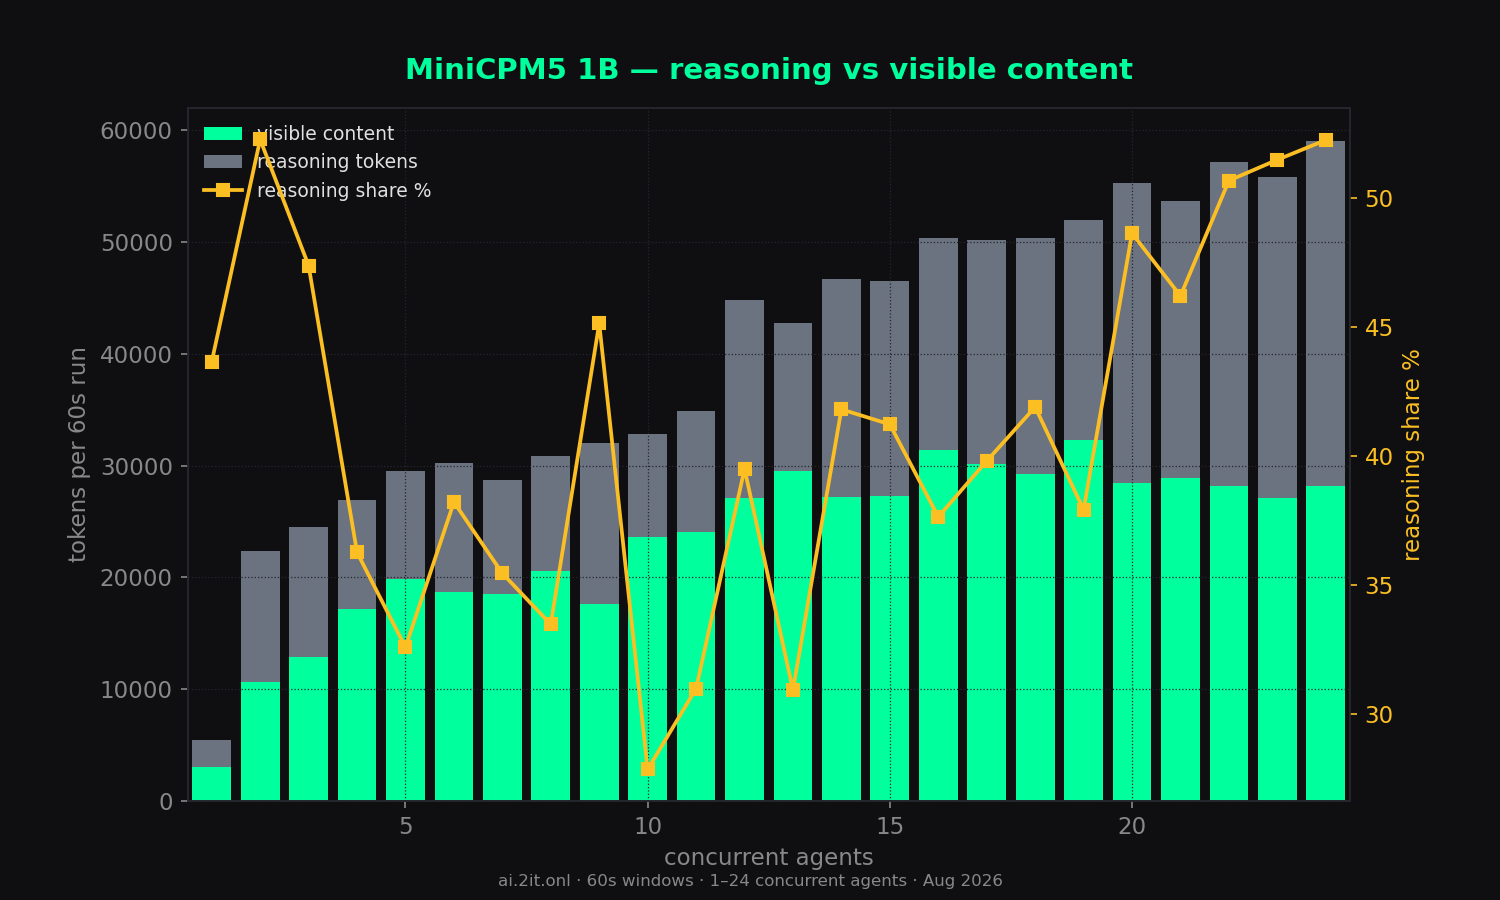
- Reasoning dominates: this "thinking" model spends a large share of its output on hidden reasoning — ~43–52% of all tokens across runs (e.g. 30,838 of 59,018 at 24 agents). Visible content is only about half of what it actually generates.
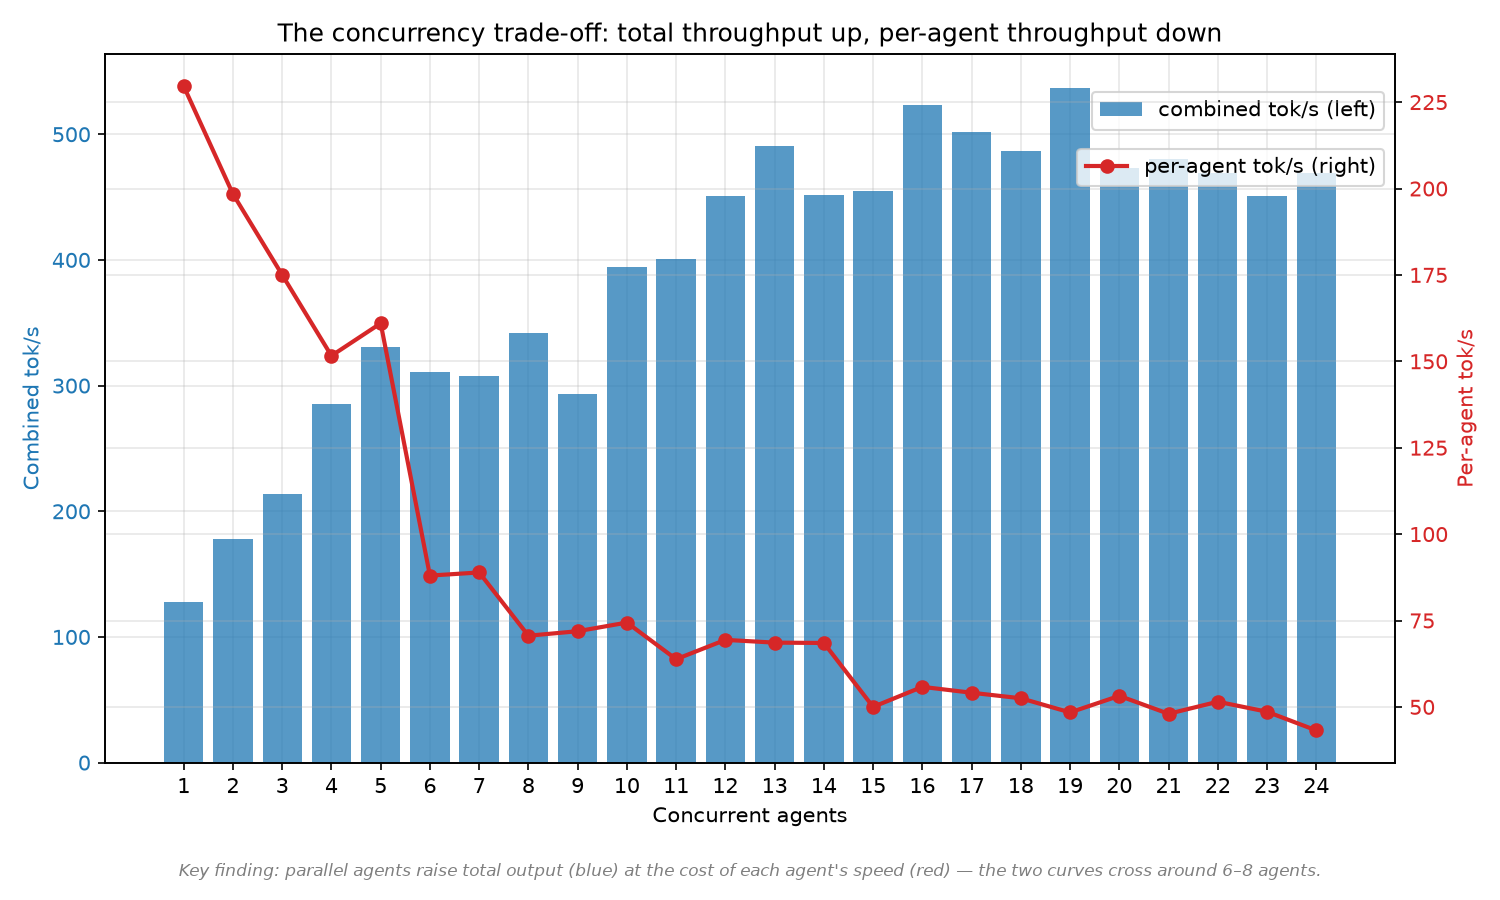
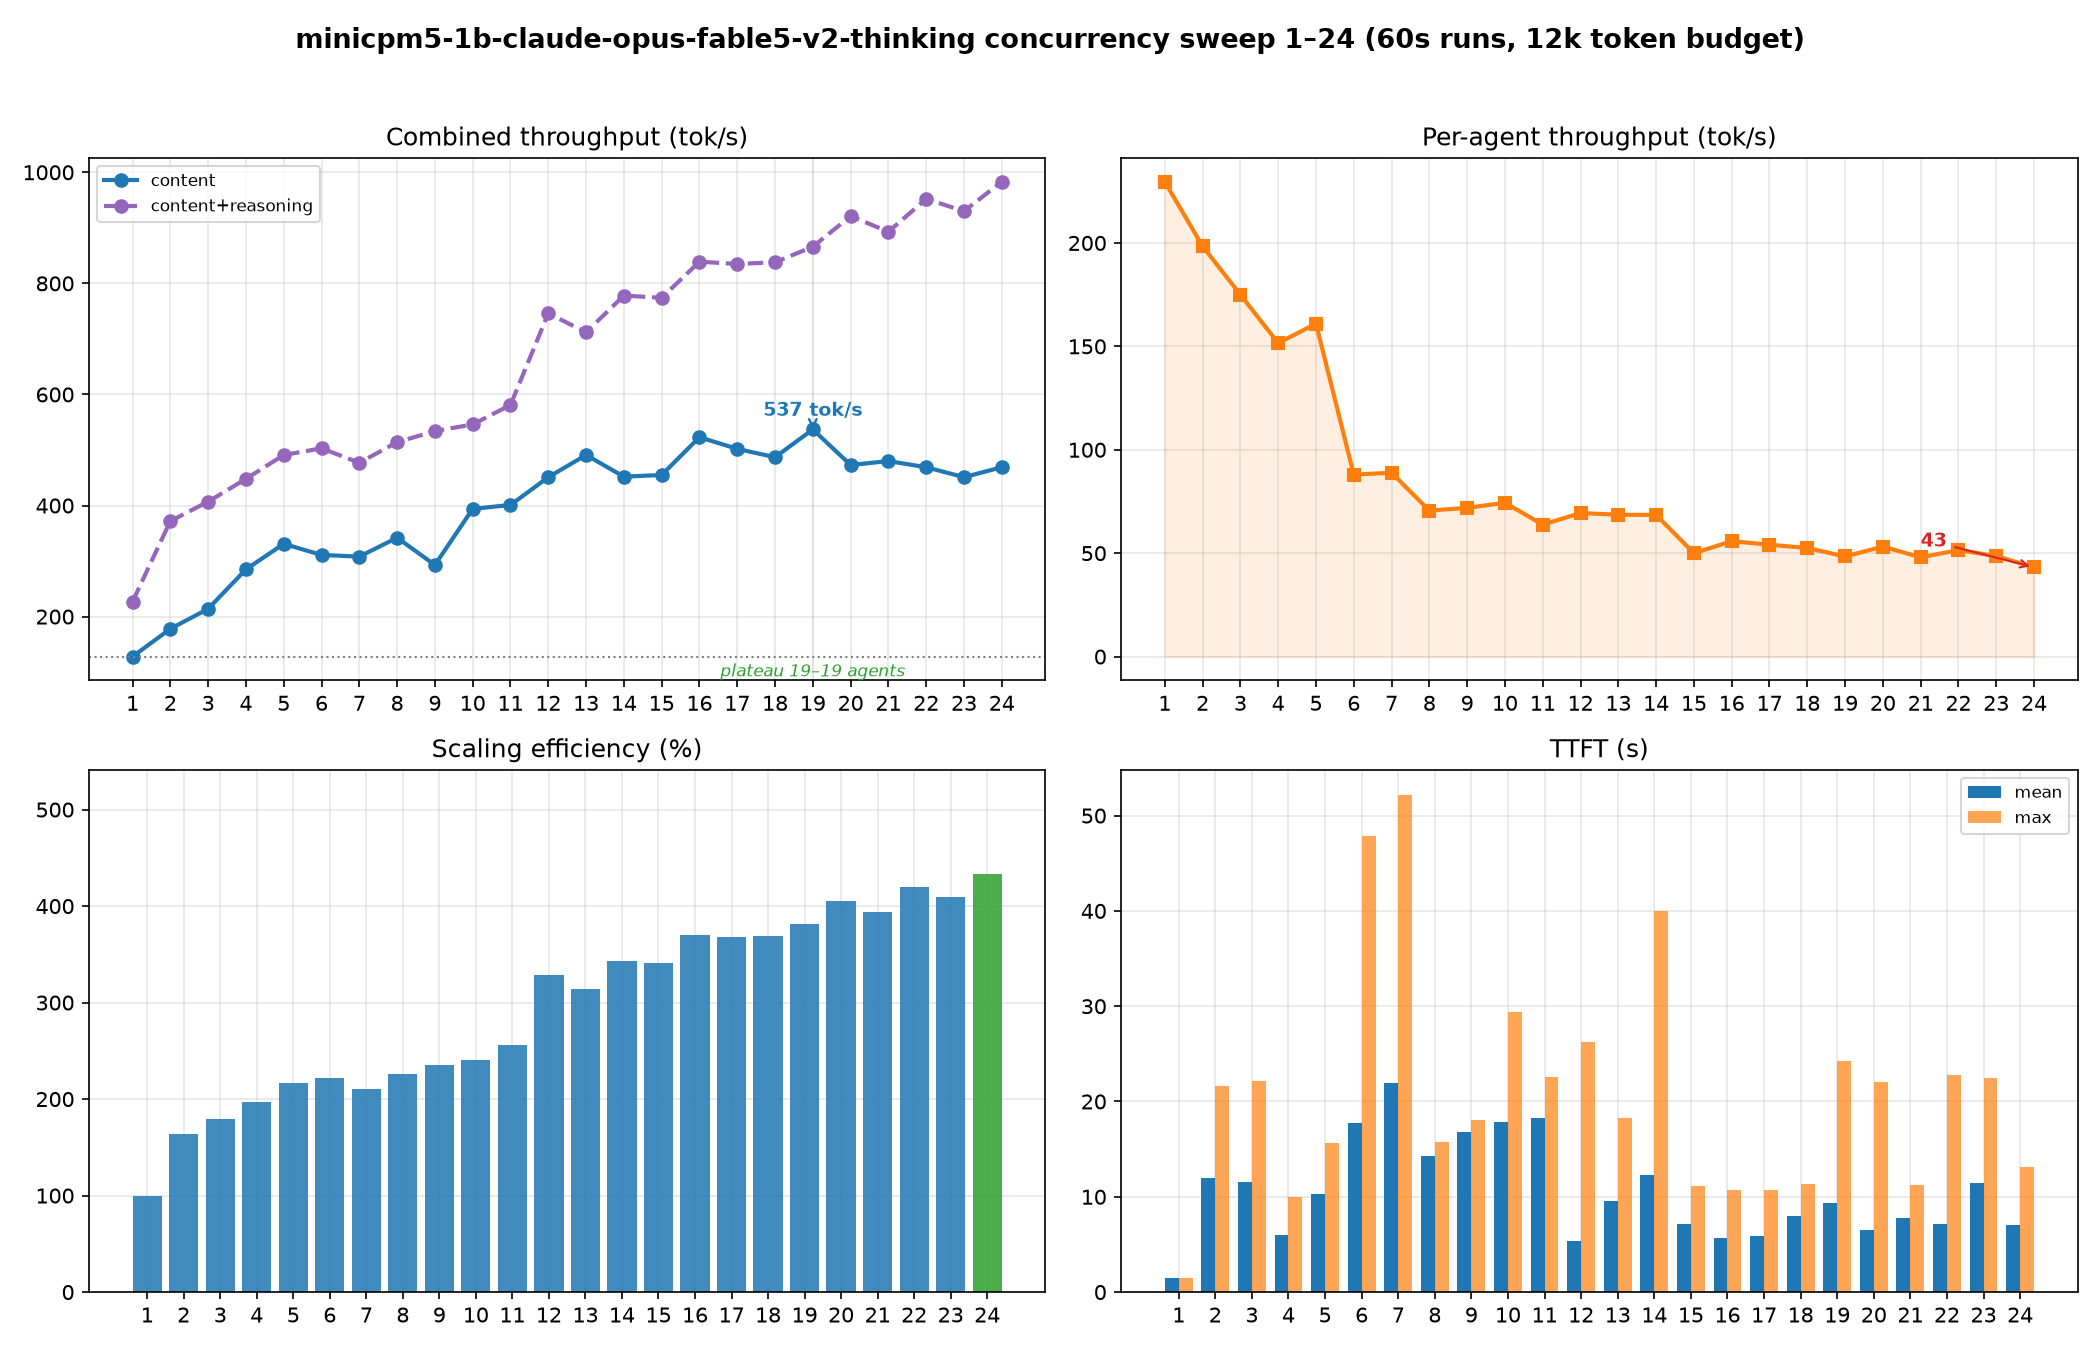
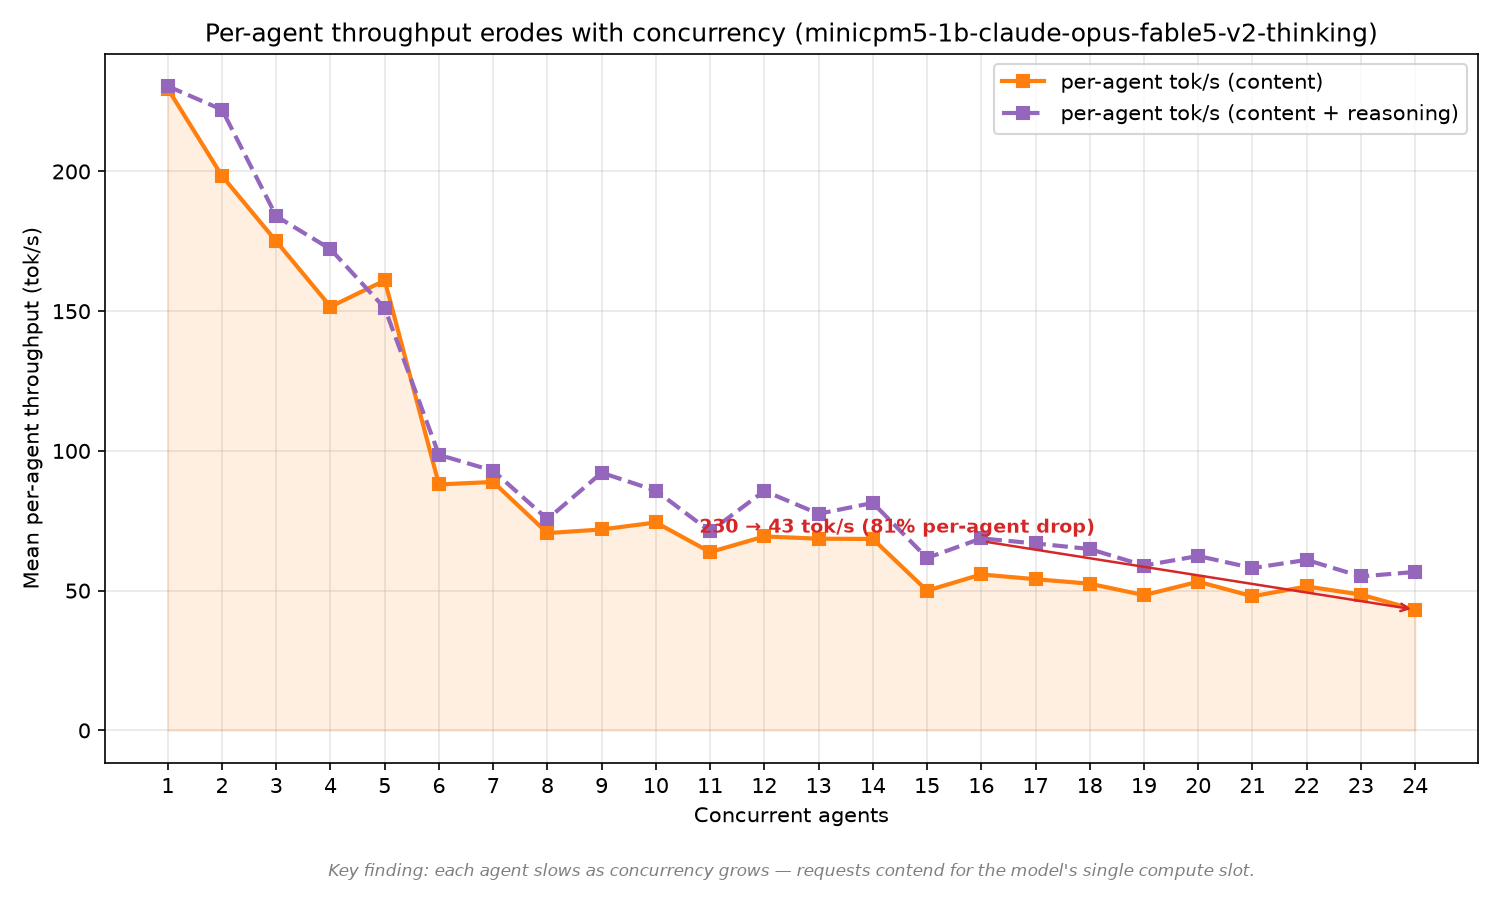
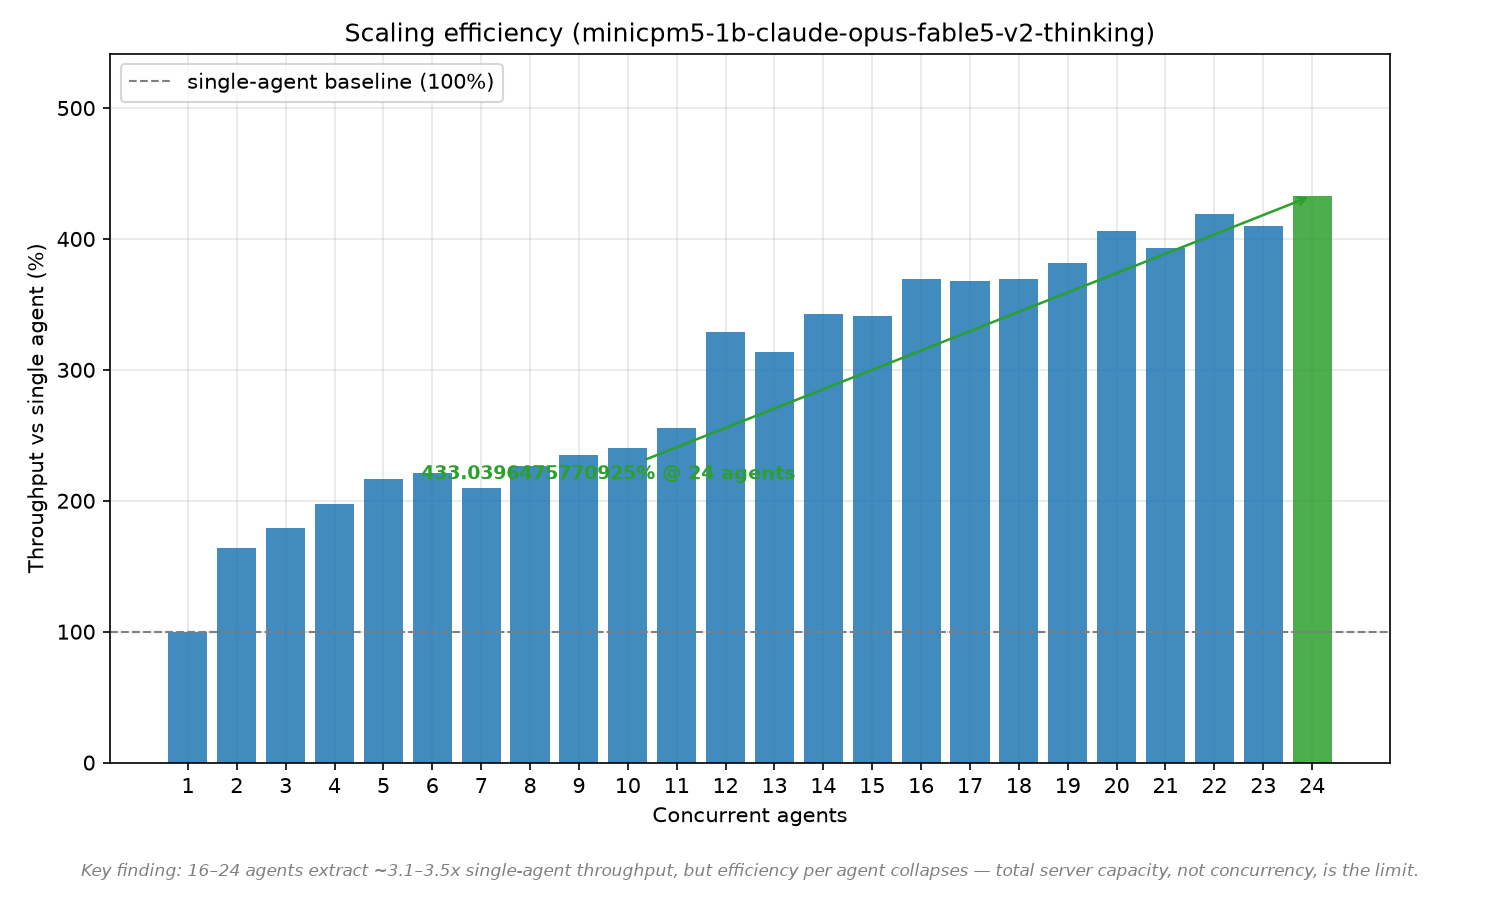
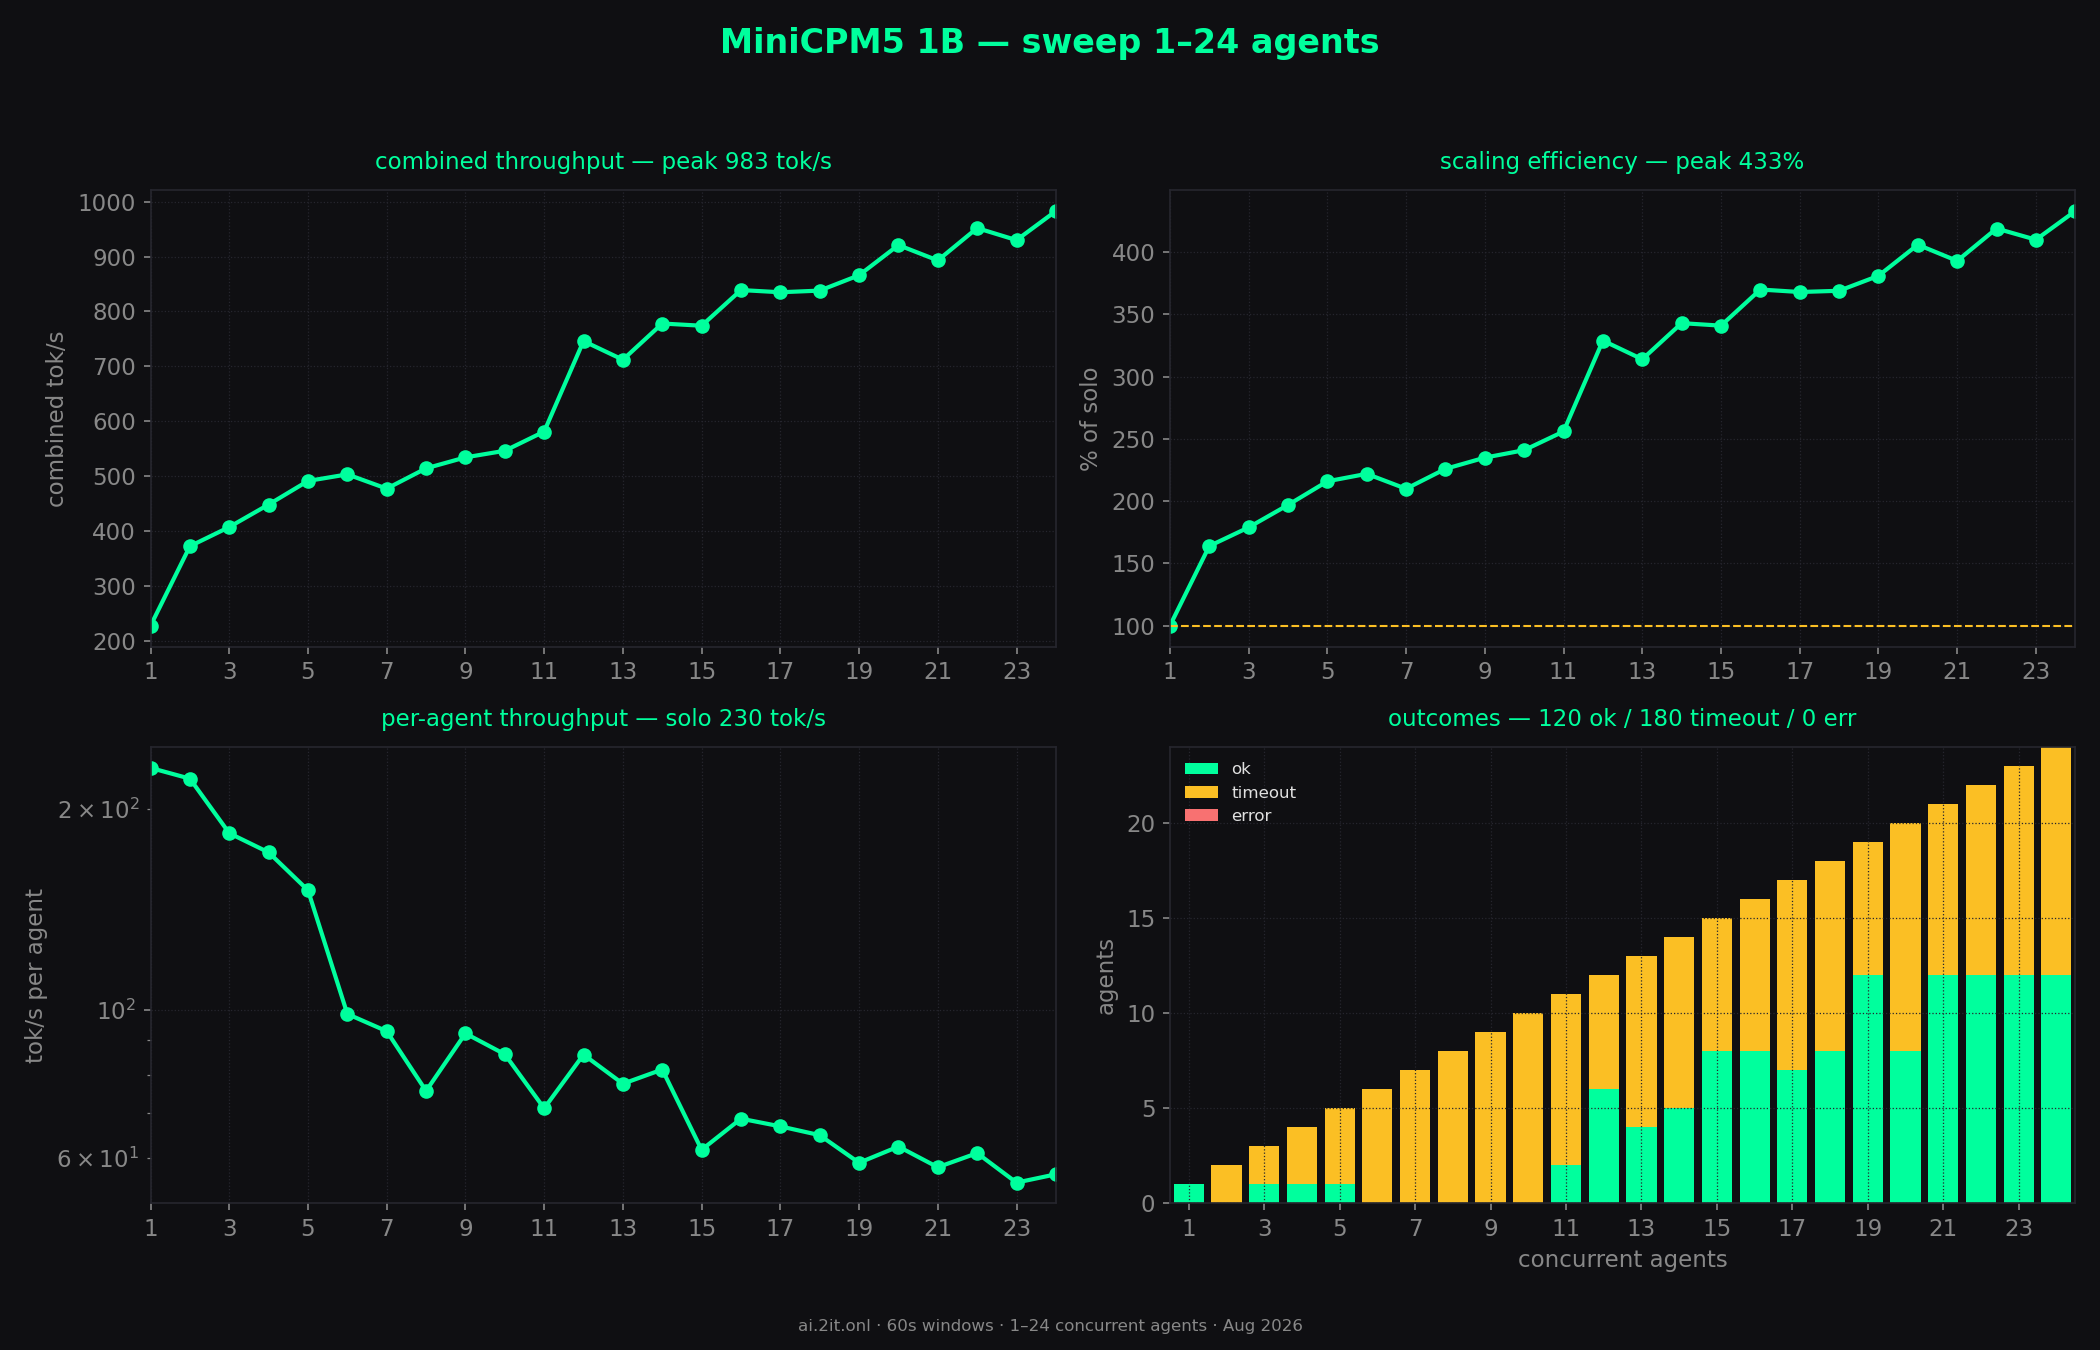
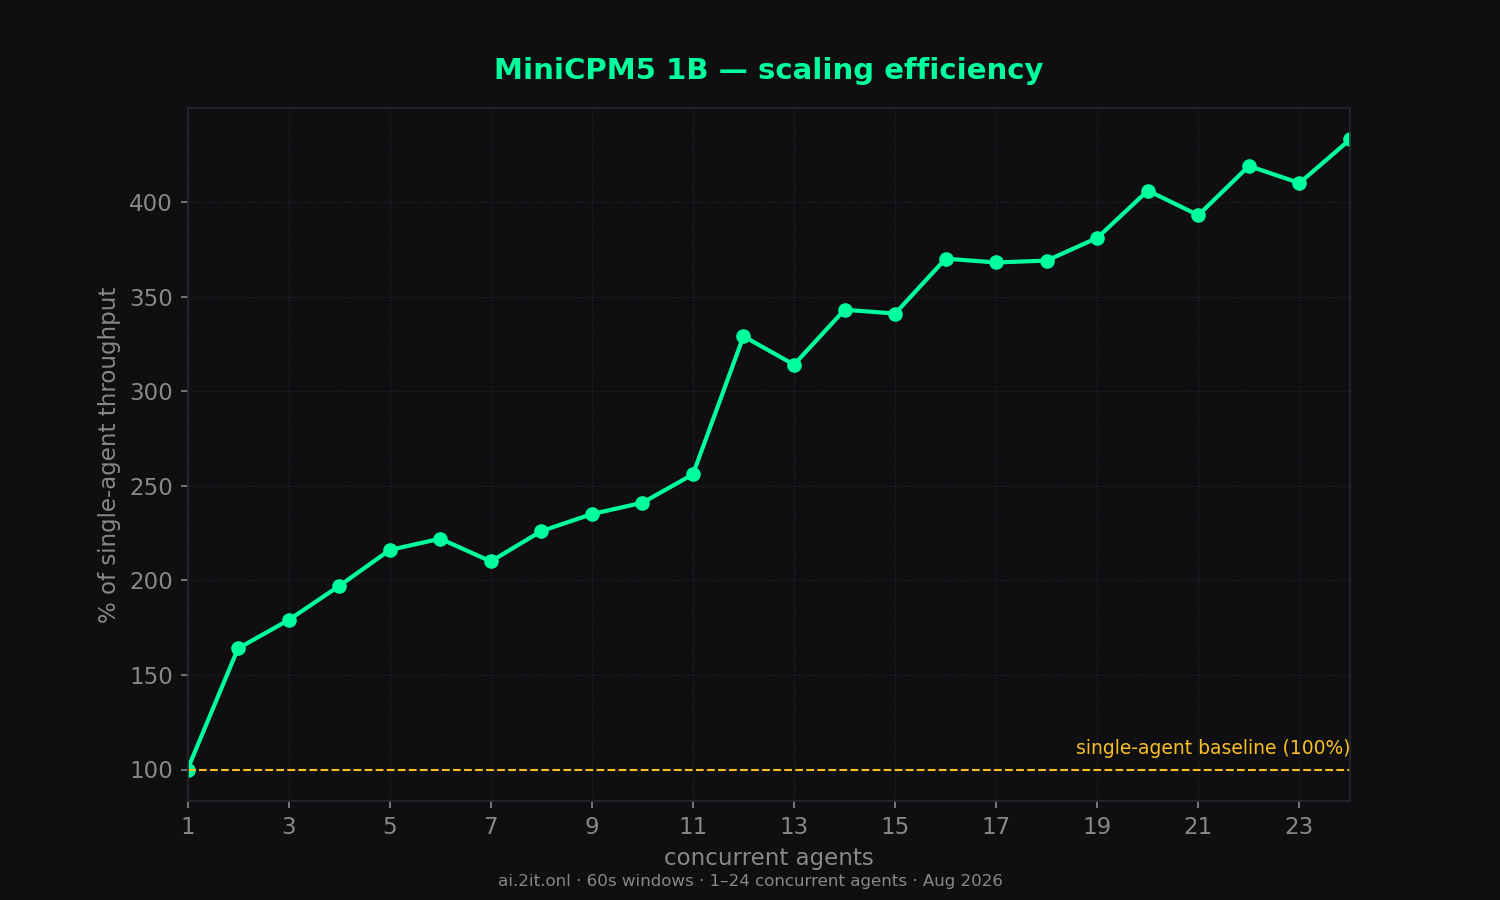
- All-in throughput is high: counting reasoning, combined throughput reaches 983 tok/s at 24 agents (4.3x single-agent) — well above llama-3.2-1b-mini-agent's 652 tok/s. But visible content throughput peaks much lower (~537 tok/s at 19) because of the reasoning overhead.
- Single-agent is slow to start and short: the concurrency-1 run finished in ~24s (agent ended naturally) at 128 content / 227 all tok/s — slower than the non-thinking model's 196 tok/s.
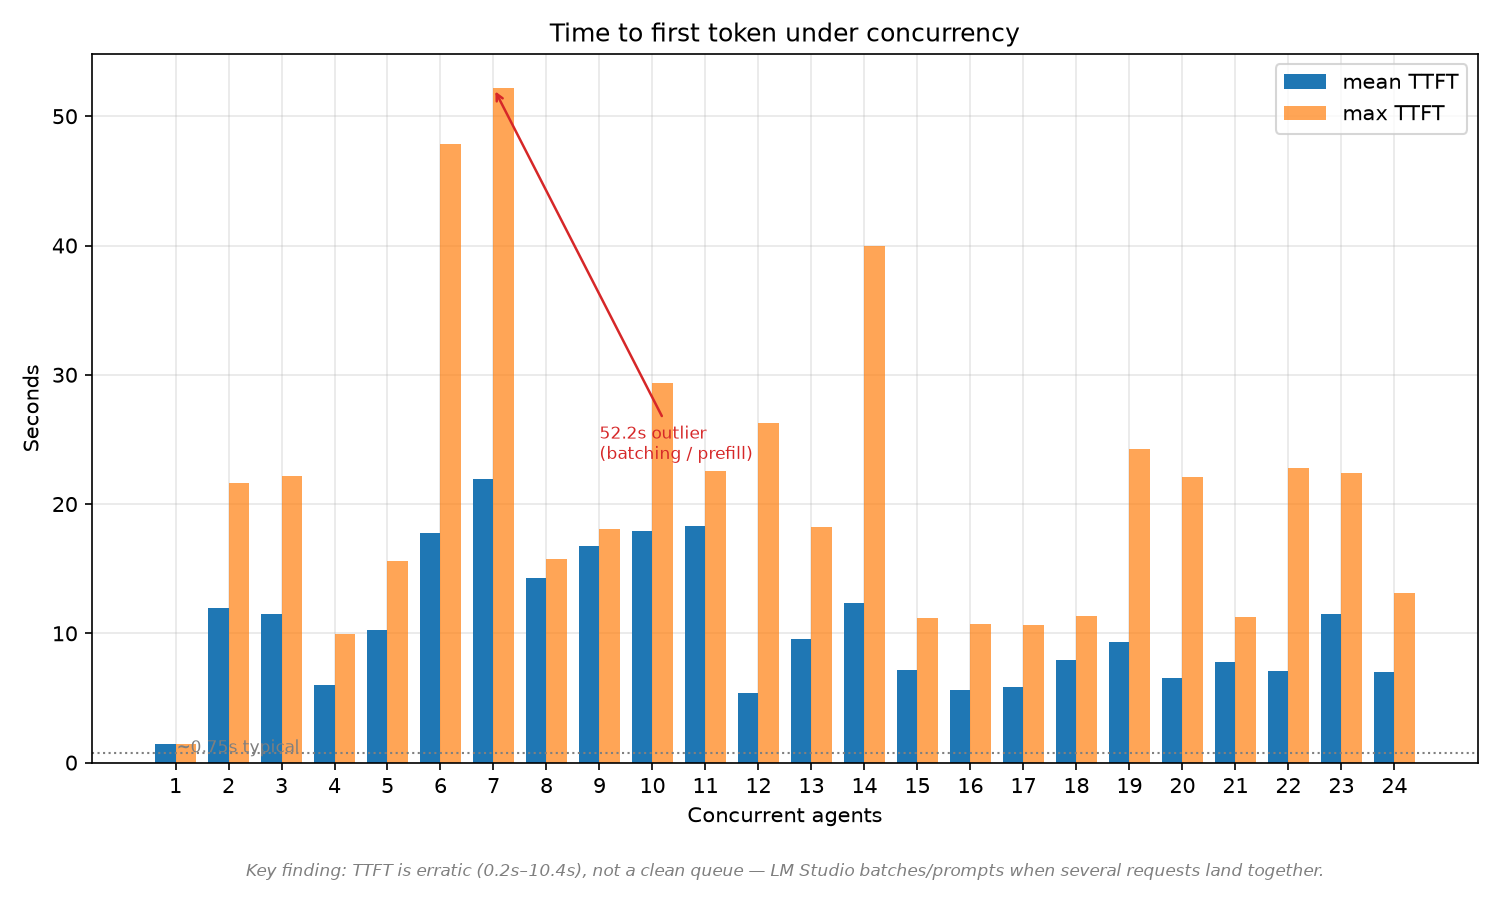
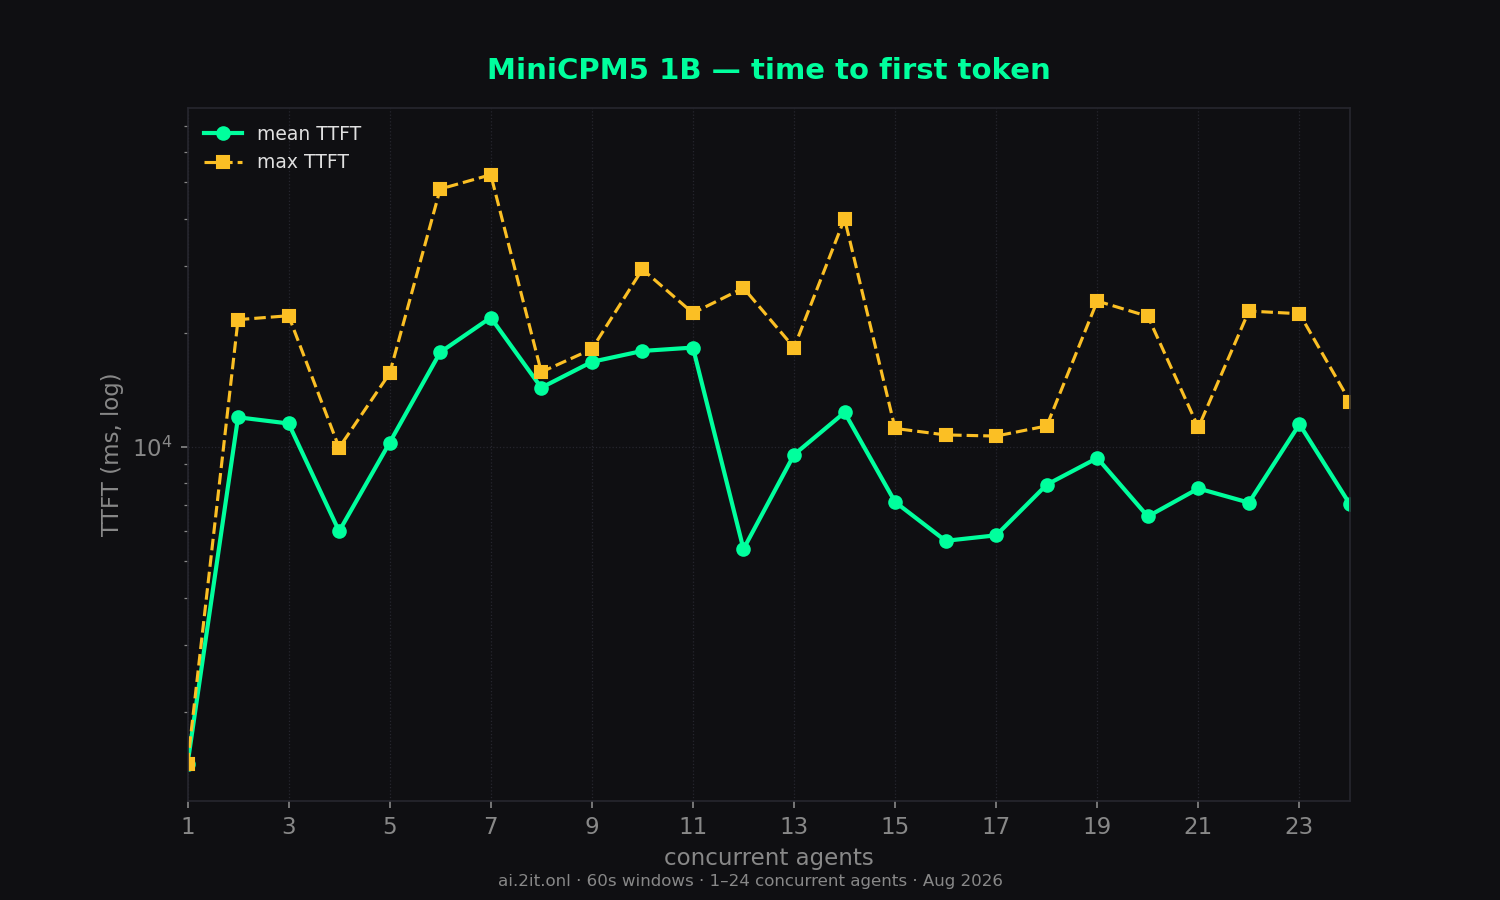
- TTFT is the weak point: 1.5s–52s across the sweep (mean usually 6–18s under load) — the reasoning prefill dominates first-token latency. Not suitable for latency-critical controllers at high concurrency.
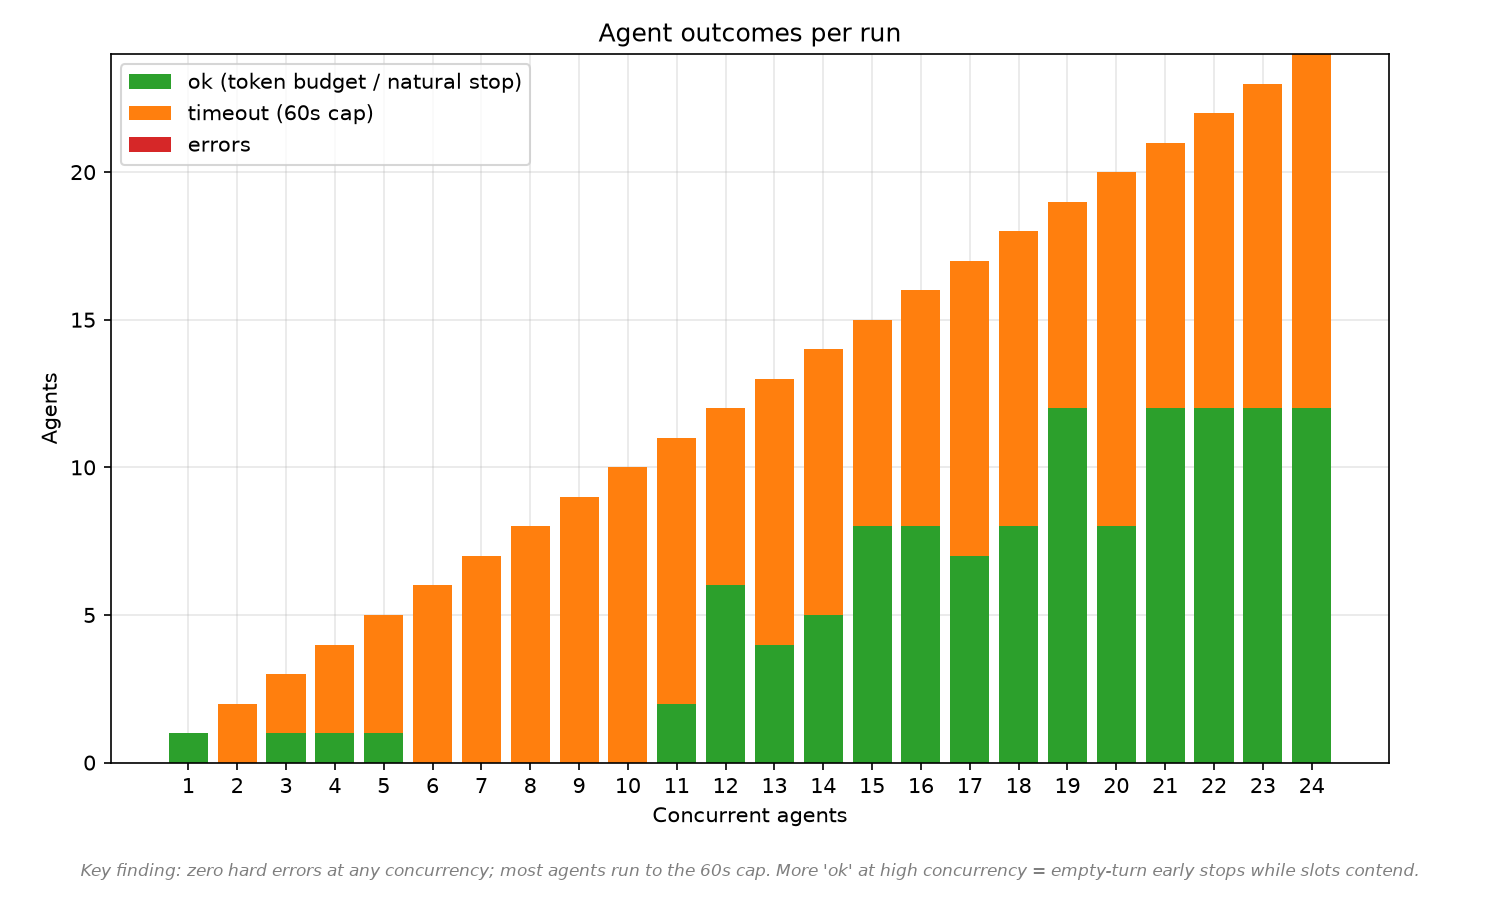
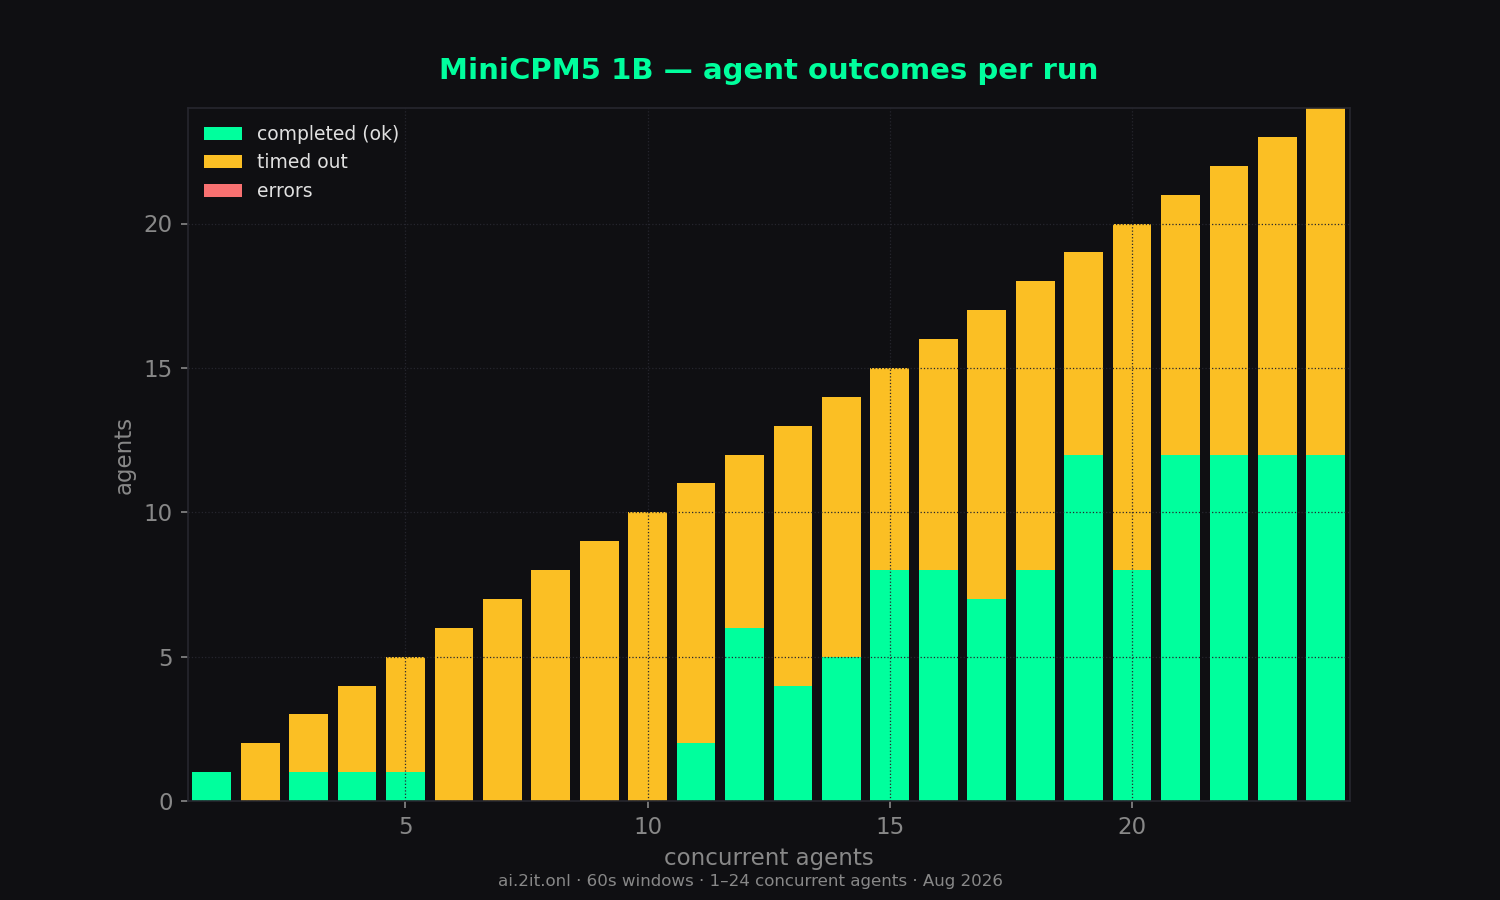
- Errors: 0 across all 24 runs.
Sweep — total concurrency 1–24
| agents | wall (s) | content | reason | total | comb tok/s | comb all | per-agent | per-agent all | scale % | TTFT mean | TTFT max | ok | timeout | err |
|---|---|---|---|---|---|---|---|---|---|---|---|---|---|---|
| 1 | 23.9 | 3,049 | 2,363 | 5,412 | 128 | 227 | 229.6 | 230.5 | 100% | 1.5s | 1.5s | 1 | 0 | 0 |
| 2 | 60.0 | 10,658 | 11,673 | 22,331 | 178 | 372 | 198.4 | 222.1 | 164% | 12.0s | 21.6s | 0 | 2 | 0 |
| 3 | 60.0 | 12,869 | 11,592 | 24,461 | 214 | 407 | 175.0 | 184.0 | 179% | 11.5s | 22.2s | 1 | 2 | 0 |
| 4 | 60.0 | 17,141 | 9,759 | 26,900 | 285 | 448 | 151.6 | 172.2 | 197% | 6.0s | 9.9s | 1 | 3 | 0 |
| 5 | 60.0 | 19,867 | 9,610 | 29,477 | 331 | 491 | 161.0 | 151.1 | 216% | 10.3s | 15.6s | 1 | 4 | 0 |
| 6 | 60.0 | 18,674 | 11,556 | 30,230 | 311 | 503 | 88.0 | 98.6 | 222% | 17.8s | 47.9s | 0 | 6 | 0 |
| 7 | 60.0 | 18,497 | 10,165 | 28,662 | 308 | 477 | 88.9 | 92.9 | 210% | 21.9s | 52.2s | 0 | 7 | 0 |
| 8 | 60.0 | 20,539 | 10,343 | 30,882 | 342 | 514 | 70.6 | 75.6 | 226% | 14.3s | 15.7s | 0 | 8 | 0 |
| 9 | 60.0 | 17,577 | 14,467 | 32,044 | 293 | 534 | 71.9 | 92.2 | 235% | 16.8s | 18.1s | 0 | 9 | 0 |
| 10 | 60.0 | 23,646 | 9,135 | 32,781 | 394 | 546 | 74.4 | 85.8 | 241% | 17.9s | 29.4s | 0 | 10 | 0 |
| 11 | 60.0 | 24,071 | 10,816 | 34,887 | 401 | 581 | 63.8 | 71.2 | 256% | 18.3s | 22.5s | 2 | 9 | 0 |
| 12 | 60.0 | 27,078 | 17,687 | 44,765 | 451 | 746 | 69.4 | 85.7 | 329% | 5.4s | 26.2s | 6 | 6 | 0 |
| 13 | 60.0 | 29,505 | 13,223 | 42,728 | 491 | 712 | 68.6 | 77.5 | 314% | 9.5s | 18.3s | 4 | 9 | 0 |
| 14 | 60.0 | 27,163 | 19,524 | 46,687 | 452 | 778 | 68.5 | 81.4 | 343% | 12.3s | 40.0s | 5 | 9 | 0 |
| 15 | 60.0 | 27,313 | 19,168 | 46,481 | 455 | 774 | 50.0 | 61.7 | 341% | 7.1s | 11.2s | 8 | 7 | 0 |
| 16 | 60.0 | 31,414 | 18,972 | 50,386 | 523 | 839 | 55.8 | 68.7 | 370% | 5.6s | 10.7s | 8 | 8 | 0 |
| 17 | 60.0 | 30,167 | 19,960 | 50,127 | 502 | 835 | 54.1 | 66.9 | 368% | 5.8s | 10.7s | 7 | 10 | 0 |
| 18 | 60.0 | 29,237 | 21,092 | 50,329 | 487 | 838 | 52.5 | 64.9 | 369% | 7.9s | 11.3s | 8 | 10 | 0 |
| 19 | 60.0 | 32,259 | 19,714 | 51,973 | 537 | 866 | 48.4 | 59.0 | 381% | 9.3s | 24.2s | 12 | 7 | 0 |
| 20 | 60.1 | 28,395 | 26,889 | 55,284 | 473 | 921 | 53.2 | 62.4 | 406% | 6.5s | 22.1s | 8 | 12 | 0 |
| 21 | 60.0 | 28,847 | 24,785 | 53,632 | 480 | 893 | 48.0 | 58.1 | 393% | 7.8s | 11.2s | 12 | 9 | 0 |
| 22 | 60.0 | 28,178 | 28,955 | 57,133 | 469 | 952 | 51.5 | 61.0 | 419% | 7.1s | 22.8s | 12 | 10 | 0 |
| 23 | 60.0 | 27,084 | 28,745 | 55,829 | 451 | 930 | 48.6 | 55.1 | 410% | 11.5s | 22.4s | 12 | 11 | 0 |
| 24 peak | 60.0 | 28,180 | 30,838 | 59,018 | 469 | 983 | 43.2 | 56.7 | 433% | 7.0s | 13.2s | 12 | 12 | 0 |
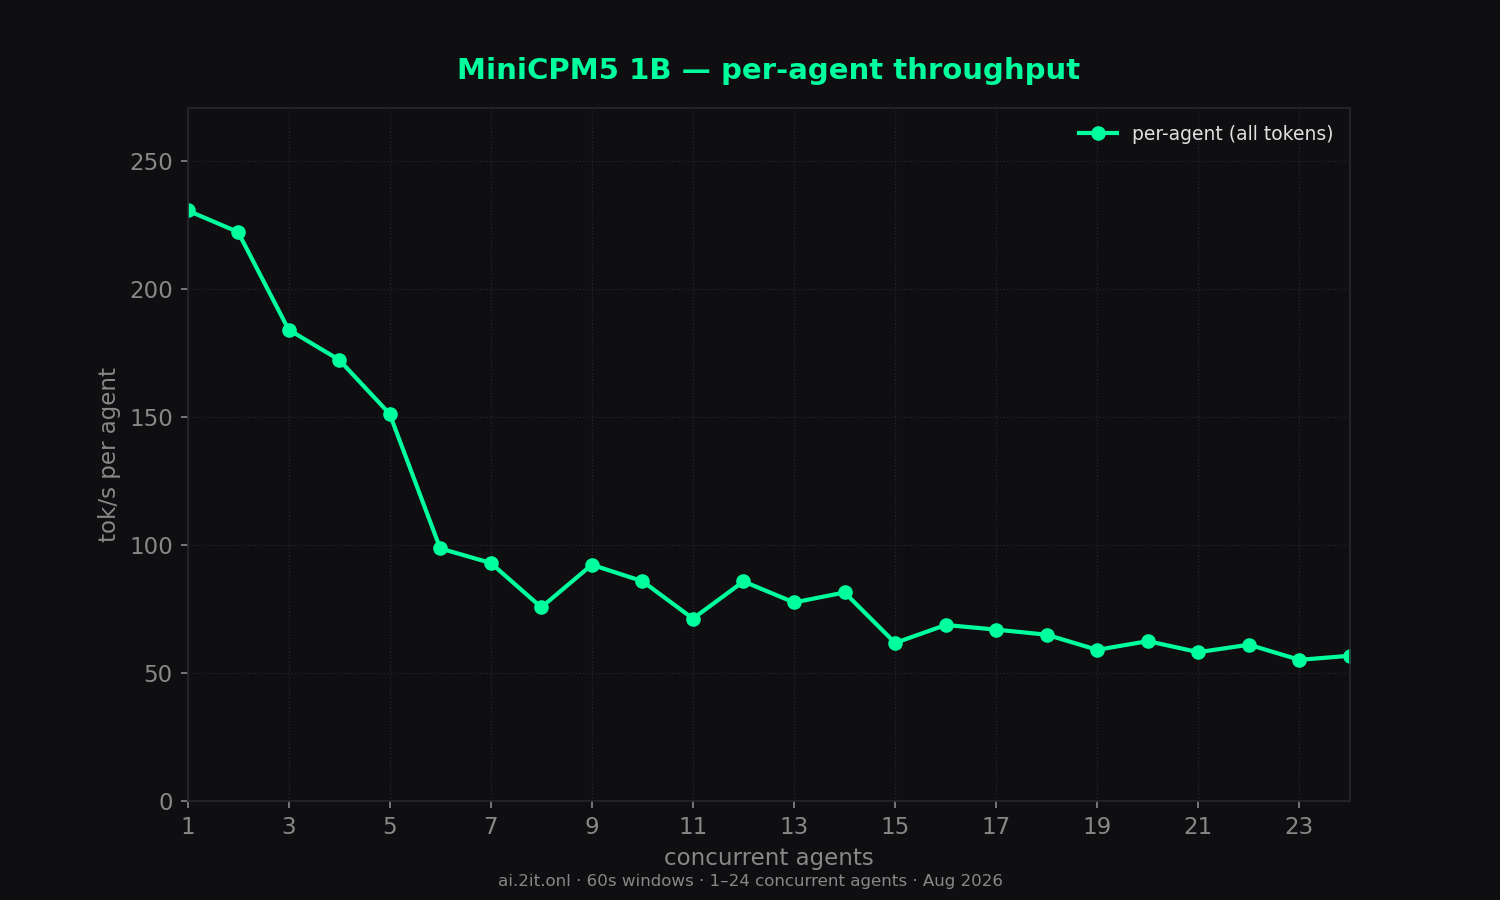
* burst artifact — agents queued ~11–16s then generated in a short burst; the per-agent timer inflates the number. Trust combined throughput and TTFT columns. Peak row = highest combined (all-token) throughput.
Charts
Raw data & downloads
- report.md6 KB
- sweep-summary.csv3 KB
- sweep-summary.json11 KB
- combined_throughput.png133 KB · original matplotlib export
- combined_vs_per_agent.png101 KB · original matplotlib export
- dashboard_1_24.png171 KB · original matplotlib export
- outcome_breakdown.png57 KB · original matplotlib export
- per_agent_throughput.png116 KB · original matplotlib export
- reasoning_vs_content.png65 KB · original matplotlib export
- scaling_efficiency.png85 KB · original matplotlib export
- time_to_first_token.png66 KB · original matplotlib export
- total_tokens_generated.png80 KB · original matplotlib export