Llama 3.2 1B Mini-Agent
server model id:
llama-3.2-1b-mini-agentnon-thinkingKV F16ctx 32k1B params
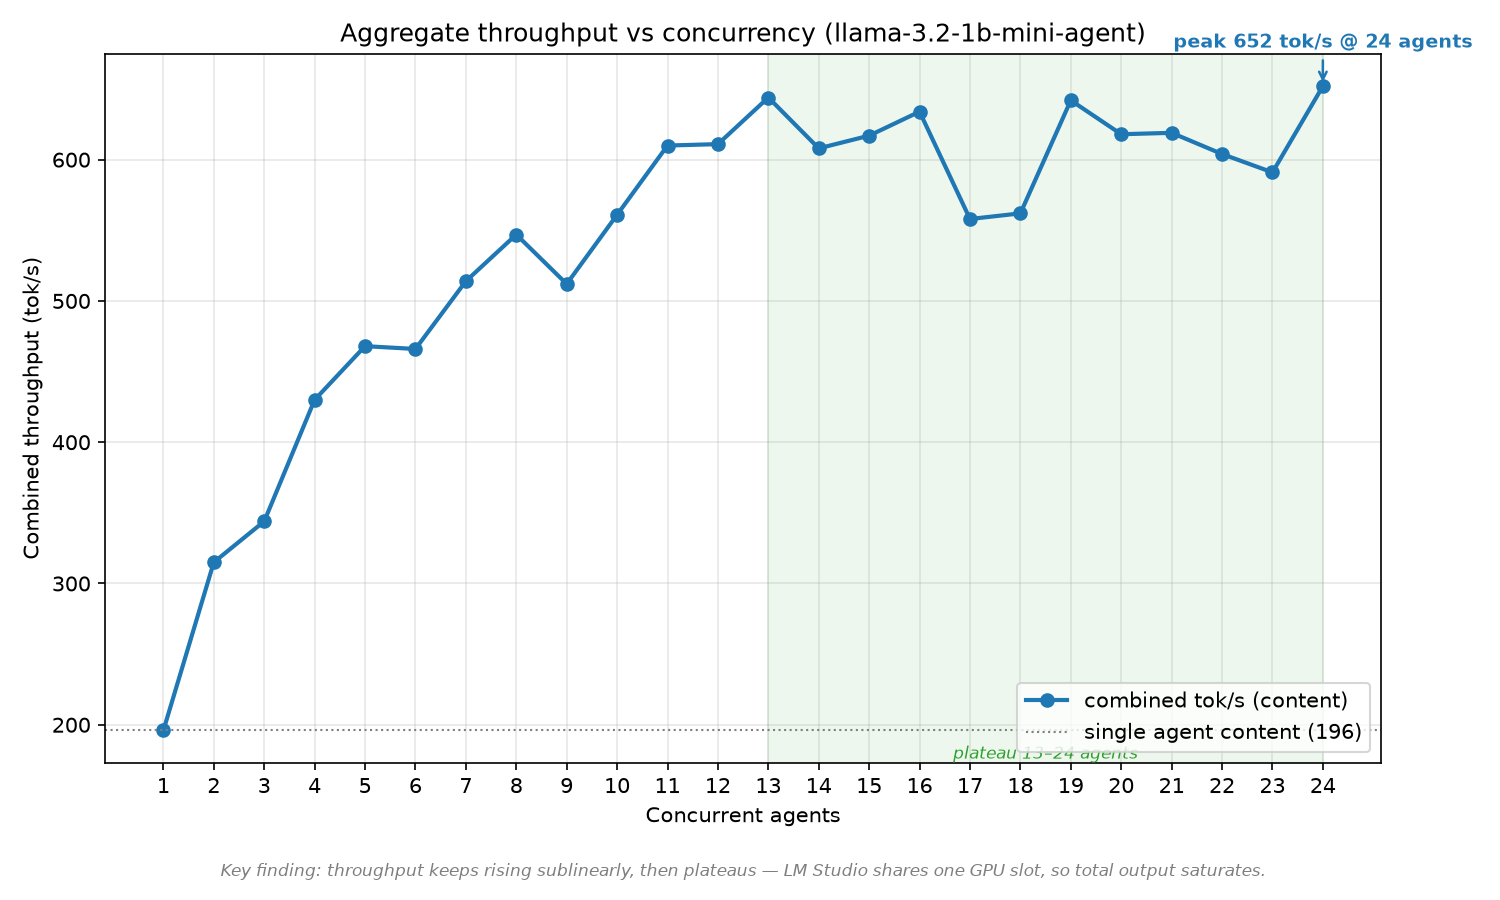
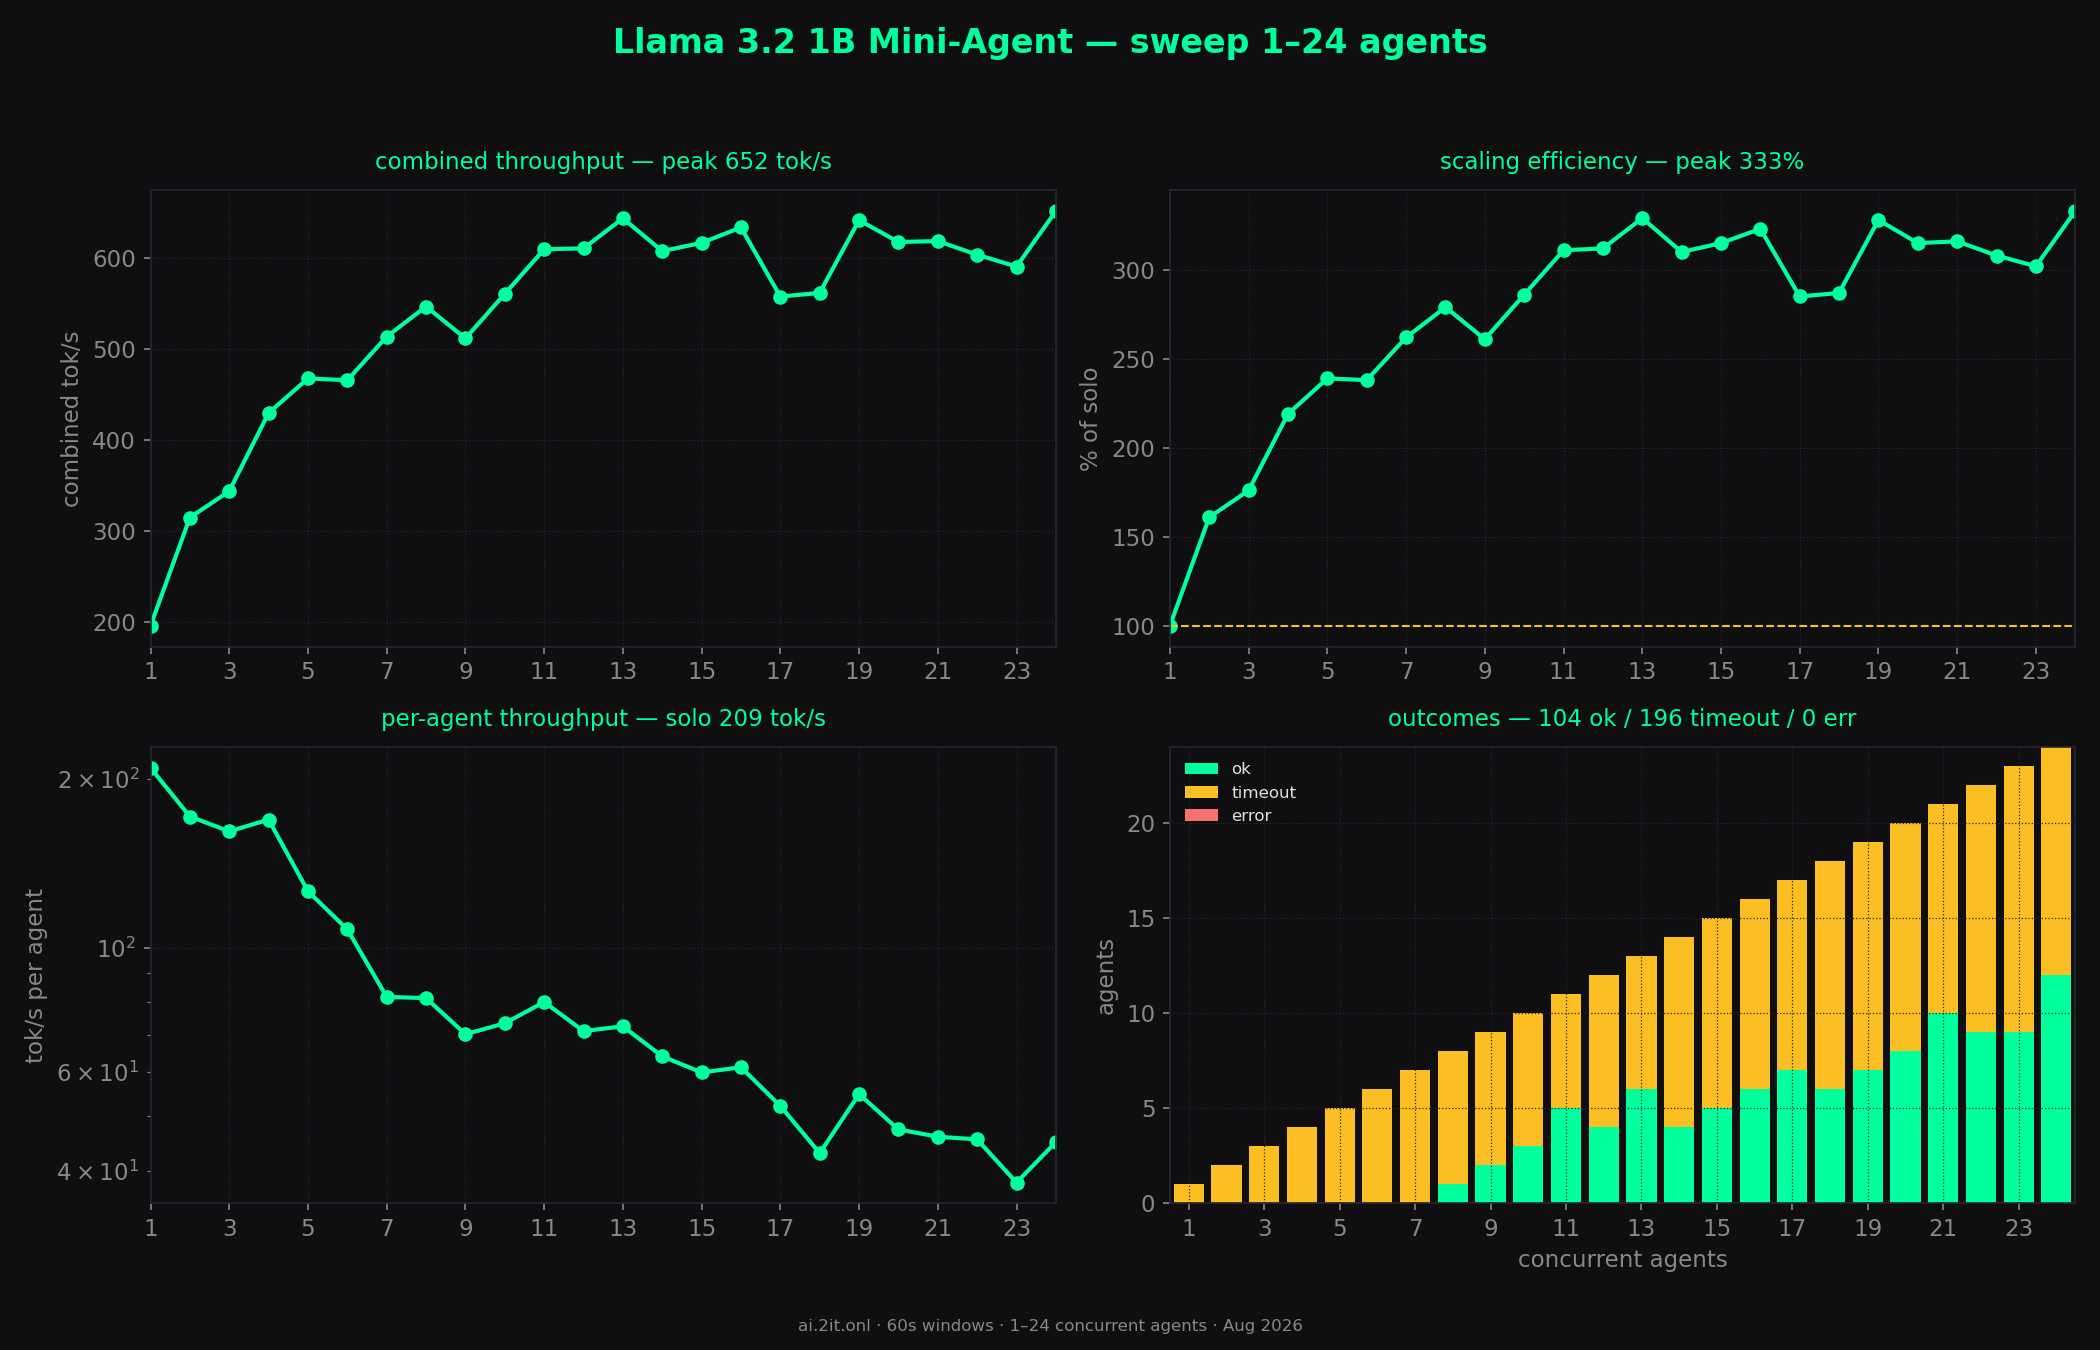
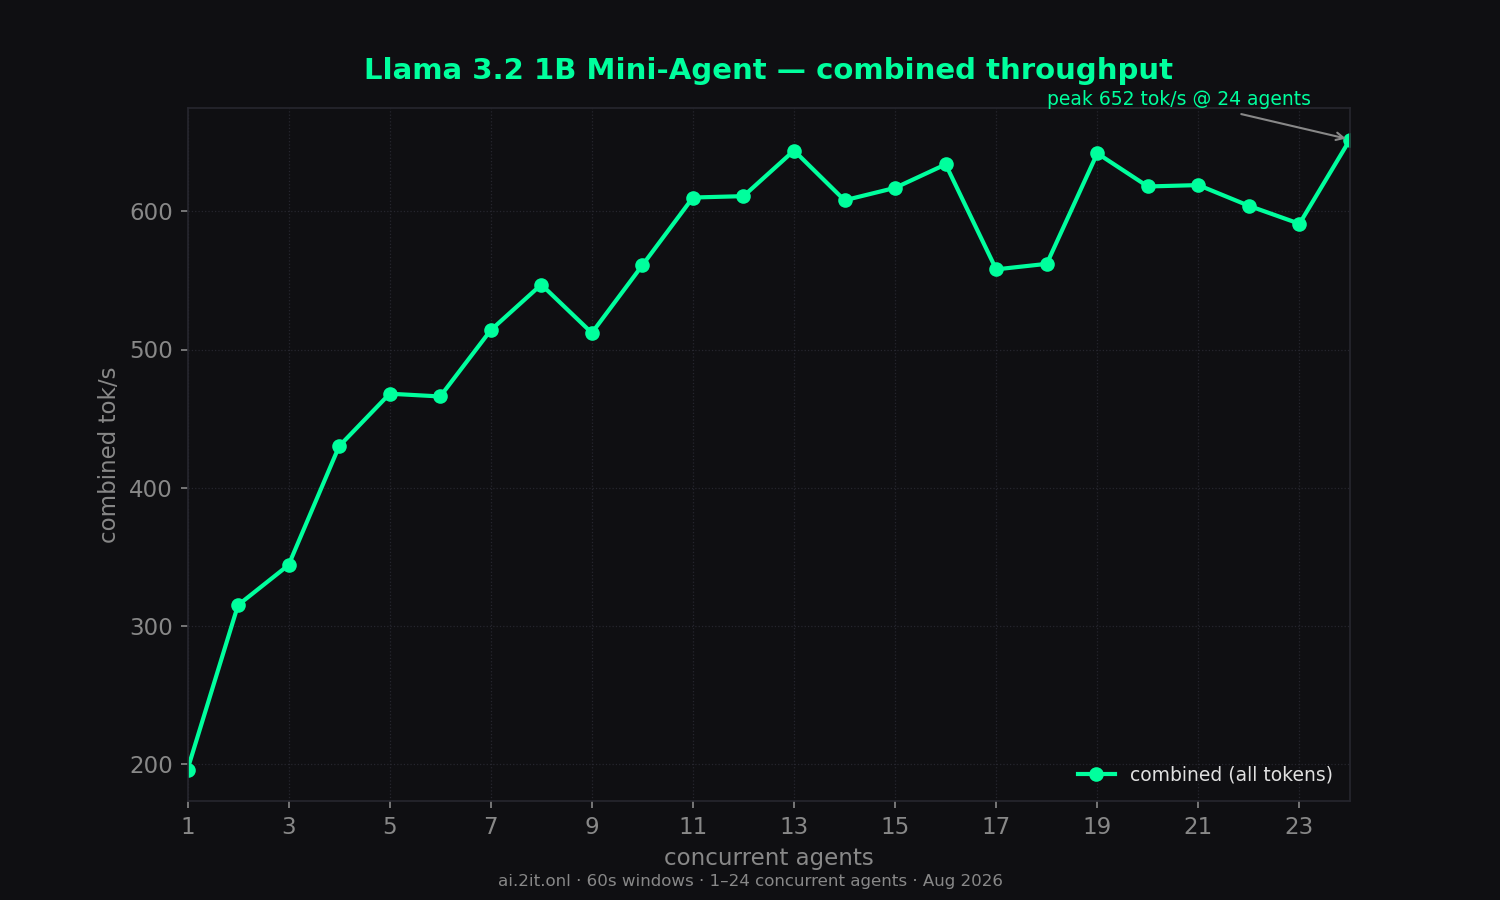
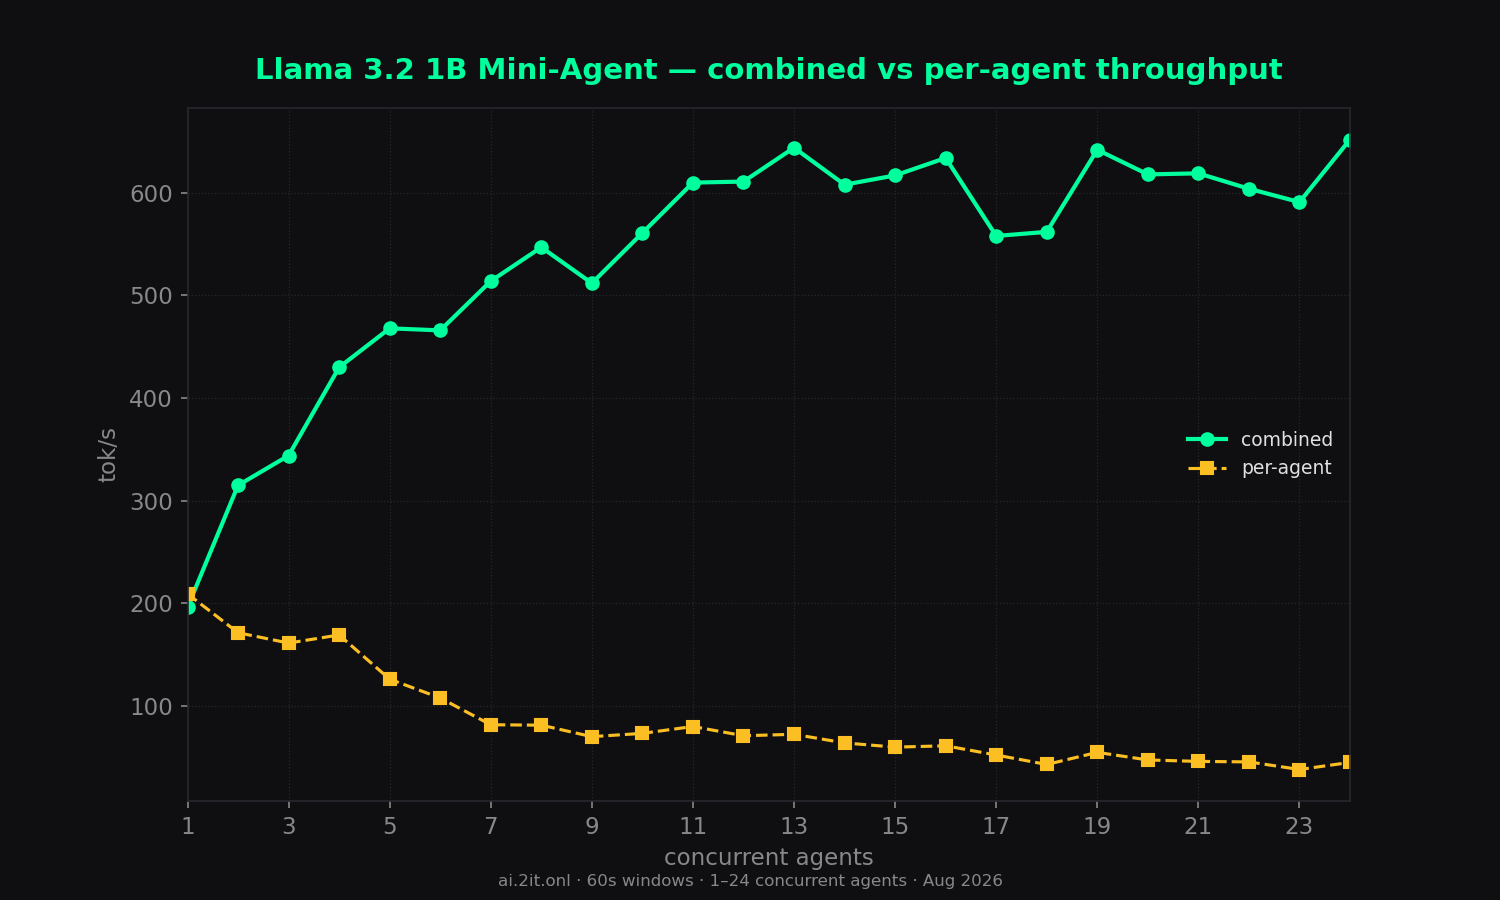
The first agentic-tuned model tested — clean 196 tok/s solo, plateau of ~600–650 tok/s from 13 agents on.
Key findings
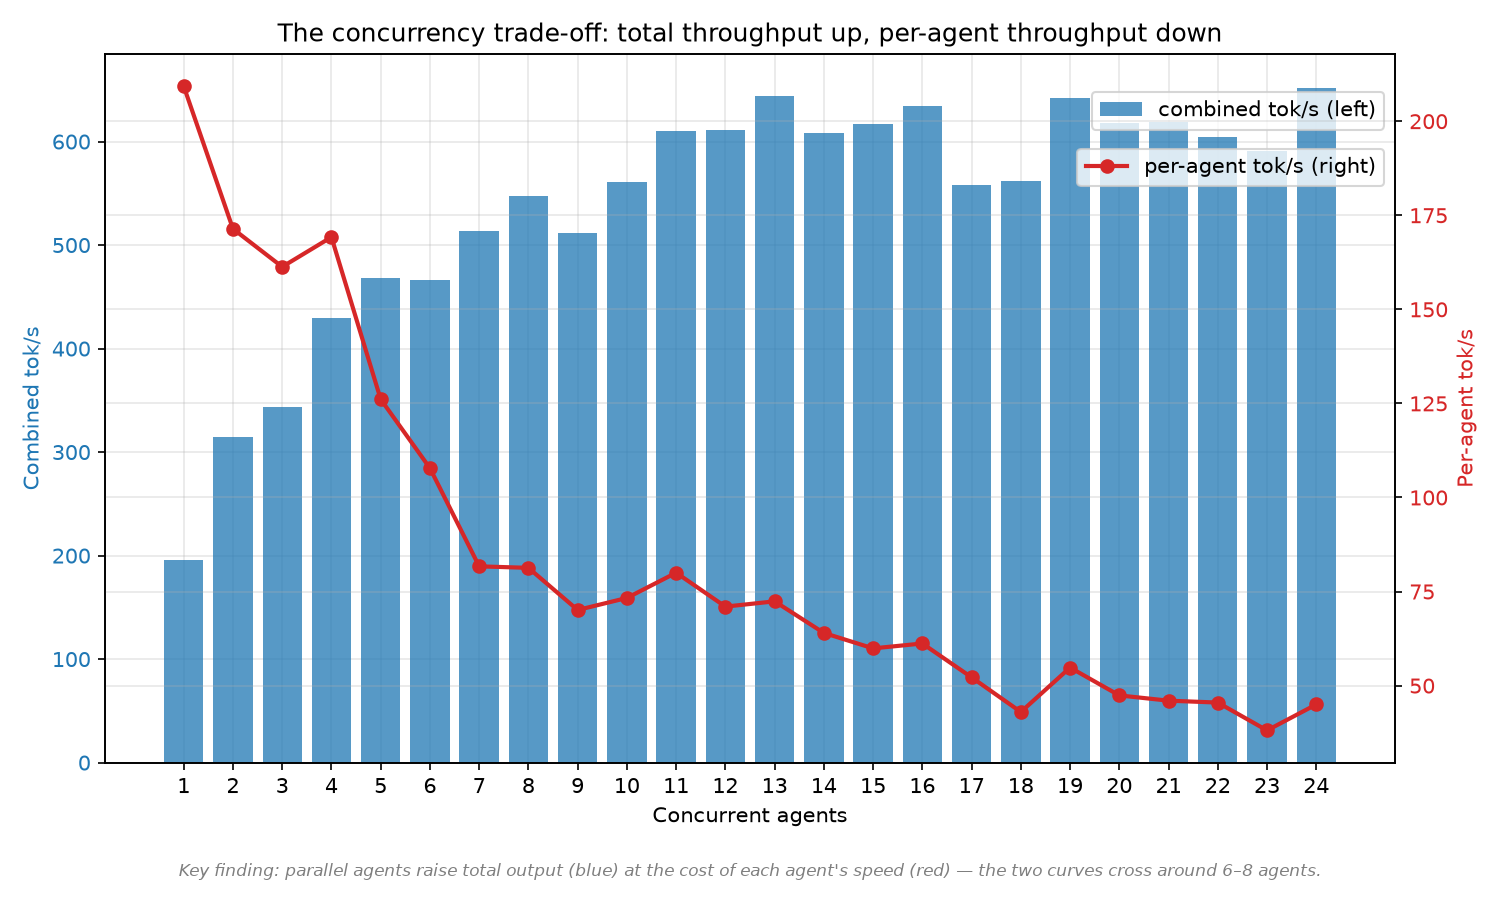
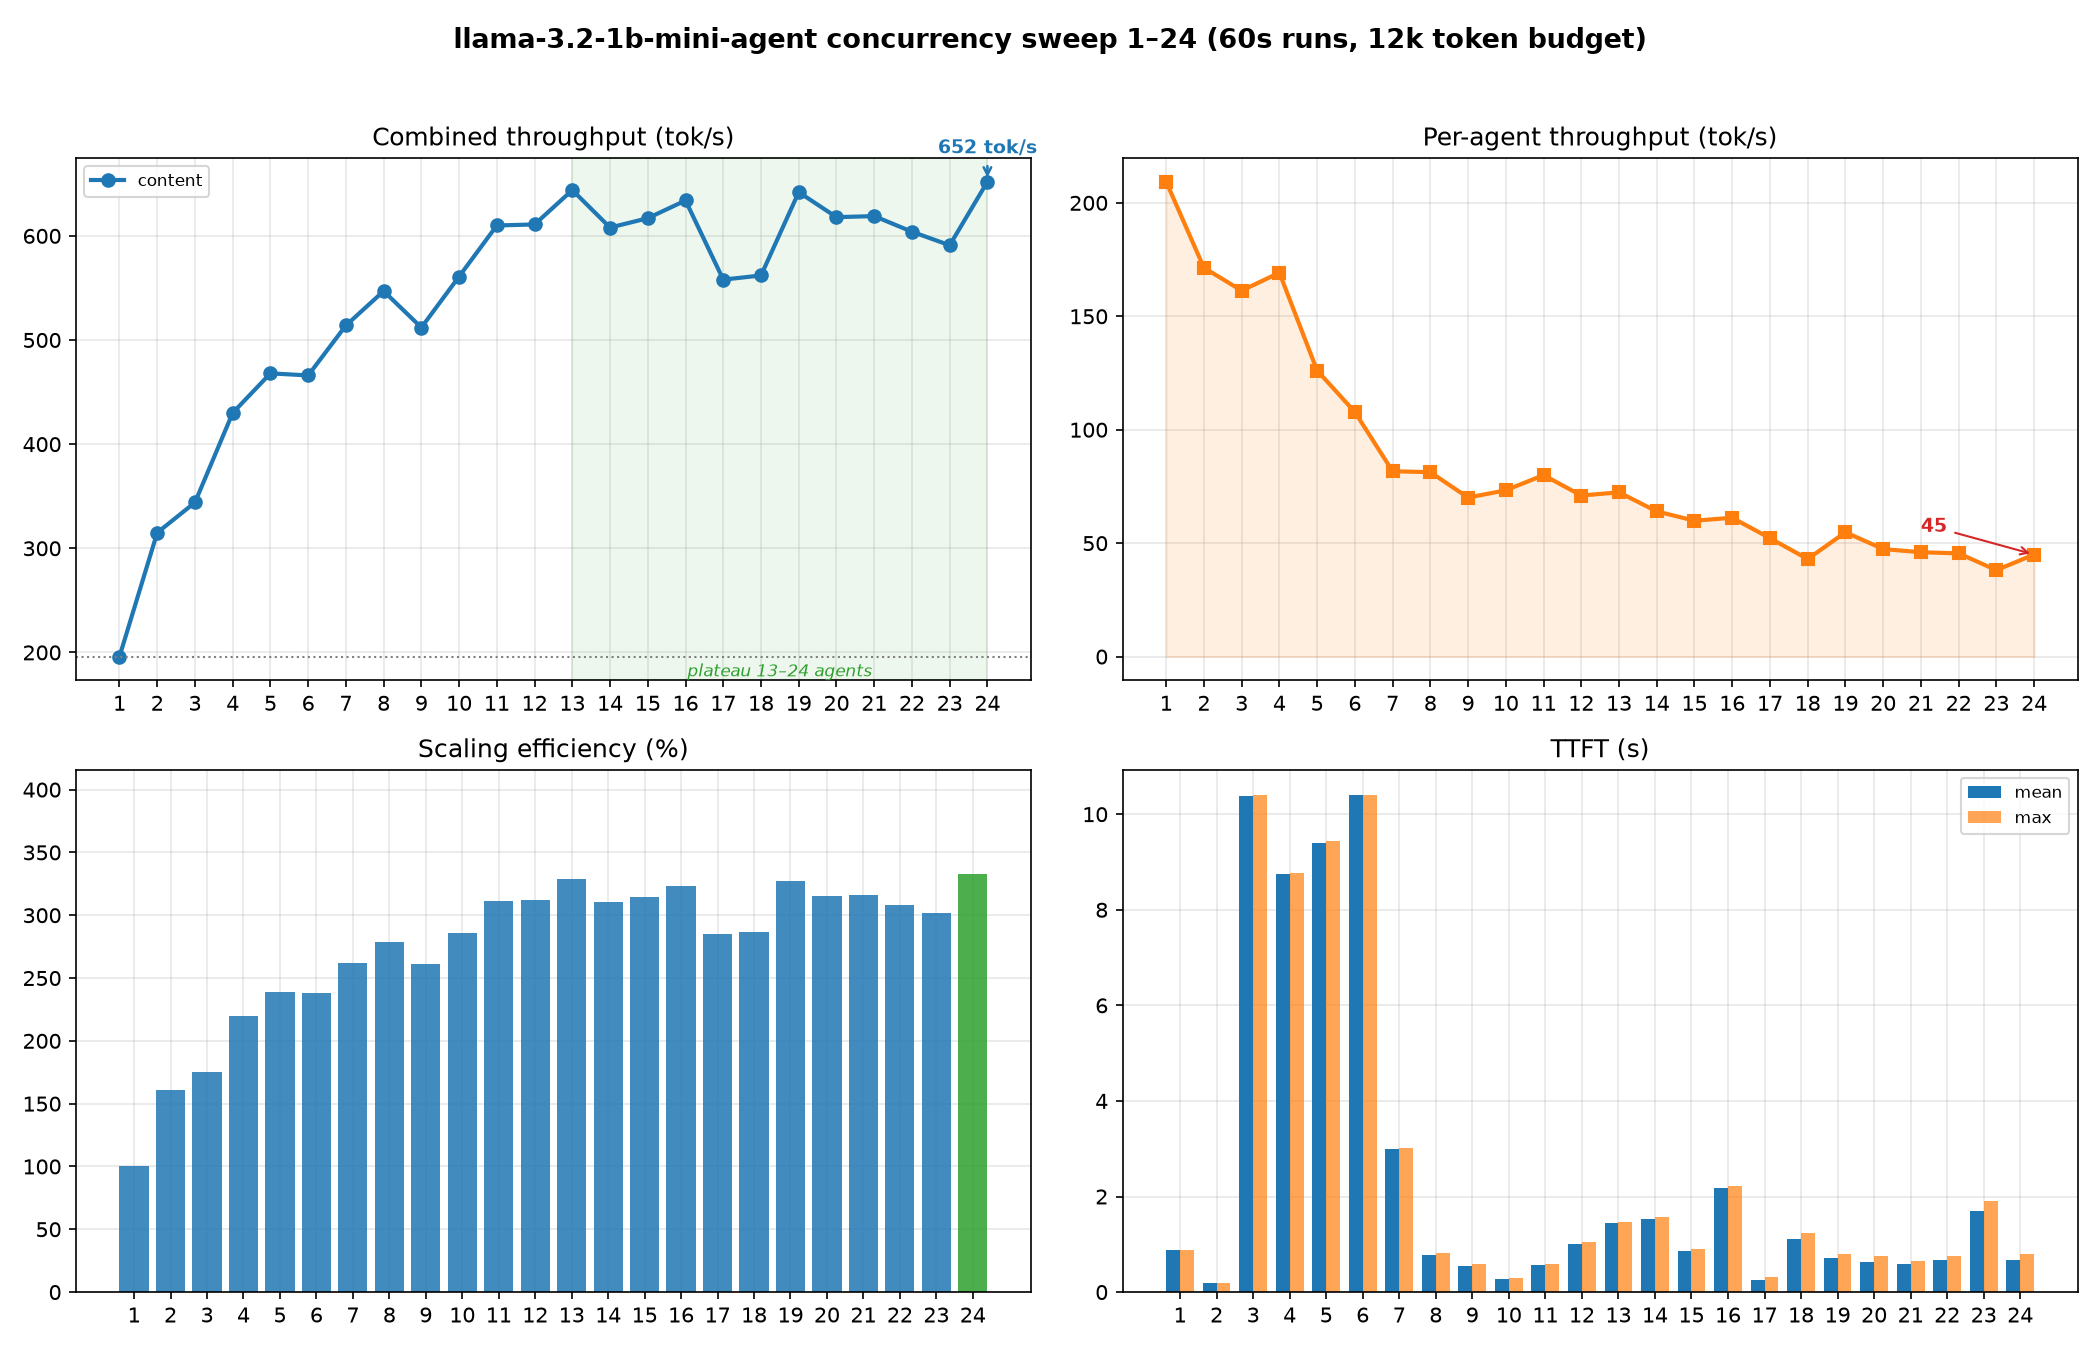
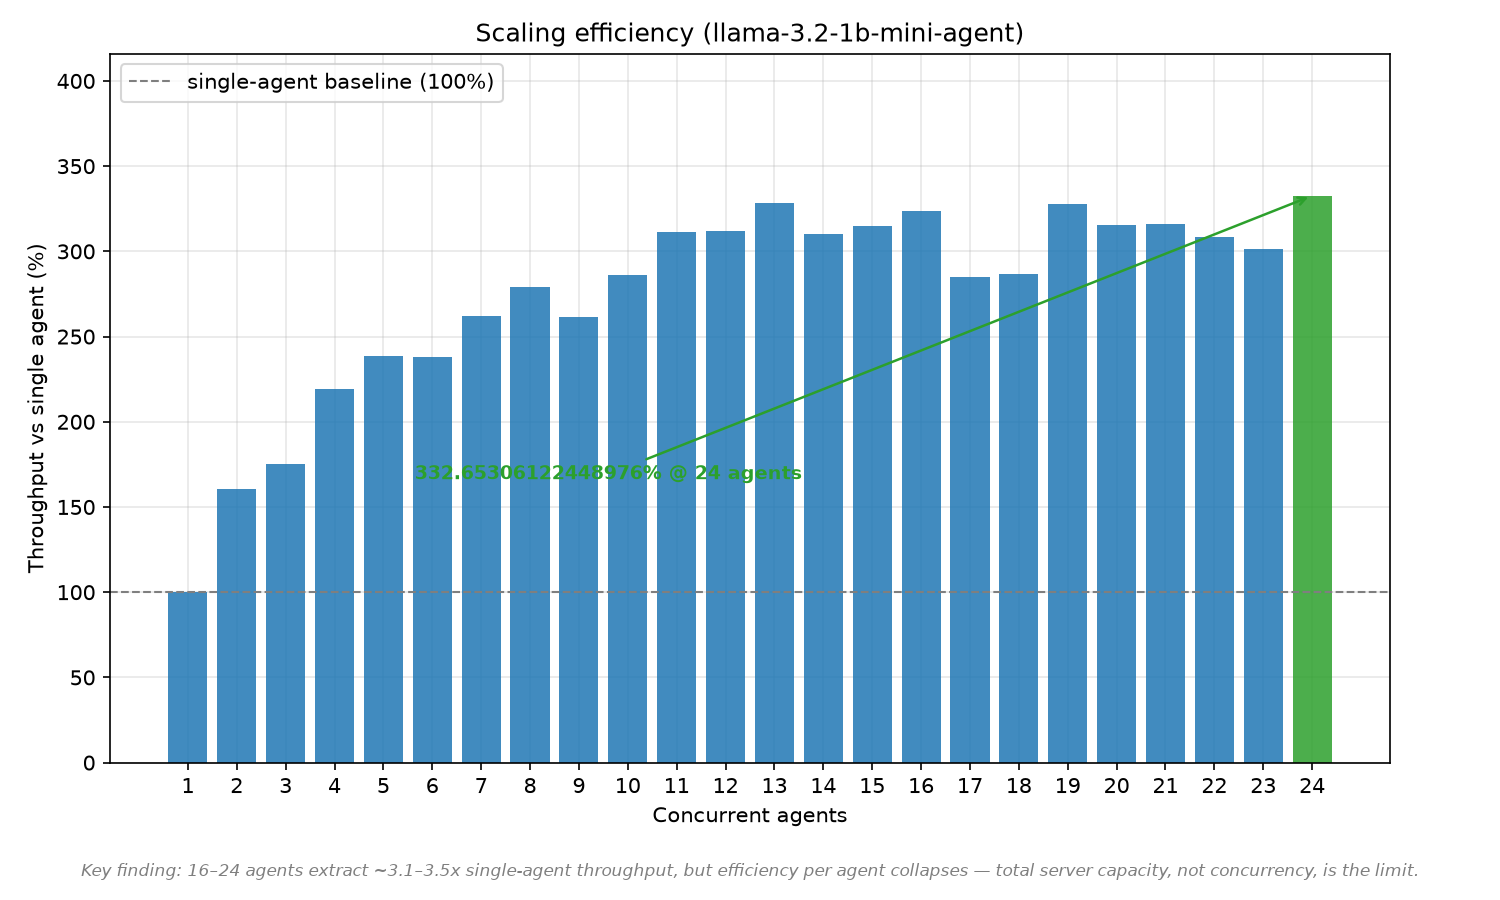
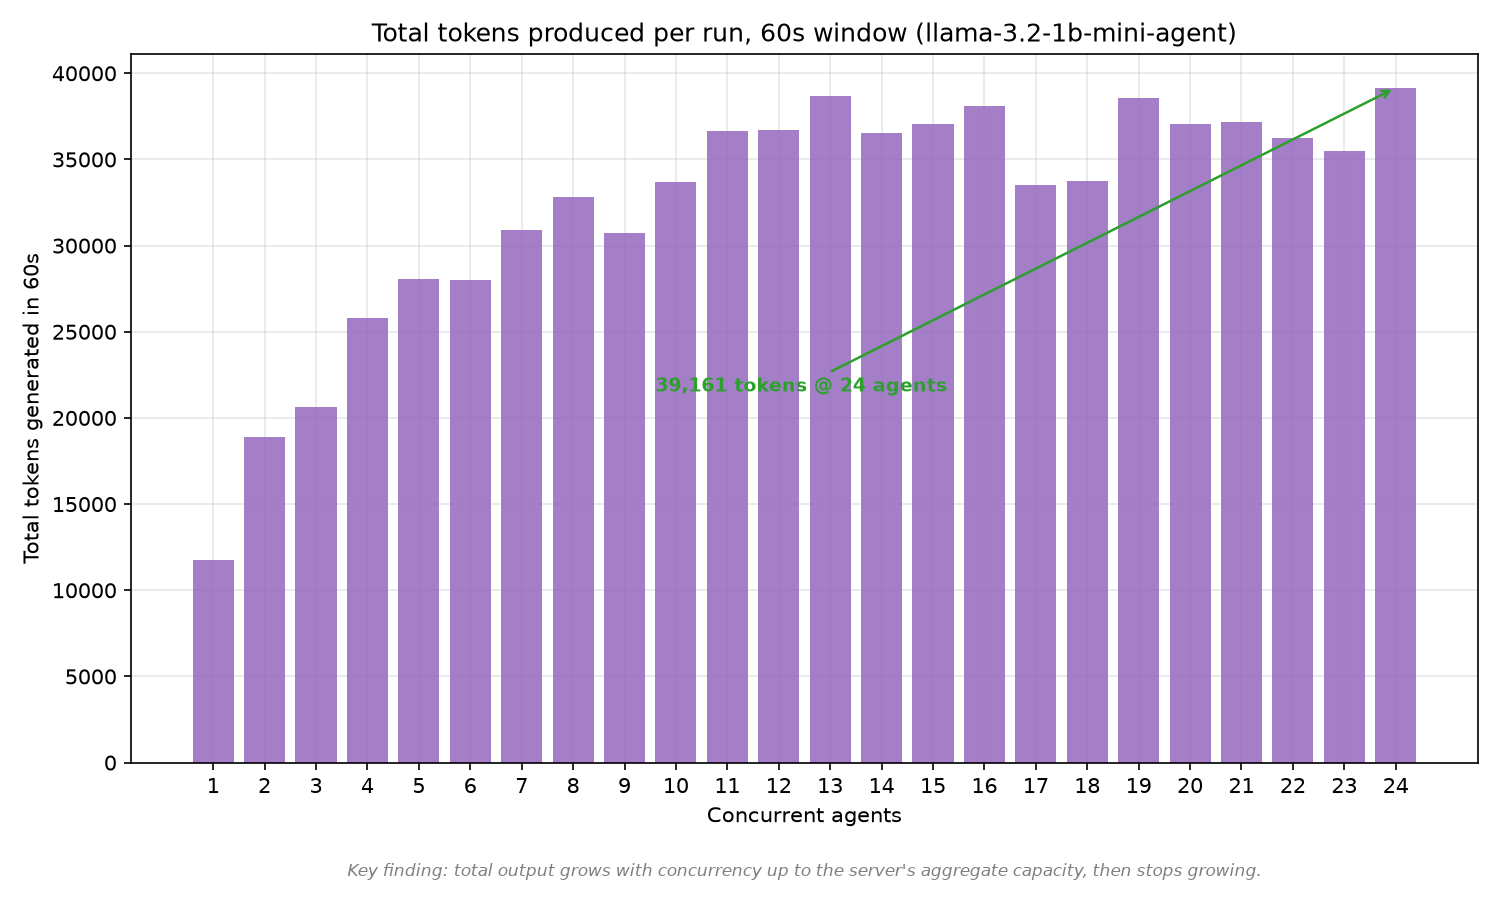
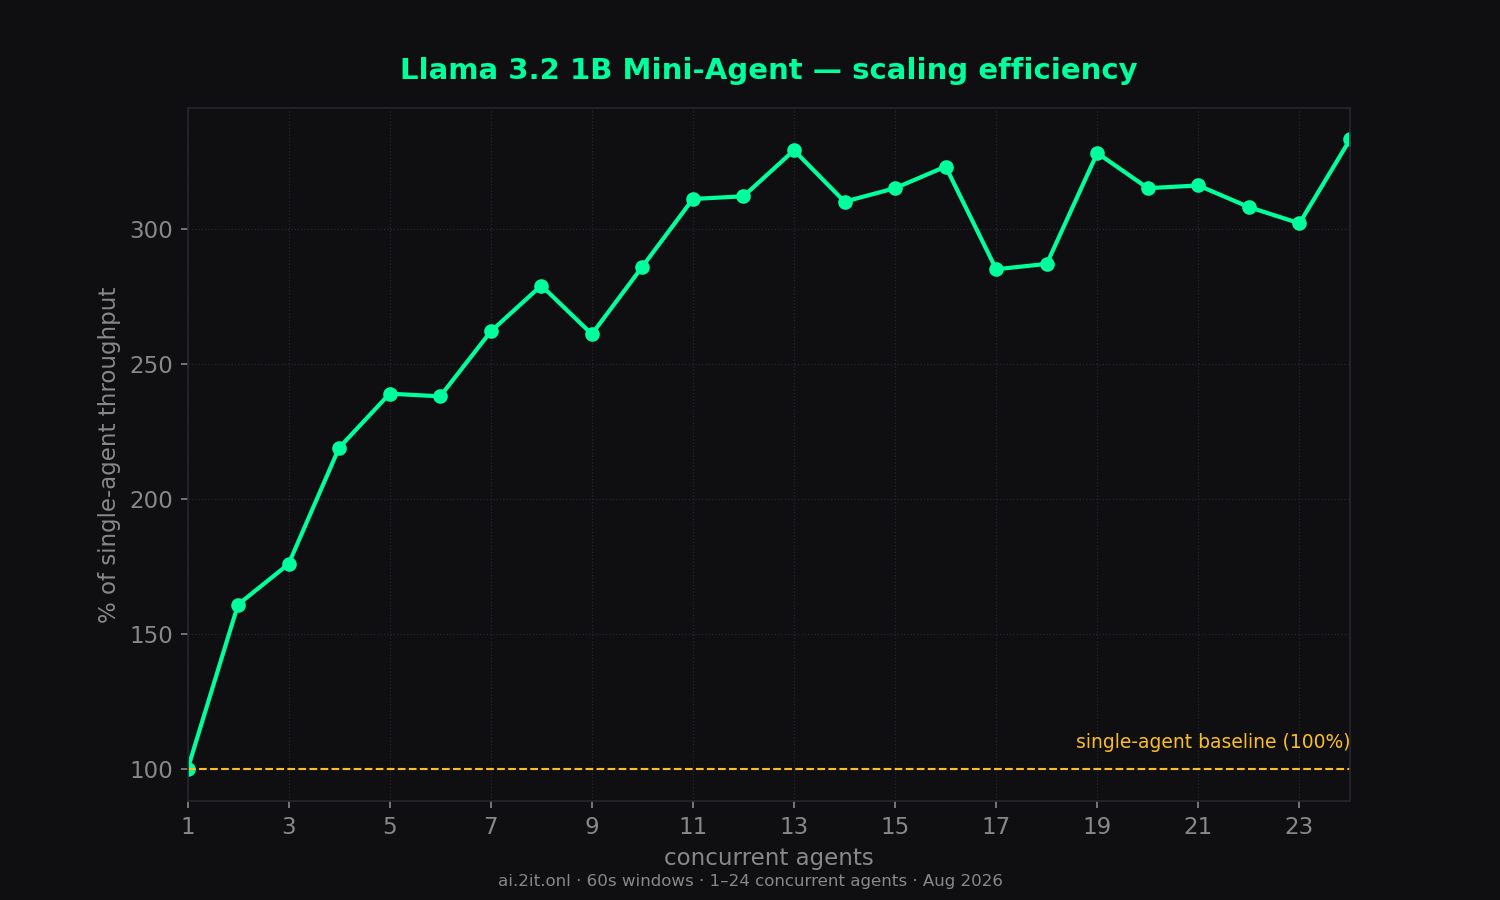
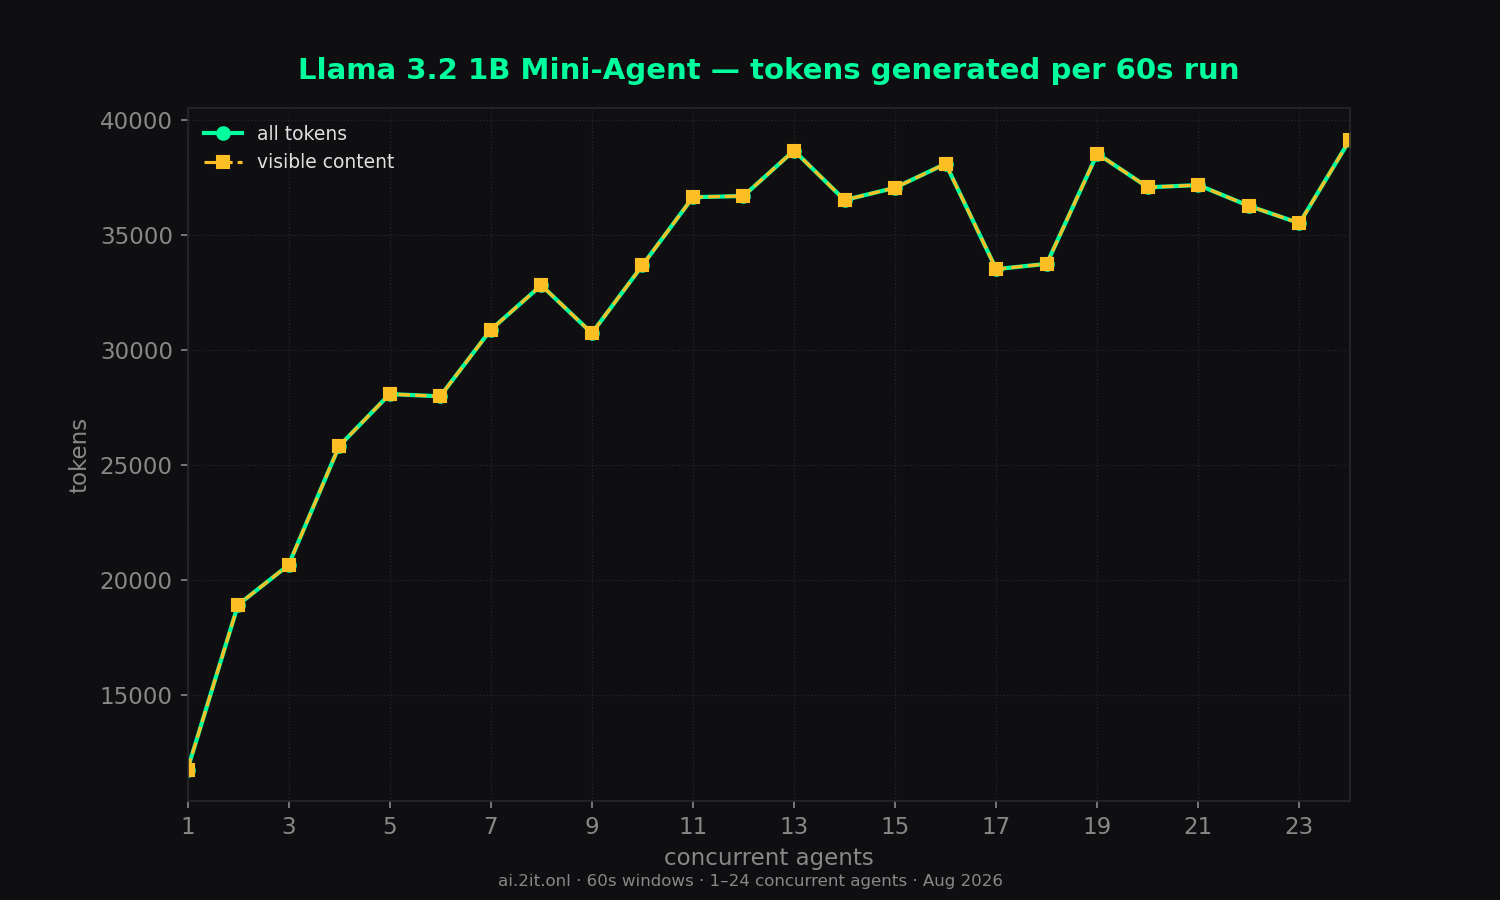
- Throughput: combined tok/s rises from 196 (1 agent) to a plateau of ~600–650 tok/s at 13+ agents; peak is 652 tok/s at 24 agents (3.3x single-agent). Adding agents past ~13–16 buys almost nothing.
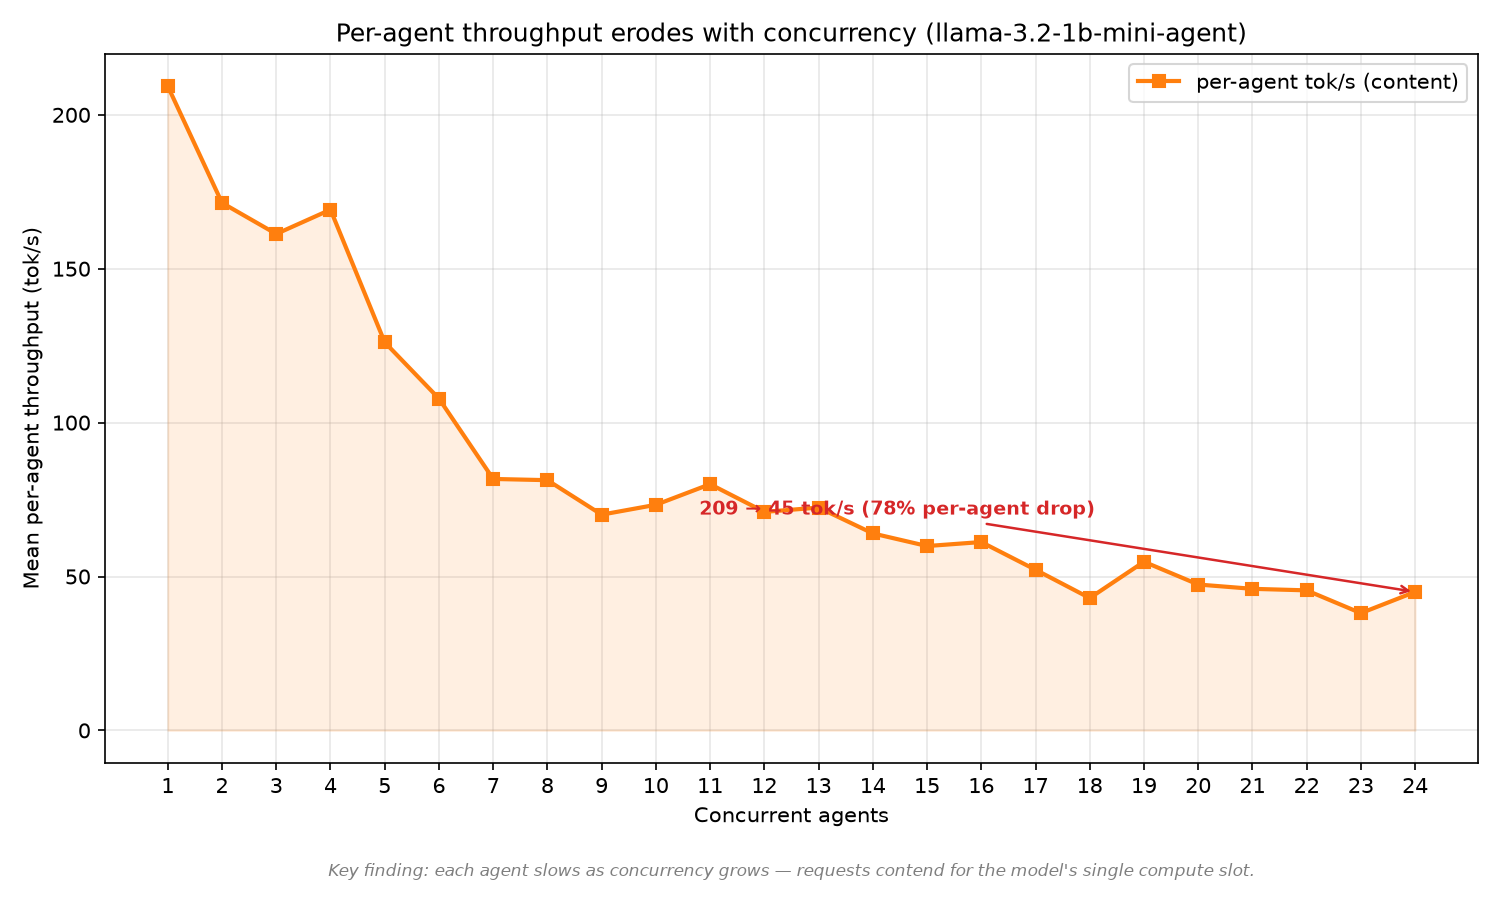
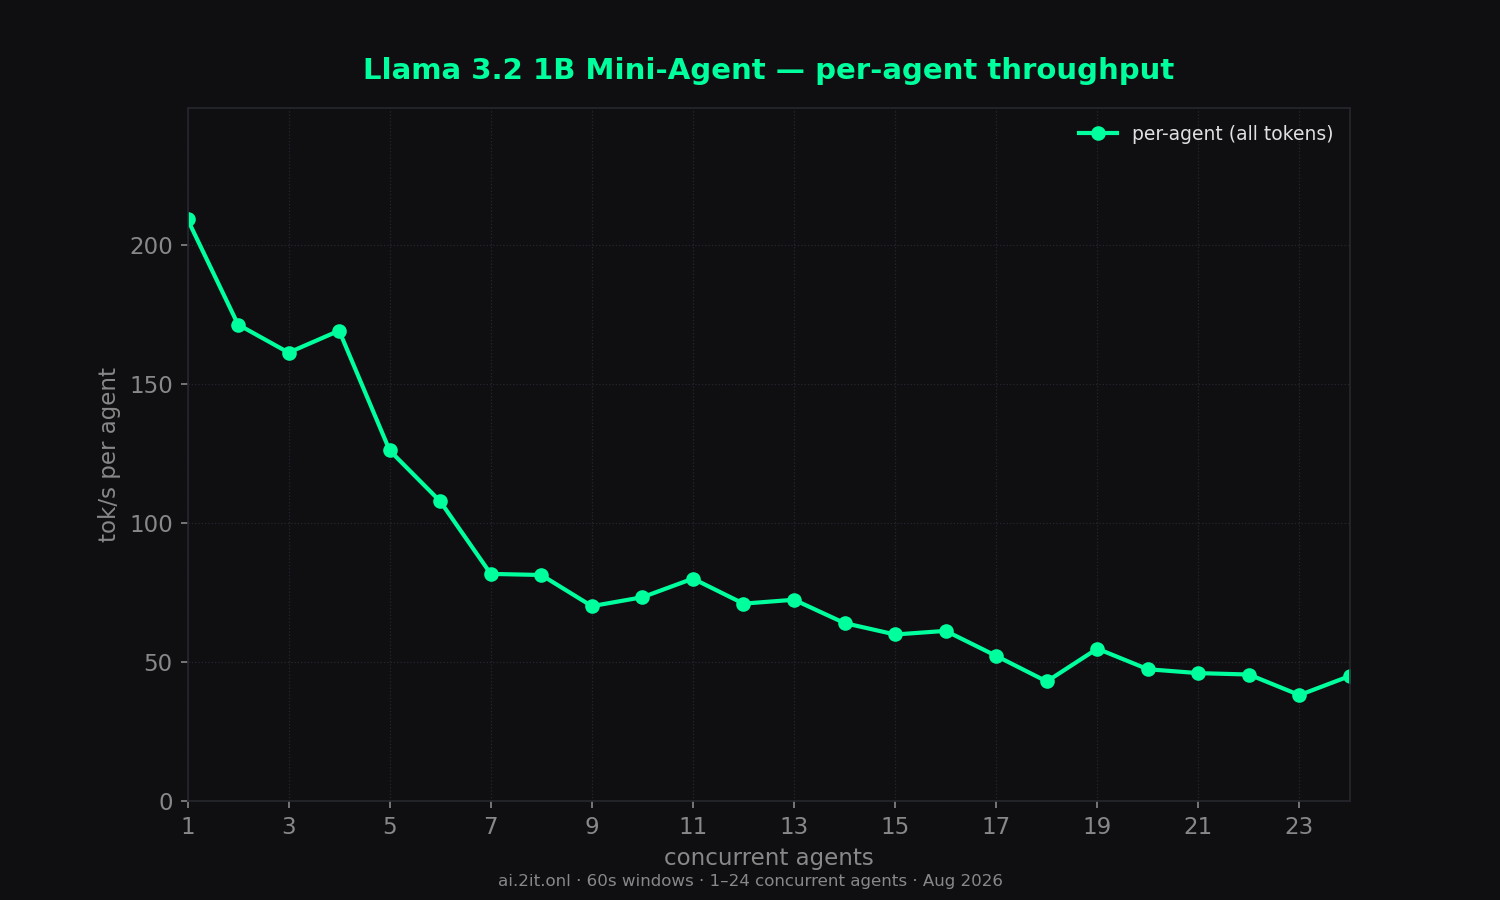
- Per-agent speed: erodes from 209 tok/s alone to 38–55 tok/s at 17–24 agents (19–27% of single-agent throughput) due to slot contention.
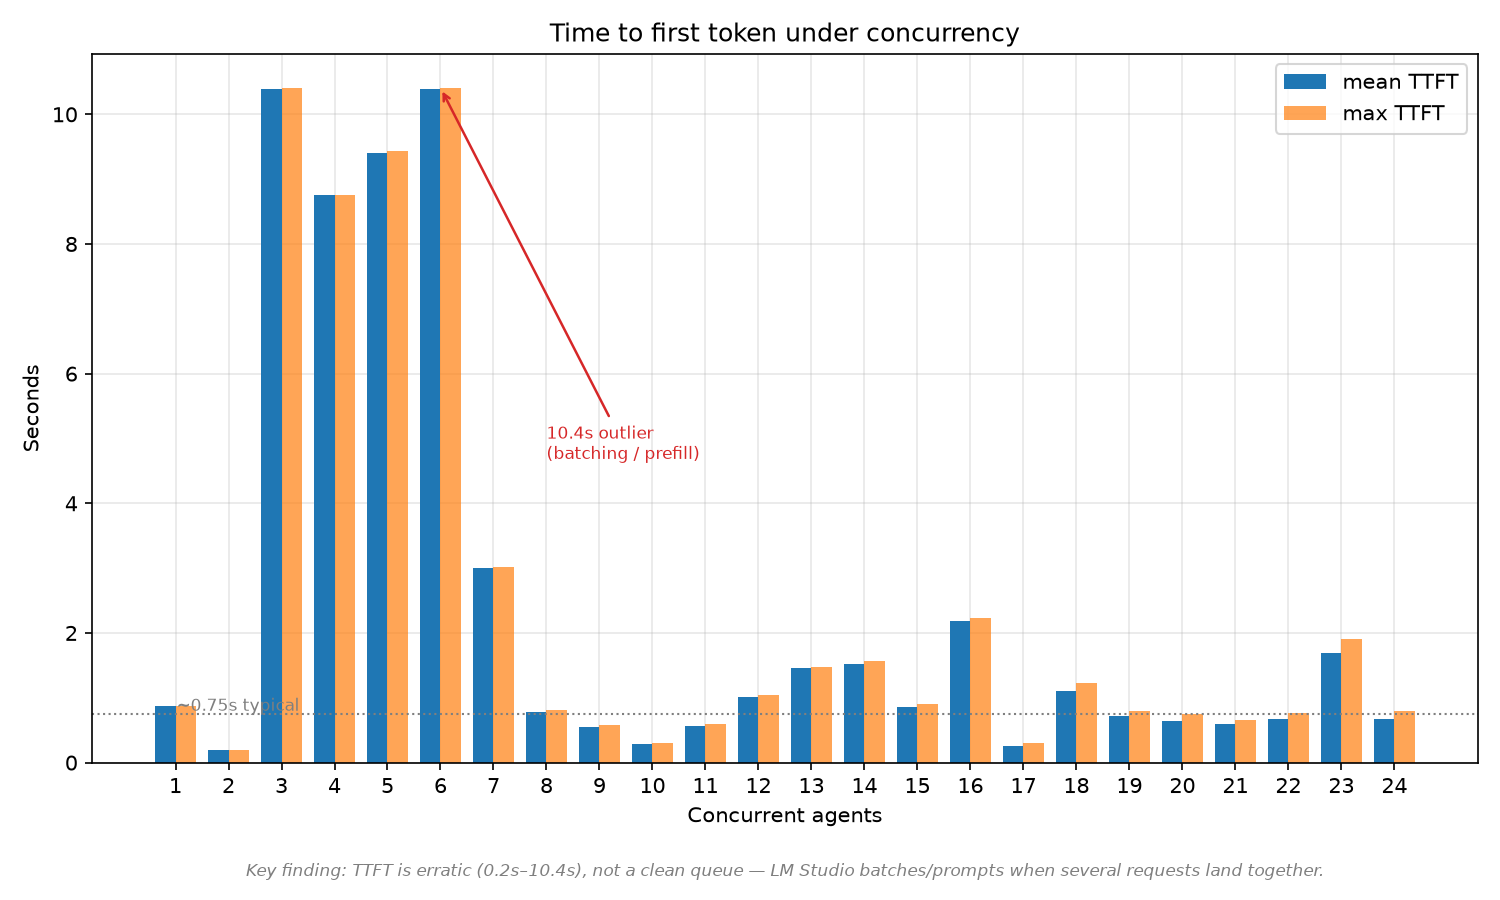
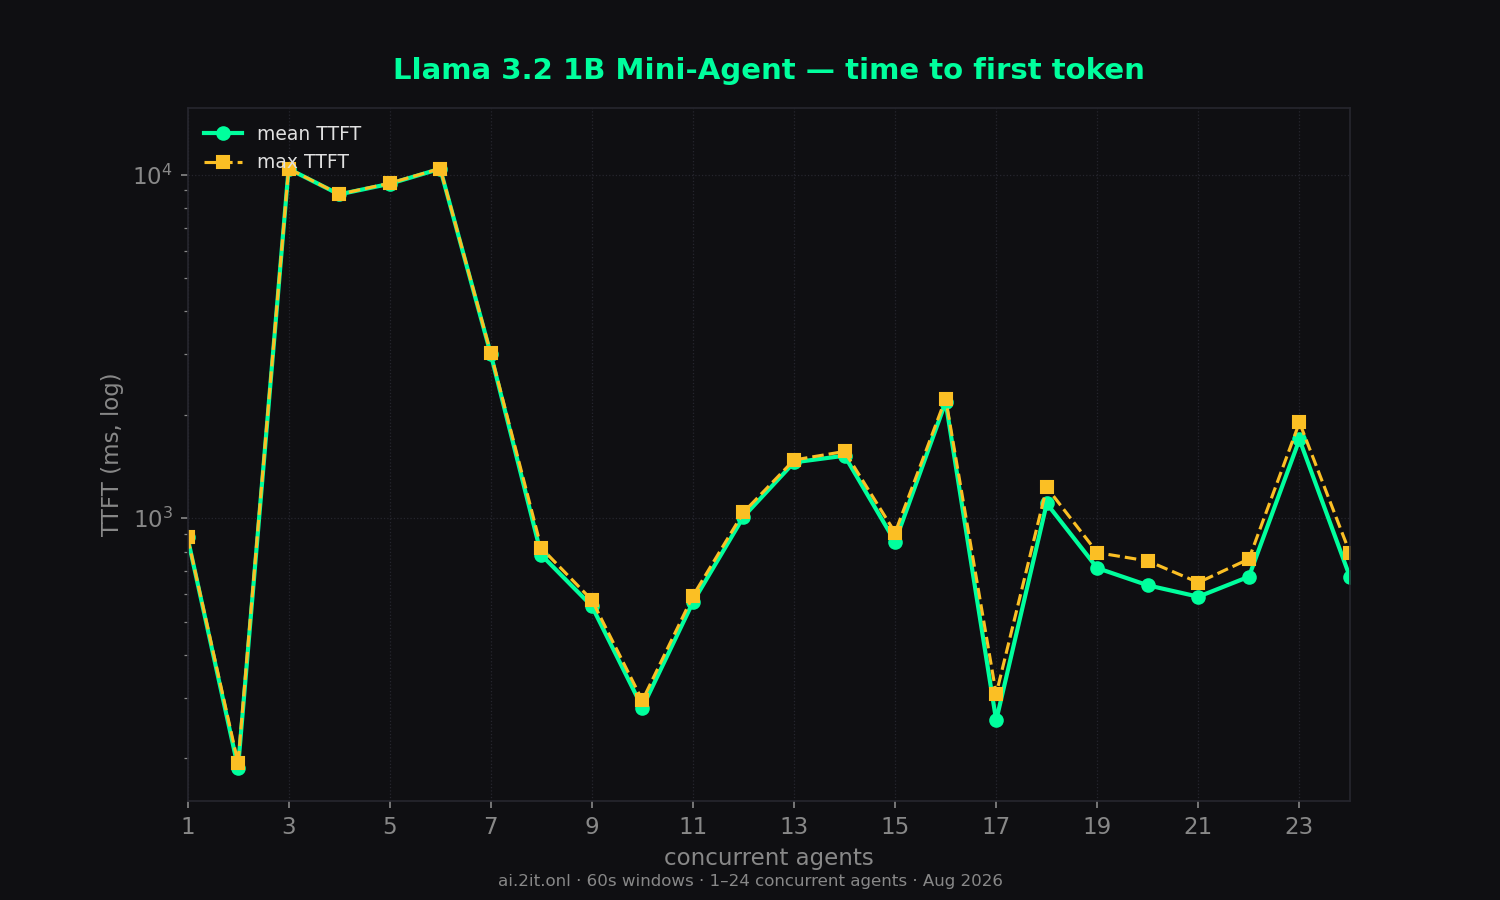
- TTFT: highly variable (188ms to ~10.4s) across runs — reflects LM Studio batching/prefill under load, not a clean linear queue.
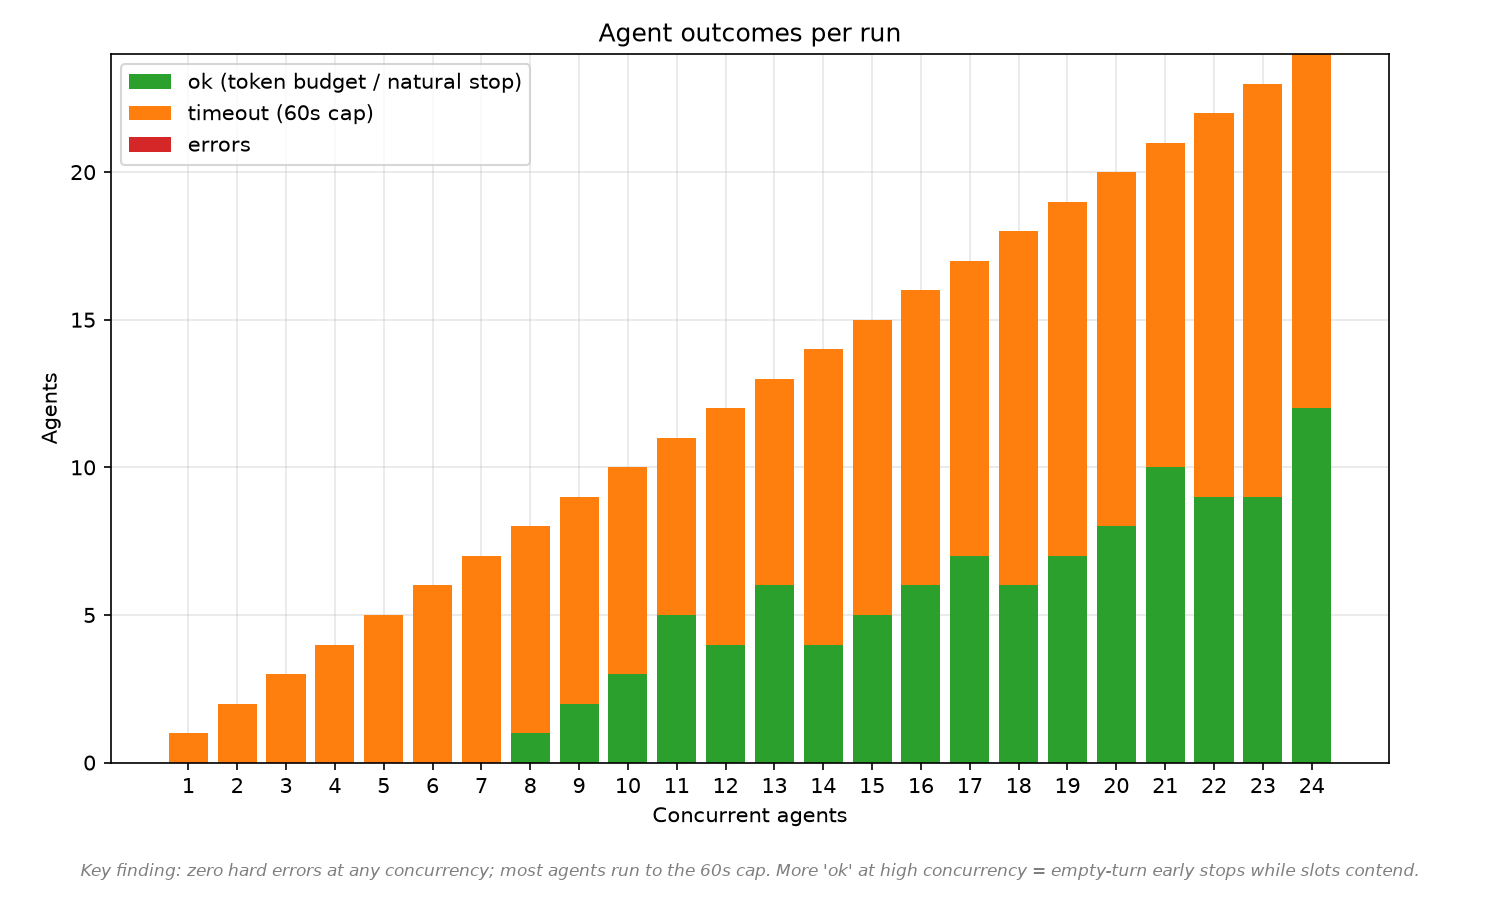
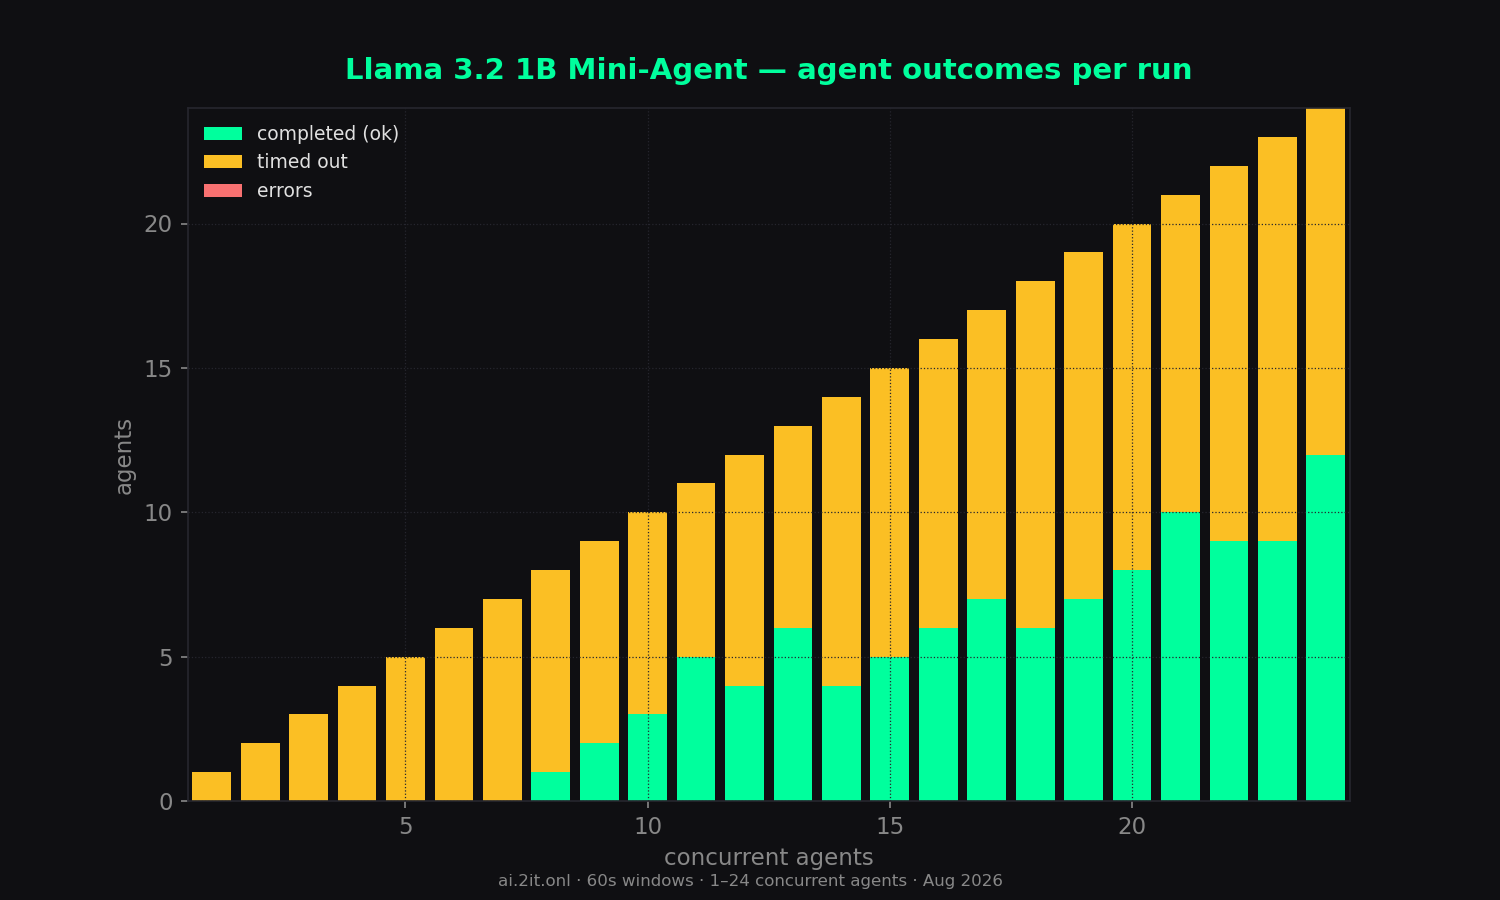
- Errors: 0 across all 24 runs.
- Caveat: at higher concurrency some agents end early via an "empty-turn" stop (model returns a turn with no content while competing for a slot); these are counted as
okwith roughly 1.1–1.9k tokens rather than reaching the 12k budget.
Sweep — total concurrency 1–24
| agents | wall (s) | content | reason | total | comb tok/s | comb all | per-agent | per-agent all | scale % | TTFT mean | TTFT max | ok | timeout | err |
|---|---|---|---|---|---|---|---|---|---|---|---|---|---|---|
| 1 | 60.0 | 11,741 | 0 | 11,741 | 196 | 196 | 209.3 | 209.3 | 100% | 880ms | 880ms | 0 | 1 | 0 |
| 2 | 60.0 | 18,908 | 0 | 18,908 | 315 | 315 | 171.4 | 171.4 | 161% | 188ms | 194ms | 0 | 2 | 0 |
| 3 | 60.0 | 20,642 | 0 | 20,642 | 344 | 344 | 161.3 | 161.3 | 176% | 10.4s | 10.4s | 0 | 3 | 0 |
| 4 | 60.0 | 25,816 | 0 | 25,816 | 430 | 430 | 169.2 | 169.2 | 219% | 8.8s | 8.8s | 0 | 4 | 0 |
| 5 | 60.0 | 28,081 | 0 | 28,081 | 468 | 468 | 126.1 | 126.1 | 239% | 9.4s | 9.4s | 0 | 5 | 0 |
| 6 | 60.0 | 27,983 | 0 | 27,983 | 466 | 466 | 107.8 | 107.8 | 238% | 10.4s | 10.4s | 0 | 6 | 0 |
| 7 | 60.0 | 30,879 | 0 | 30,879 | 514 | 514 | 81.7 | 81.7 | 262% | 3.0s | 3.0s | 0 | 7 | 0 |
| 8 | 60.0 | 32,819 | 0 | 32,819 | 547 | 547 | 81.3 | 81.3 | 279% | 782ms | 819ms | 1 | 7 | 0 |
| 9 | 60.1 | 30,729 | 0 | 30,729 | 512 | 512 | 70.1 | 70.1 | 261% | 555ms | 578ms | 2 | 7 | 0 |
| 10 | 60.0 | 33,683 | 0 | 33,683 | 561 | 561 | 73.3 | 73.3 | 286% | 281ms | 295ms | 3 | 7 | 0 |
| 11 | 60.0 | 36,650 | 0 | 36,650 | 610 | 610 | 80.0 | 80.0 | 311% | 570ms | 594ms | 5 | 6 | 0 |
| 12 | 60.1 | 36,701 | 0 | 36,701 | 611 | 611 | 71.0 | 71.0 | 312% | 1.0s | 1.0s | 4 | 8 | 0 |
| 13 | 60.1 | 38,681 | 0 | 38,681 | 644 | 644 | 72.4 | 72.4 | 329% | 1.5s | 1.5s | 6 | 7 | 0 |
| 14 | 60.1 | 36,525 | 0 | 36,525 | 608 | 608 | 64.0 | 64.0 | 310% | 1.5s | 1.6s | 4 | 10 | 0 |
| 15 | 60.1 | 37,062 | 0 | 37,062 | 617 | 617 | 59.9 | 59.9 | 315% | 854ms | 908ms | 5 | 10 | 0 |
| 16 | 60.1 | 38,106 | 0 | 38,106 | 634 | 634 | 61.2 | 61.2 | 323% | 2.2s | 2.2s | 6 | 10 | 0 |
| 17 | 60.1 | 33,519 | 0 | 33,519 | 558 | 558 | 52.2 | 52.2 | 285% | 258ms | 308ms | 7 | 10 | 0 |
| 18 | 60.0 | 33,750 | 0 | 33,750 | 562 | 562 | 43.0 | 43.0 | 287% | 1.1s | 1.2s | 6 | 12 | 0 |
| 19 | 60.1 | 38,547 | 0 | 38,547 | 642 | 642 | 54.8 | 54.8 | 328% | 716ms | 794ms | 7 | 12 | 0 |
| 20 | 60.0 | 37,080 | 0 | 37,080 | 618 | 618 | 47.4 | 47.4 | 315% | 638ms | 751ms | 8 | 12 | 0 |
| 21 | 60.1 | 37,177 | 0 | 37,177 | 619 | 619 | 46.0 | 46.0 | 316% | 591ms | 650ms | 10 | 11 | 0 |
| 22 | 60.1 | 36,271 | 0 | 36,271 | 604 | 604 | 45.5 | 45.5 | 308% | 676ms | 761ms | 9 | 13 | 0 |
| 23 | 60.0 | 35,518 | 0 | 35,518 | 591 | 591 | 38.1 | 38.1 | 302% | 1.7s | 1.9s | 9 | 14 | 0 |
| 24 peak | 60.1 | 39,161 | 0 | 39,161 | 652 | 652 | 45.0 | 45.0 | 333% | 674ms | 791ms | 12 | 12 | 0 |
* burst artifact — agents queued ~11–16s then generated in a short burst; the per-agent timer inflates the number. Trust combined throughput and TTFT columns. Peak row = highest combined (all-token) throughput.
Charts
Raw data & downloads
- report.md5 KB
- sweep-summary.csv2 KB
- sweep-summary.json7 KB
- combined_throughput.png110 KB · original matplotlib export
- combined_vs_per_agent.png104 KB · original matplotlib export
- dashboard_1_24.png164 KB · original matplotlib export
- outcome_breakdown.png57 KB · original matplotlib export
- per_agent_throughput.png92 KB · original matplotlib export
- scaling_efficiency.png84 KB · original matplotlib export
- time_to_first_token.png65 KB · original matplotlib export
- total_tokens_generated.png75 KB · original matplotlib export