Chronos 1.5B
server model id:
chronos-1.5bthinkingKV F16ctx 8k1.5B params
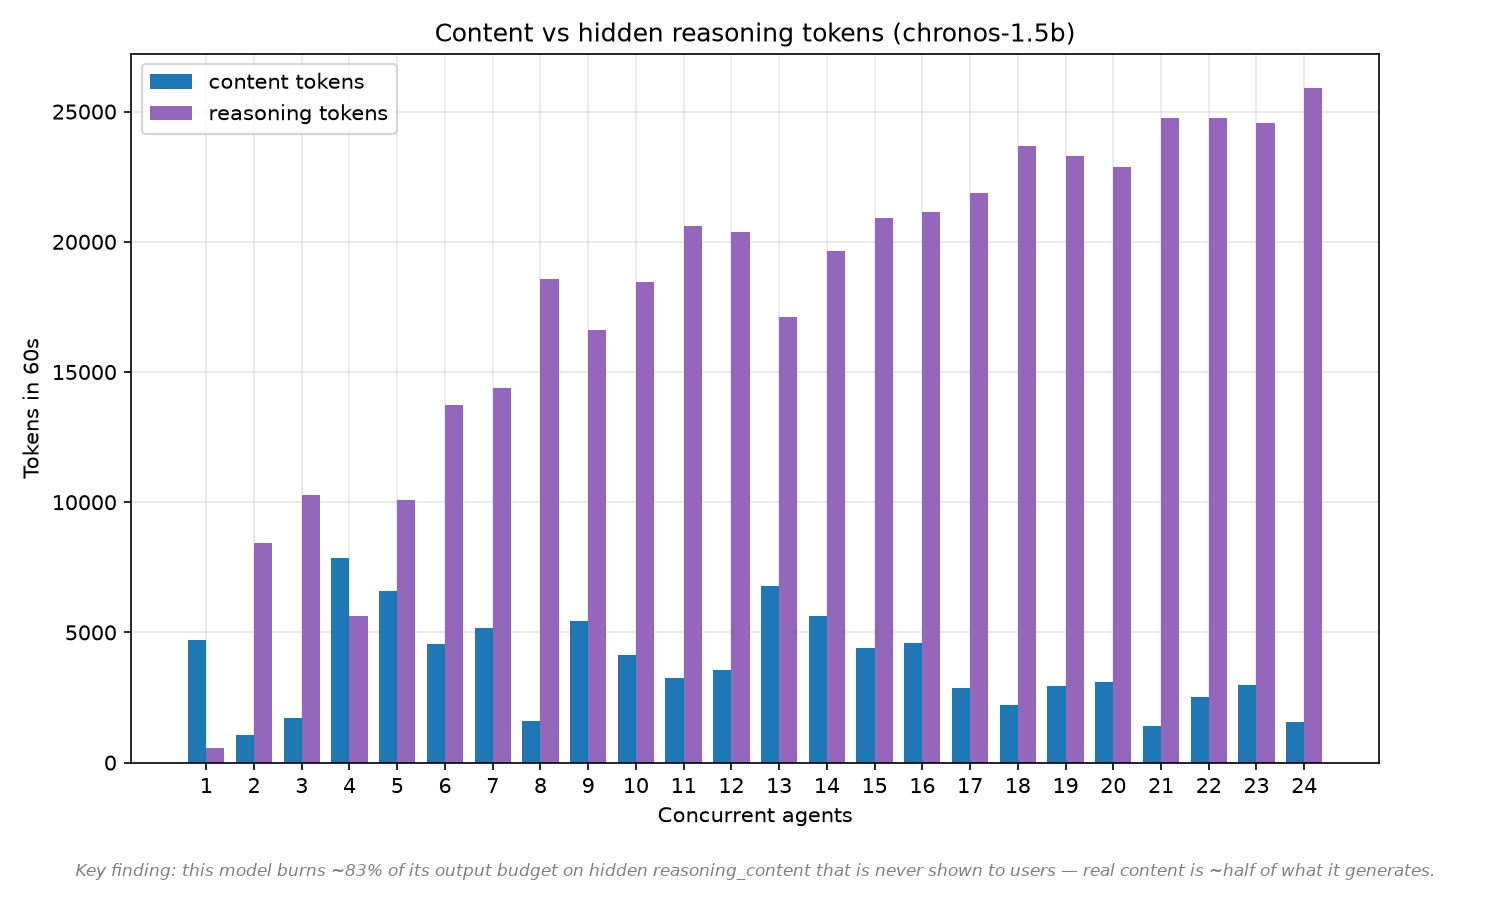
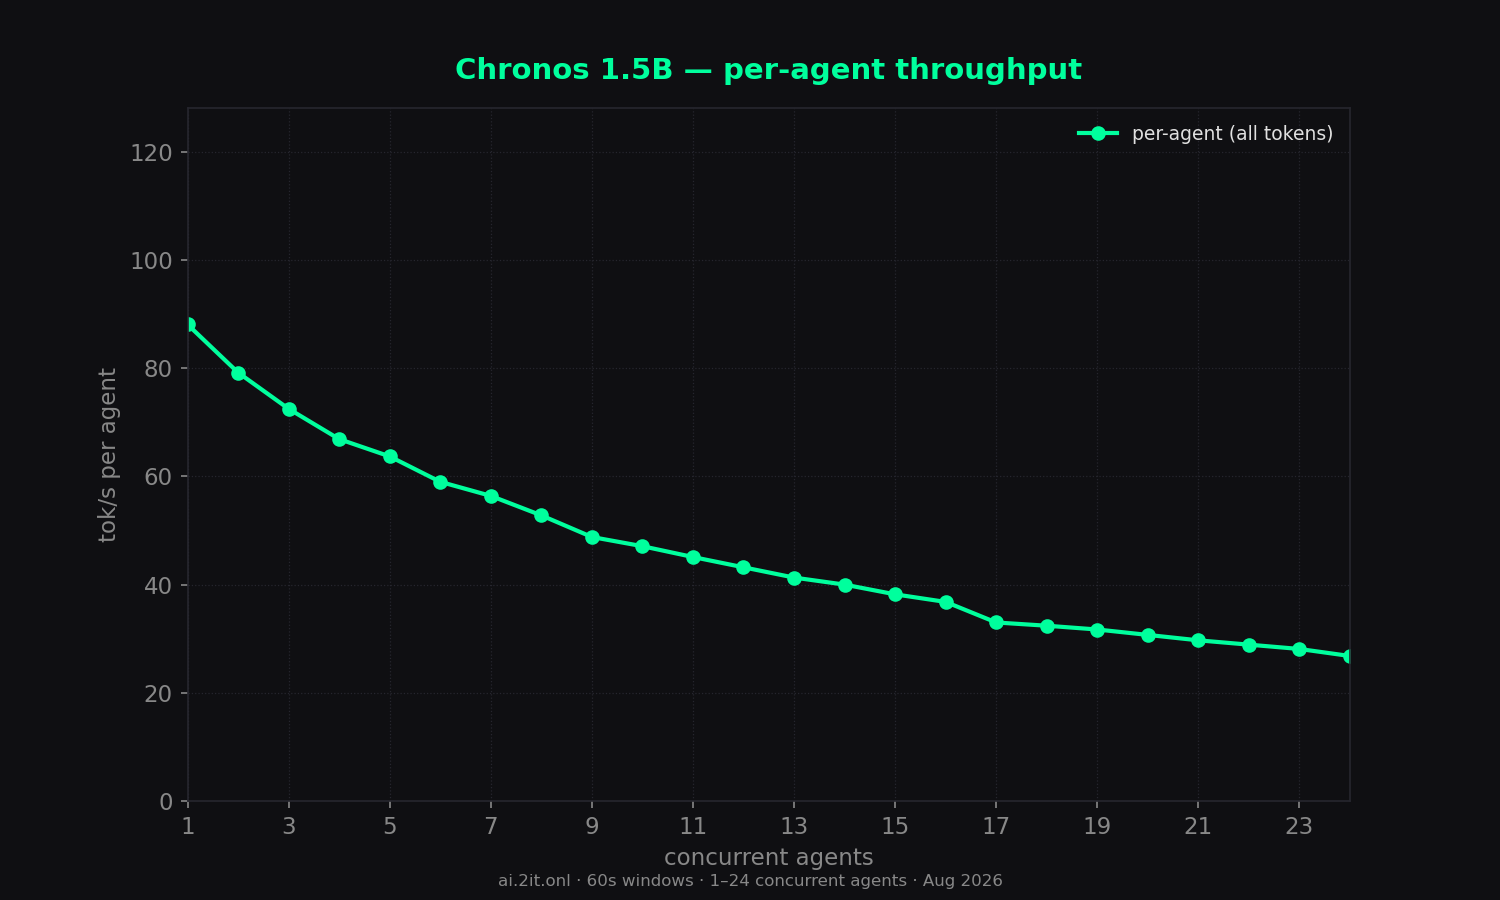
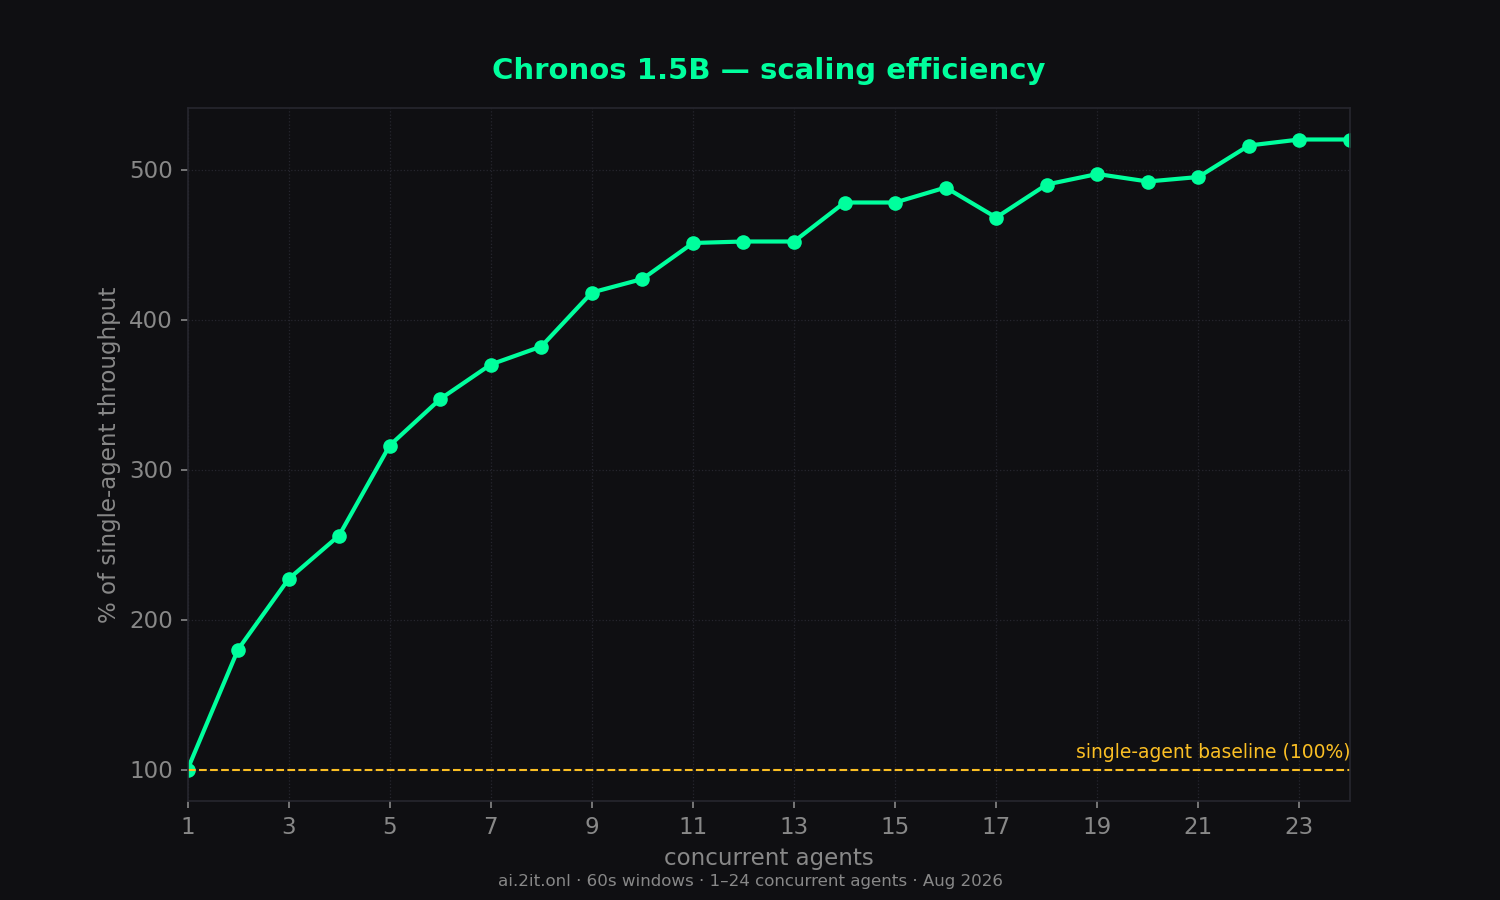
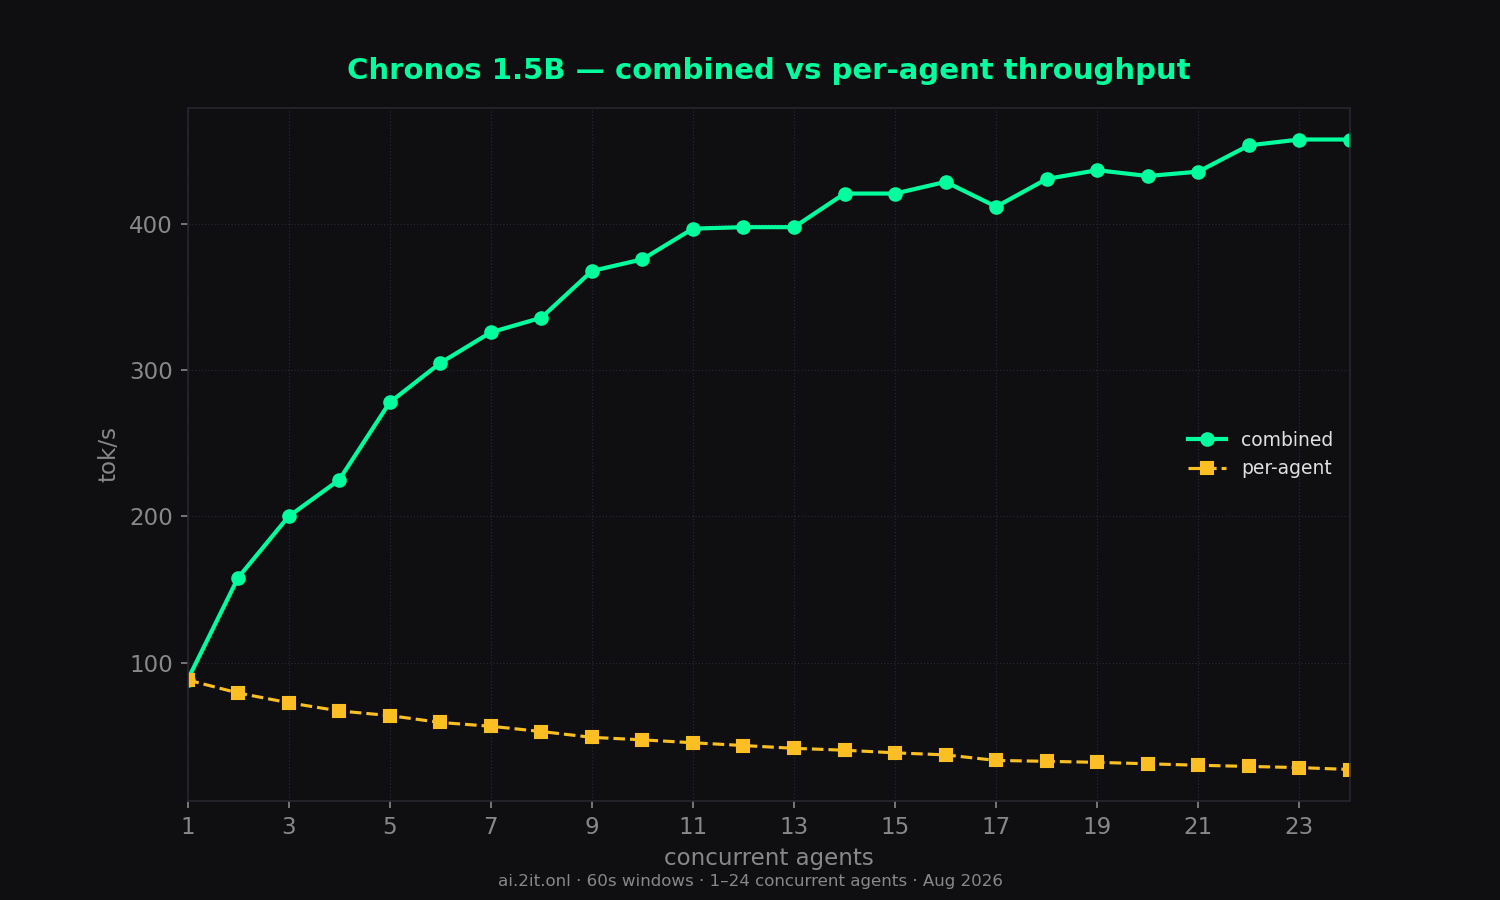
Slowest solo (88 tok/s) but scales 5.2x — 94% of its output at high concurrency is hidden reasoning.
Key findings
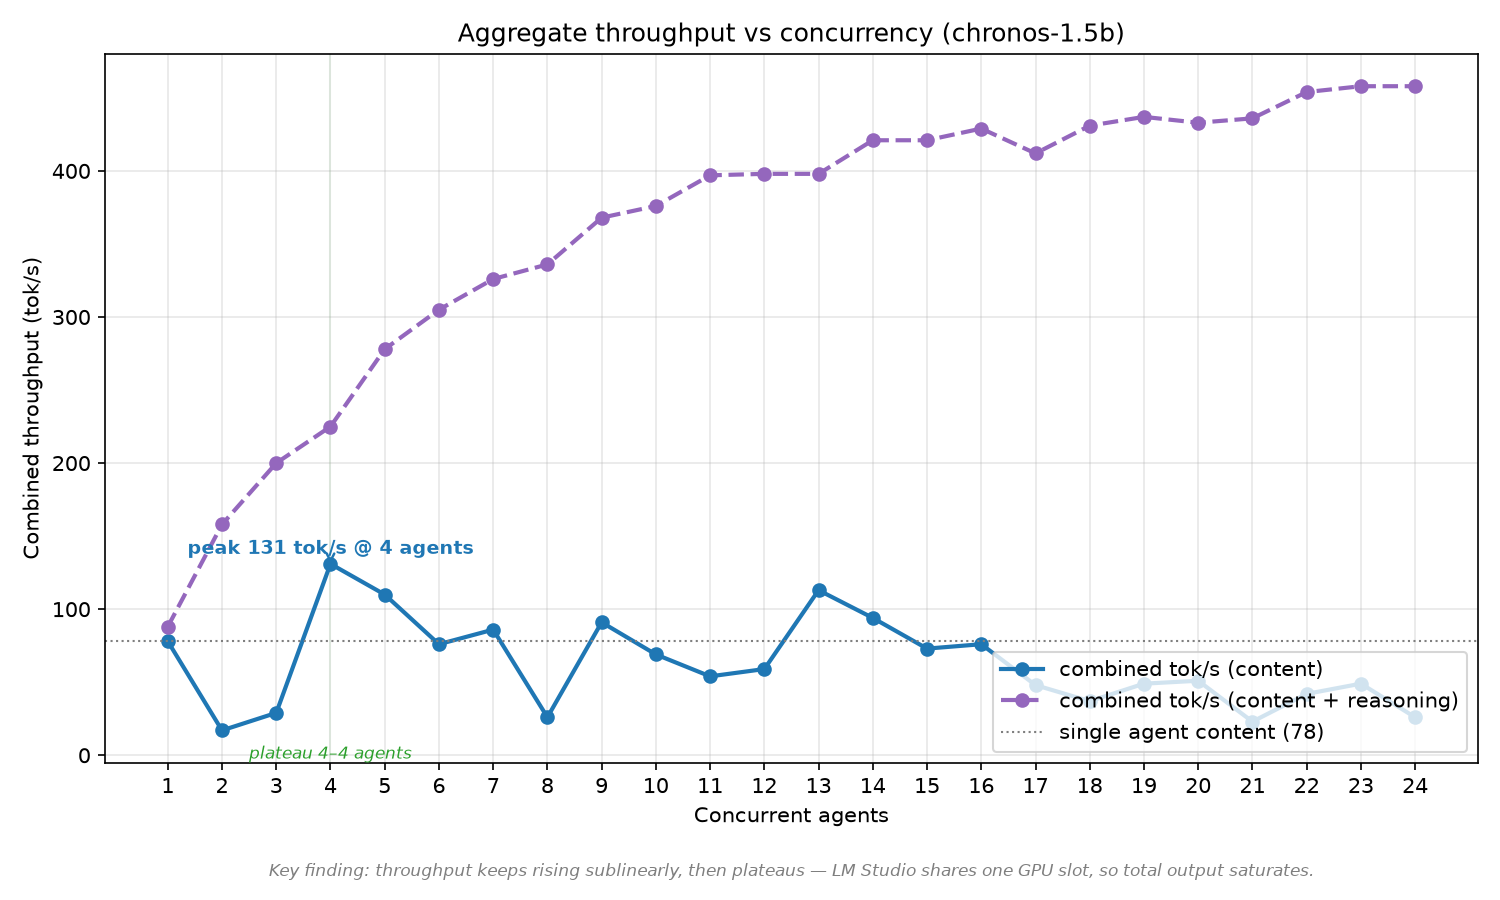
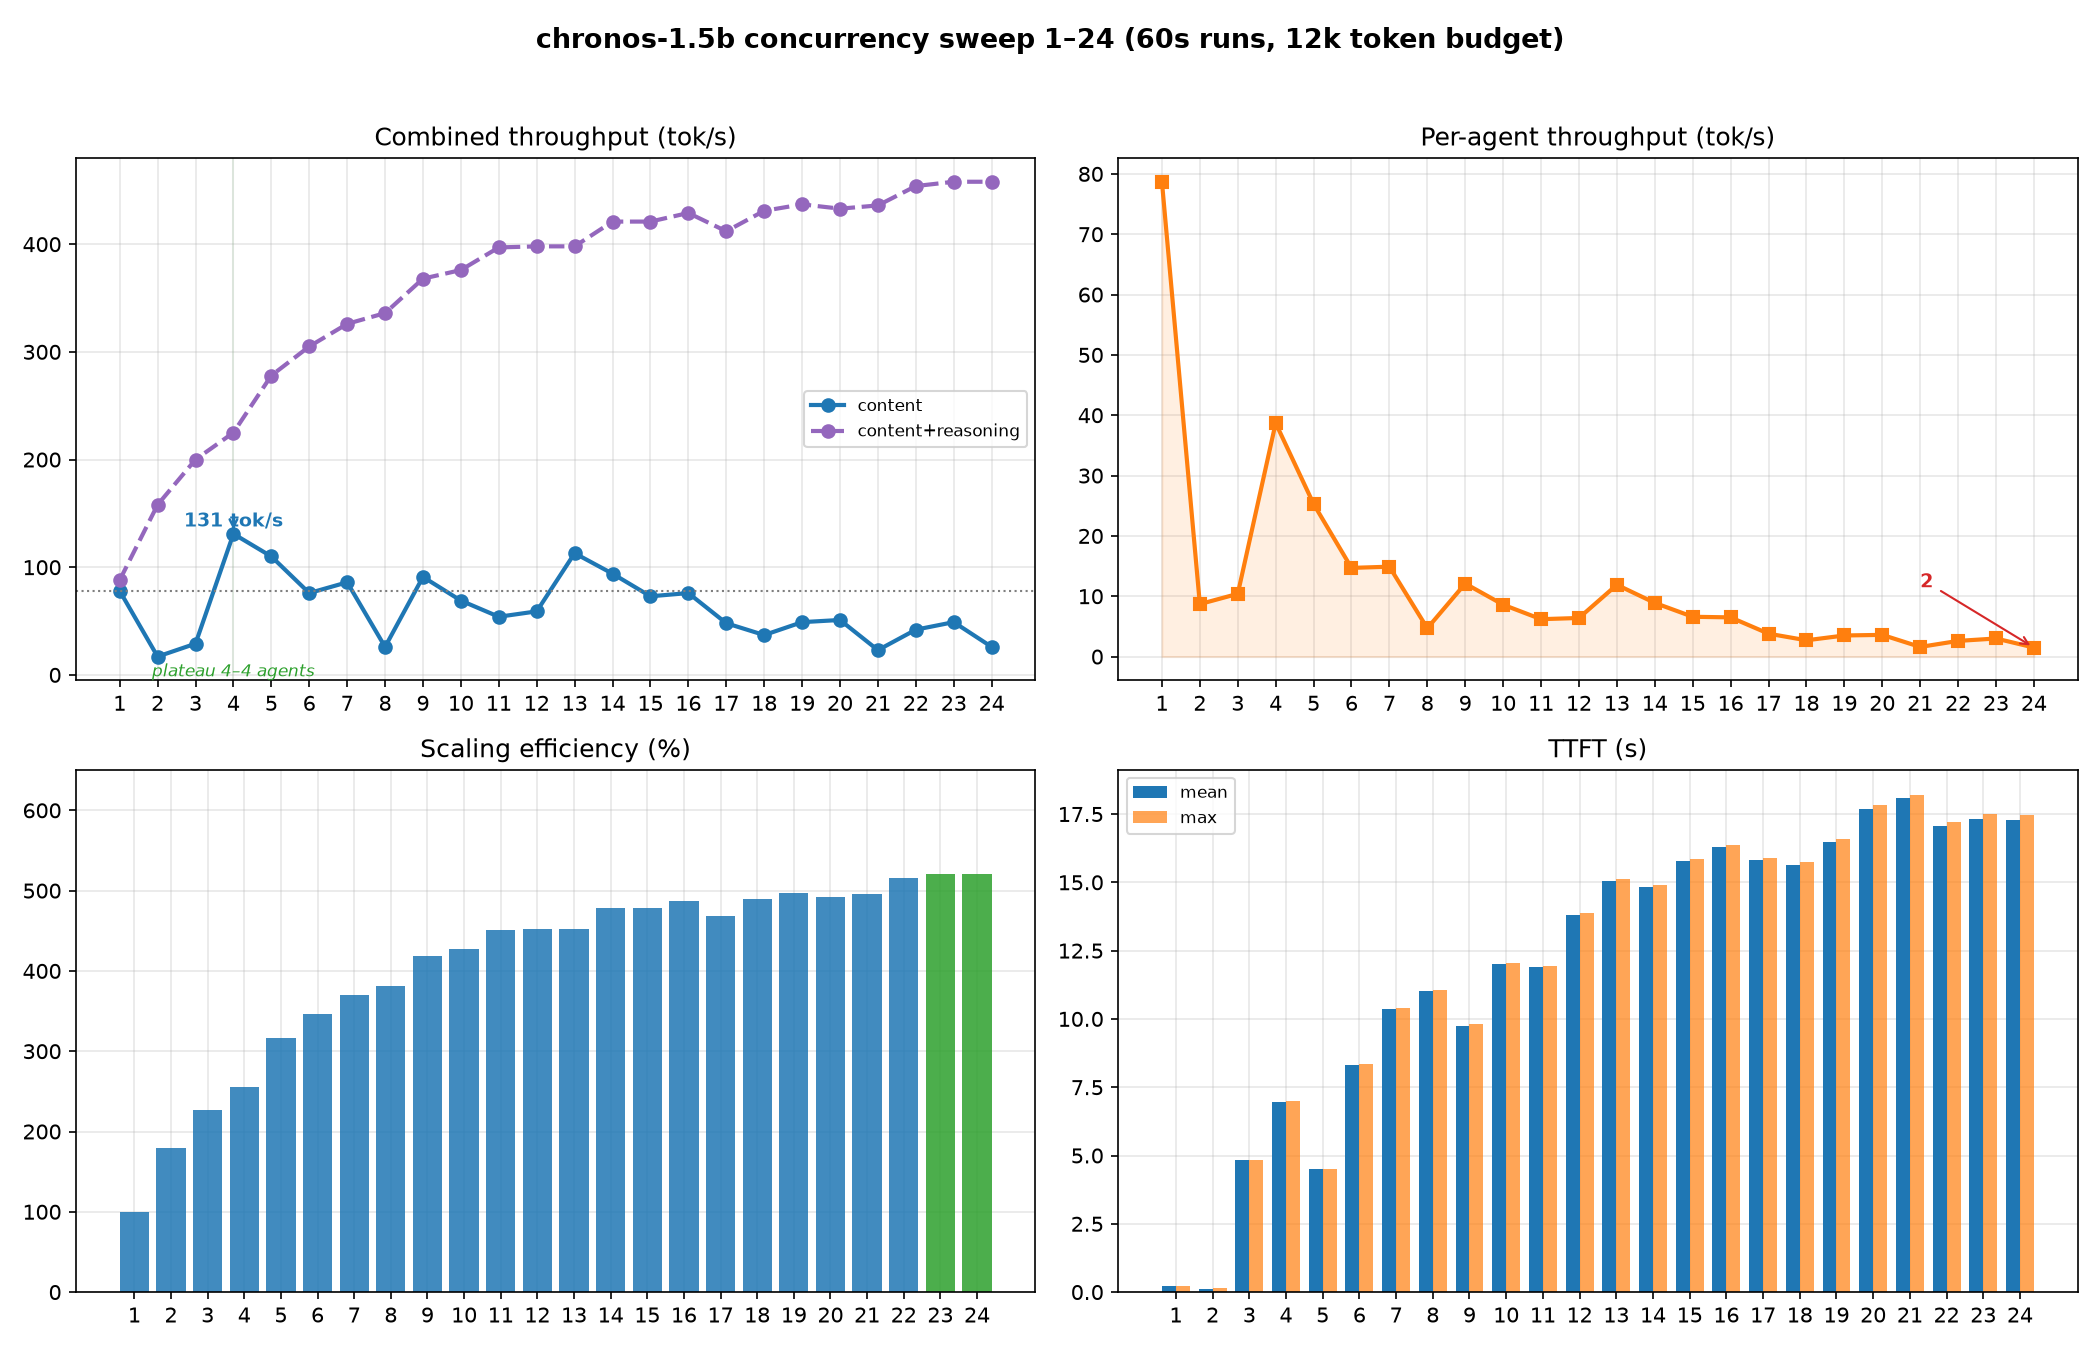
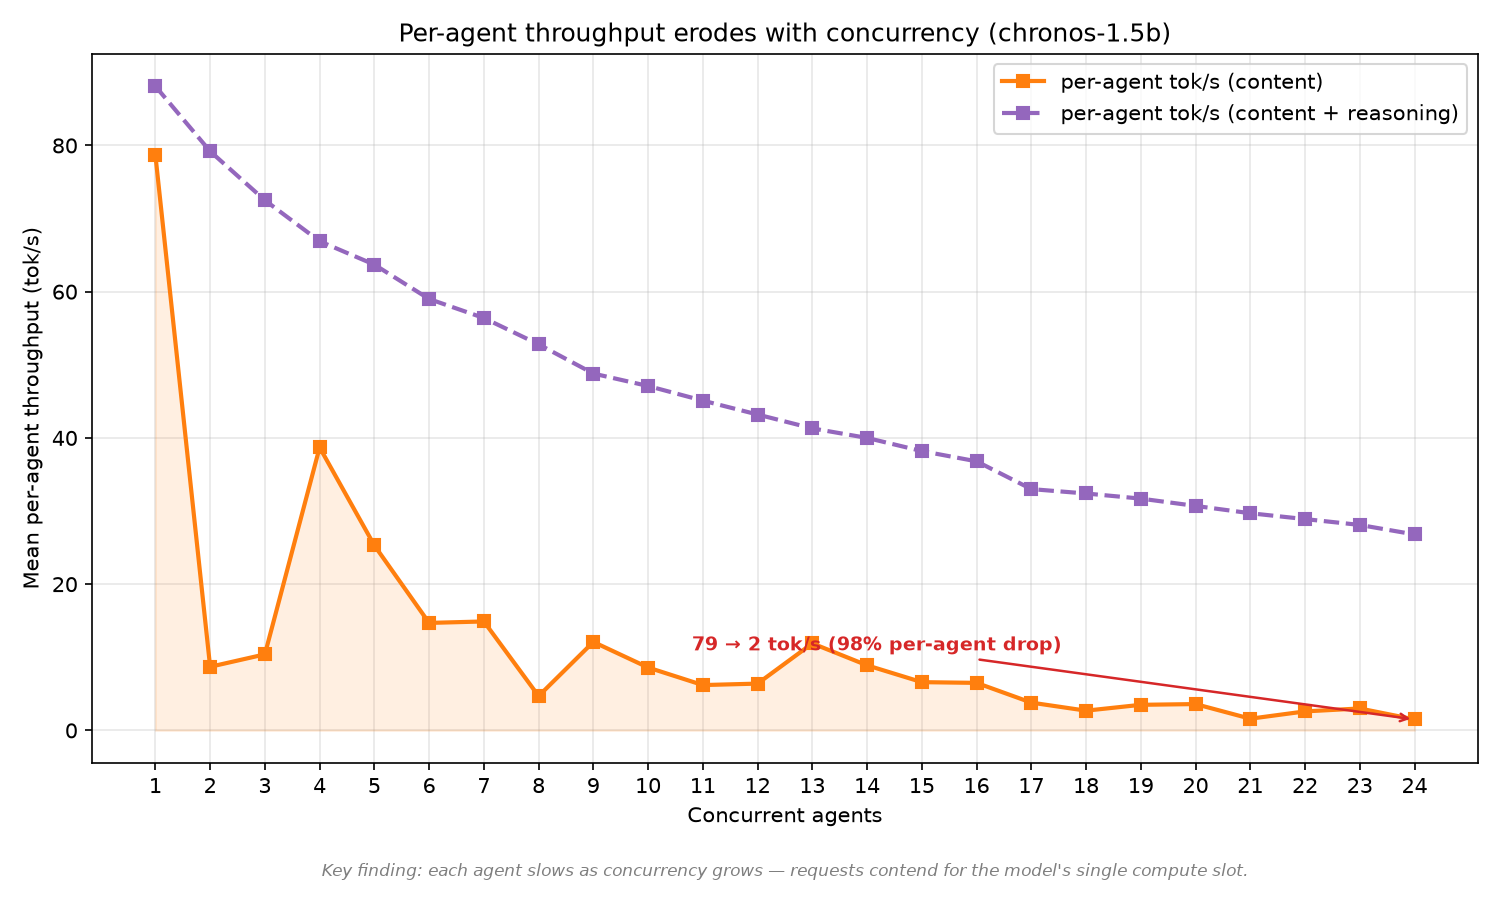
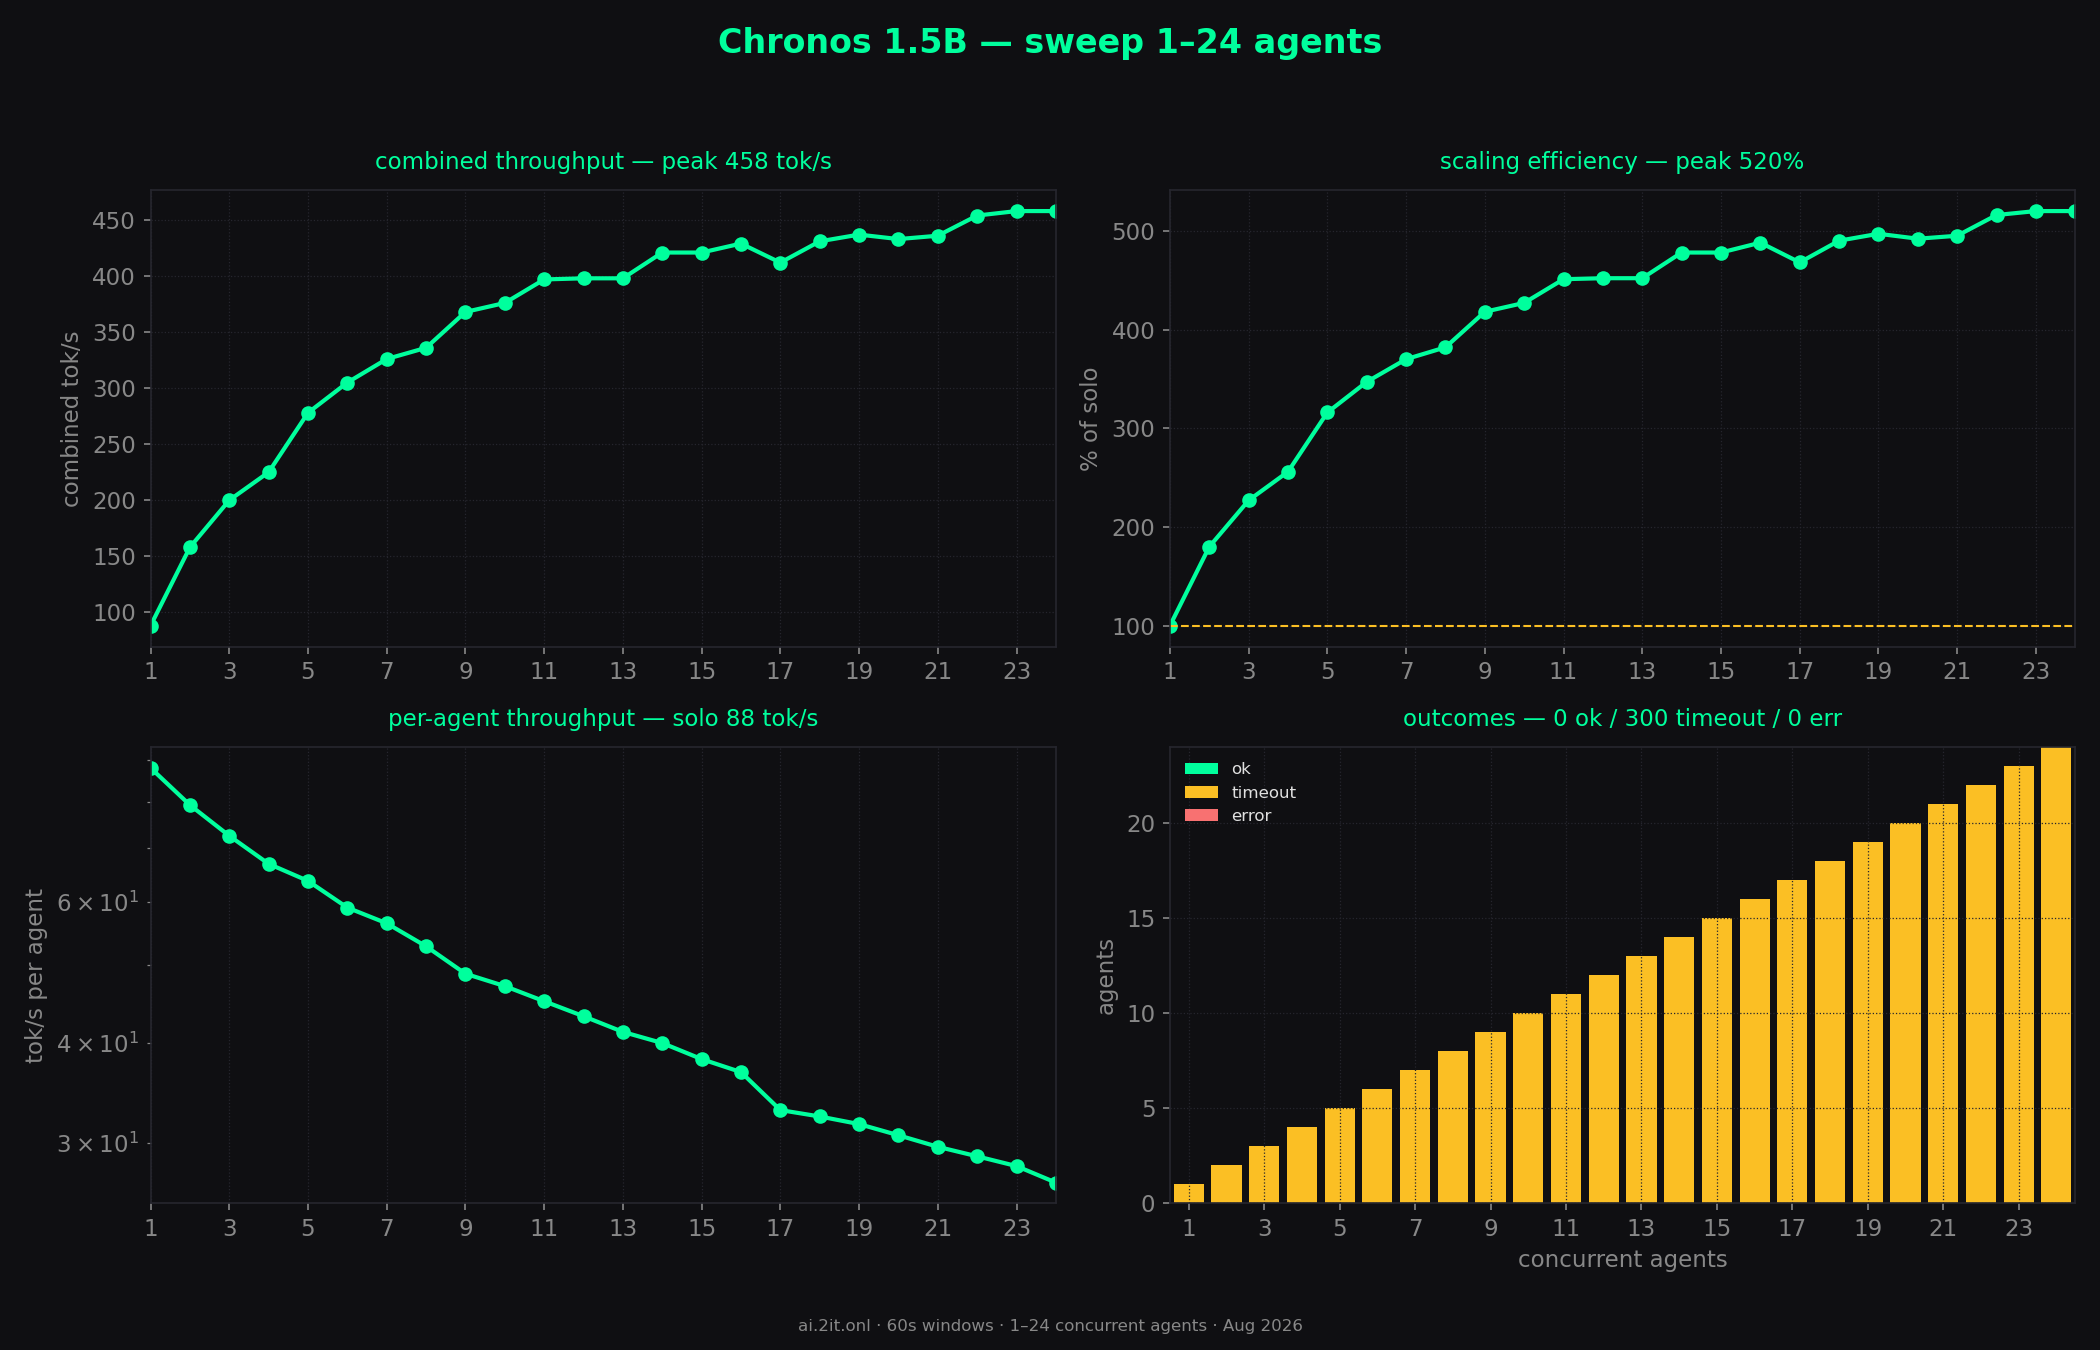
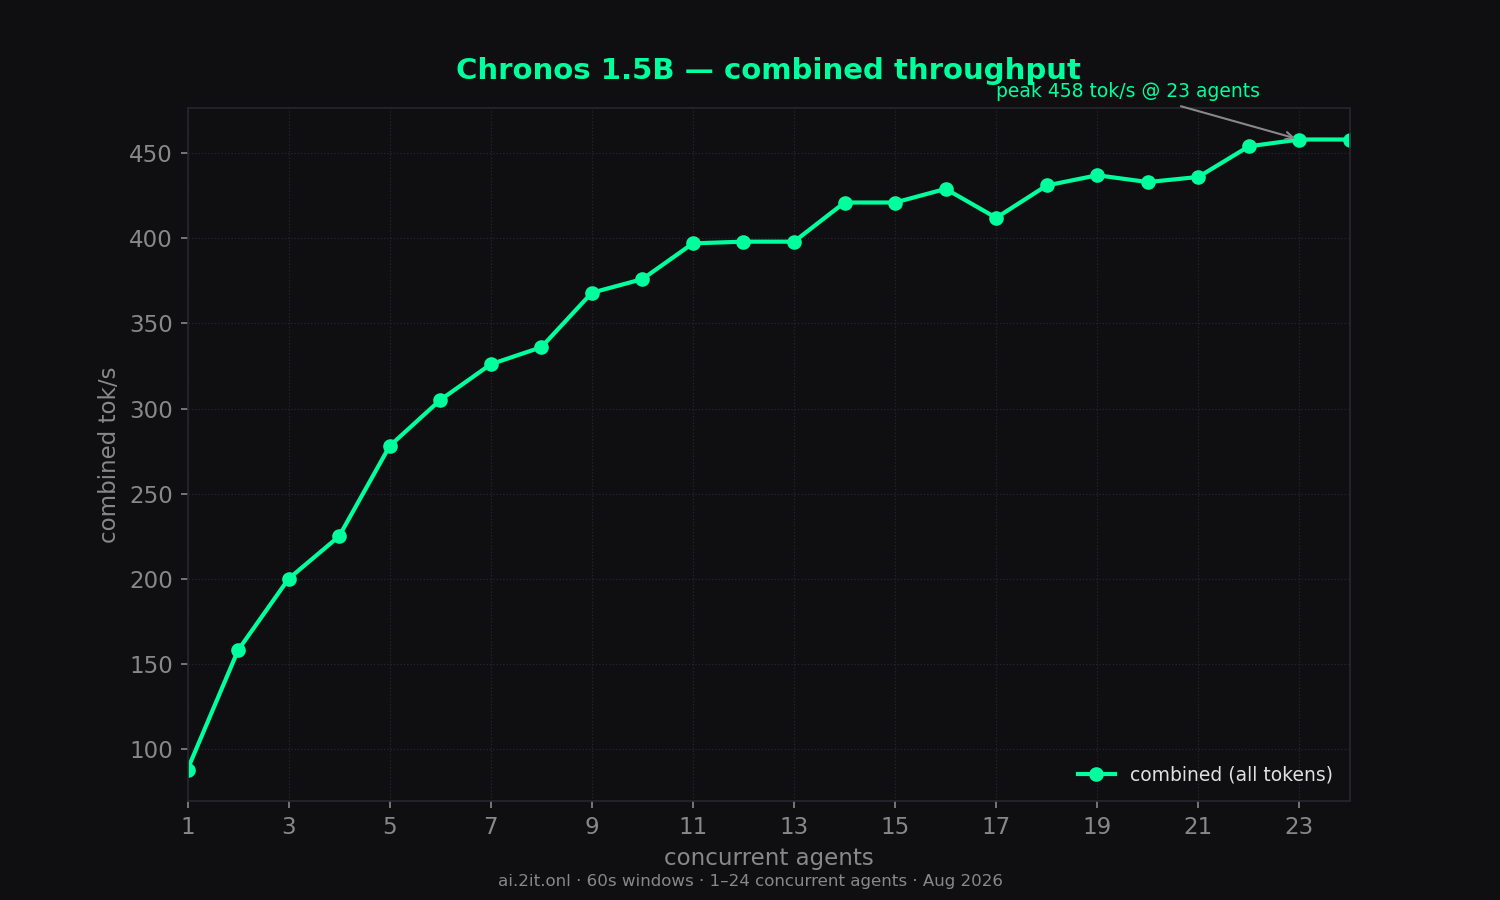
- The slowest model tested: only 88 tok/s solo (content 78), and combined all-token throughput tops out at just 458 tok/s at 24 agents — far below every other model (llama 652, falcon3 839, qwen-deepseek 829, minicpm 983).
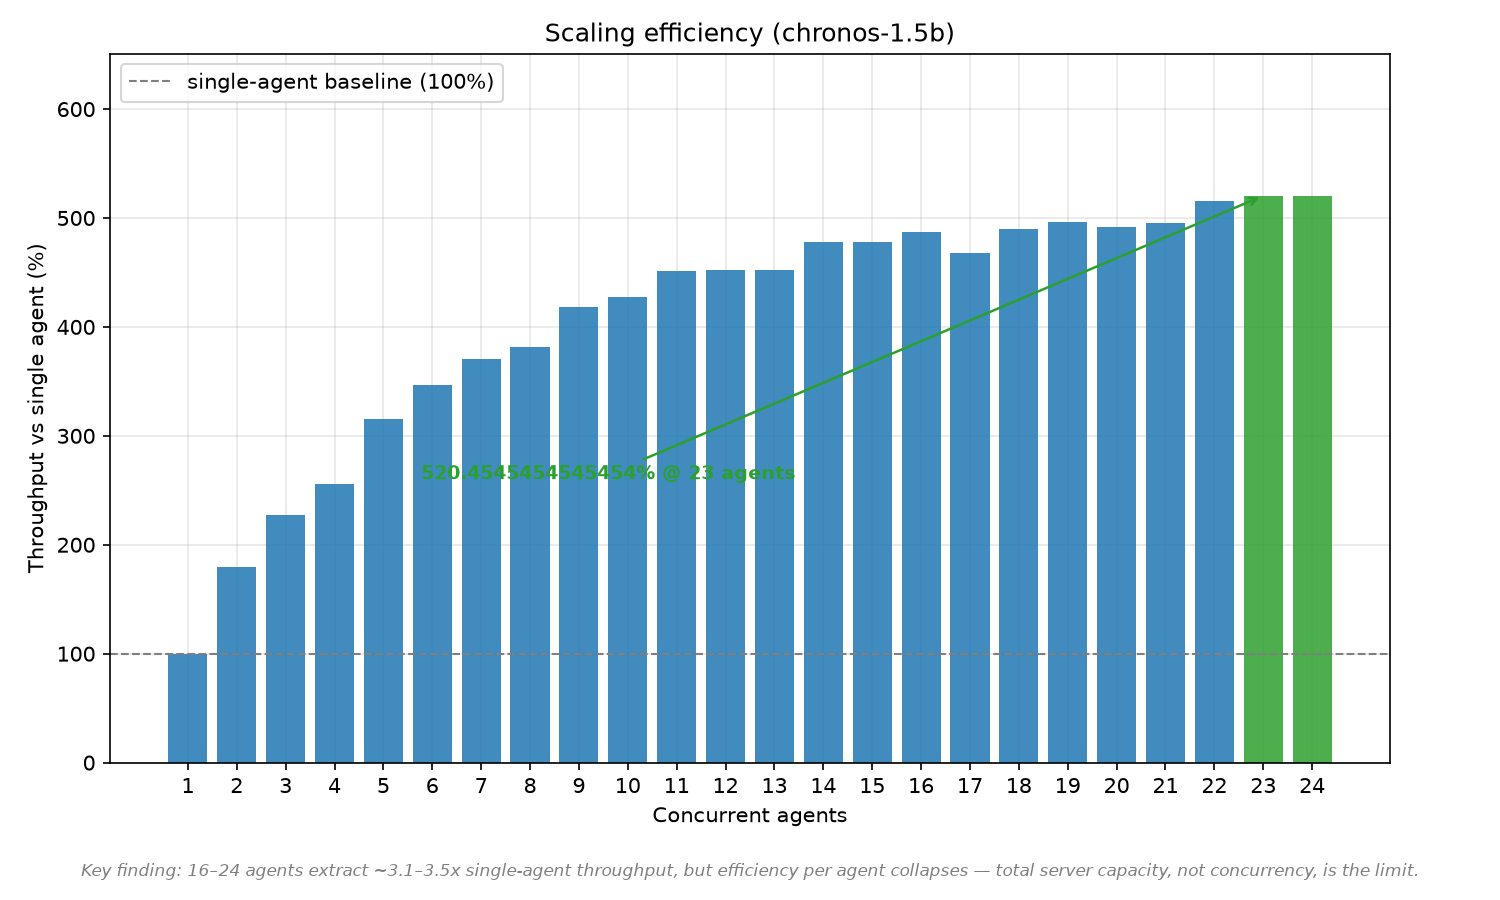
- Impressive relative scaling (520% at 23–24) — but that's mostly because the single-agent baseline is so low.
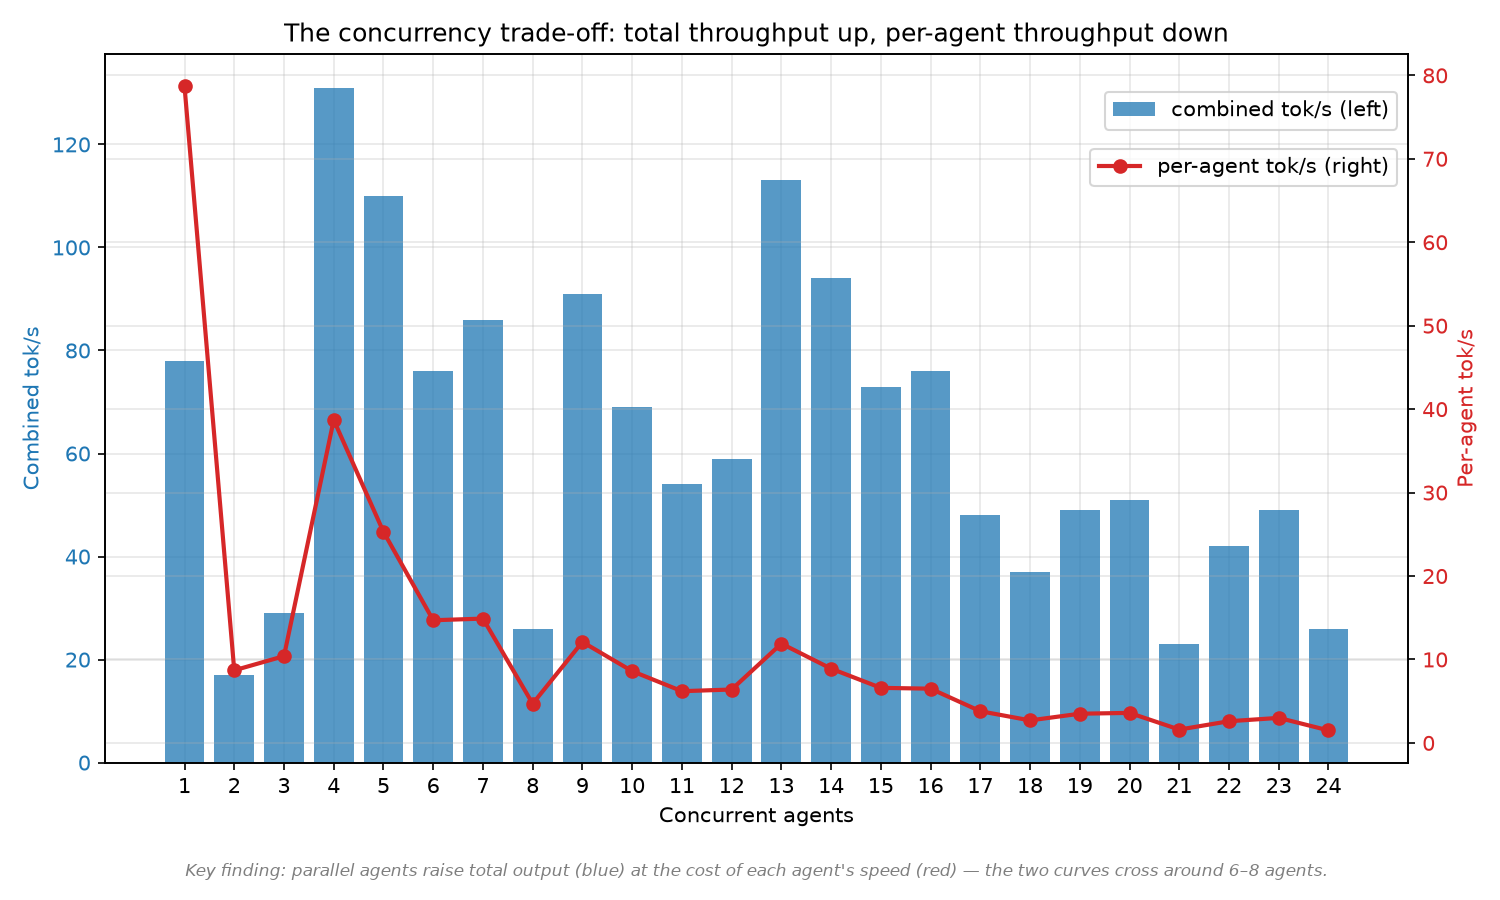
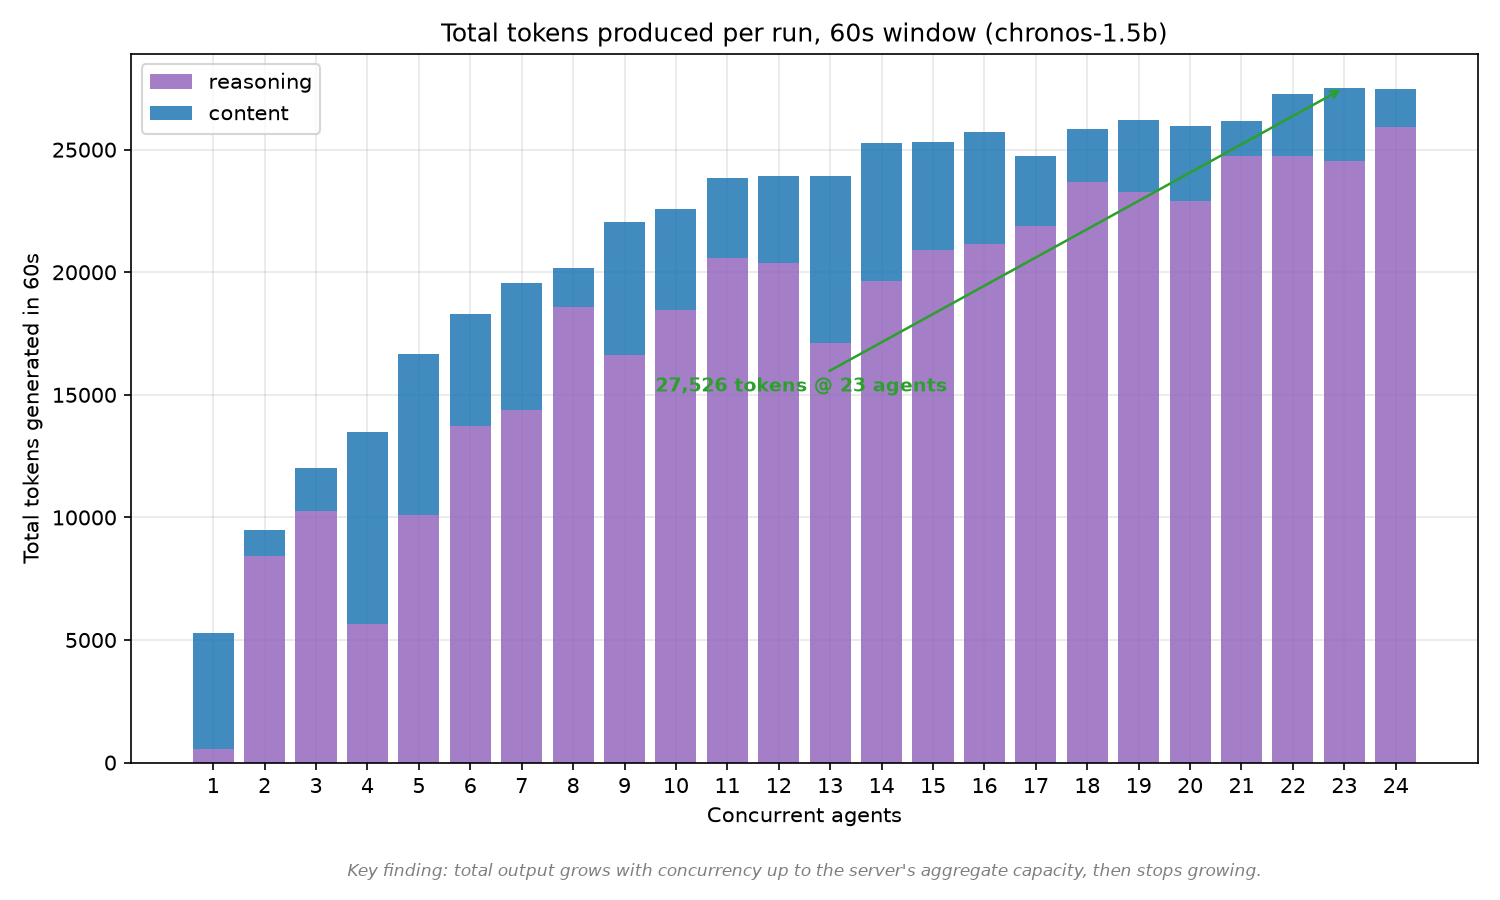
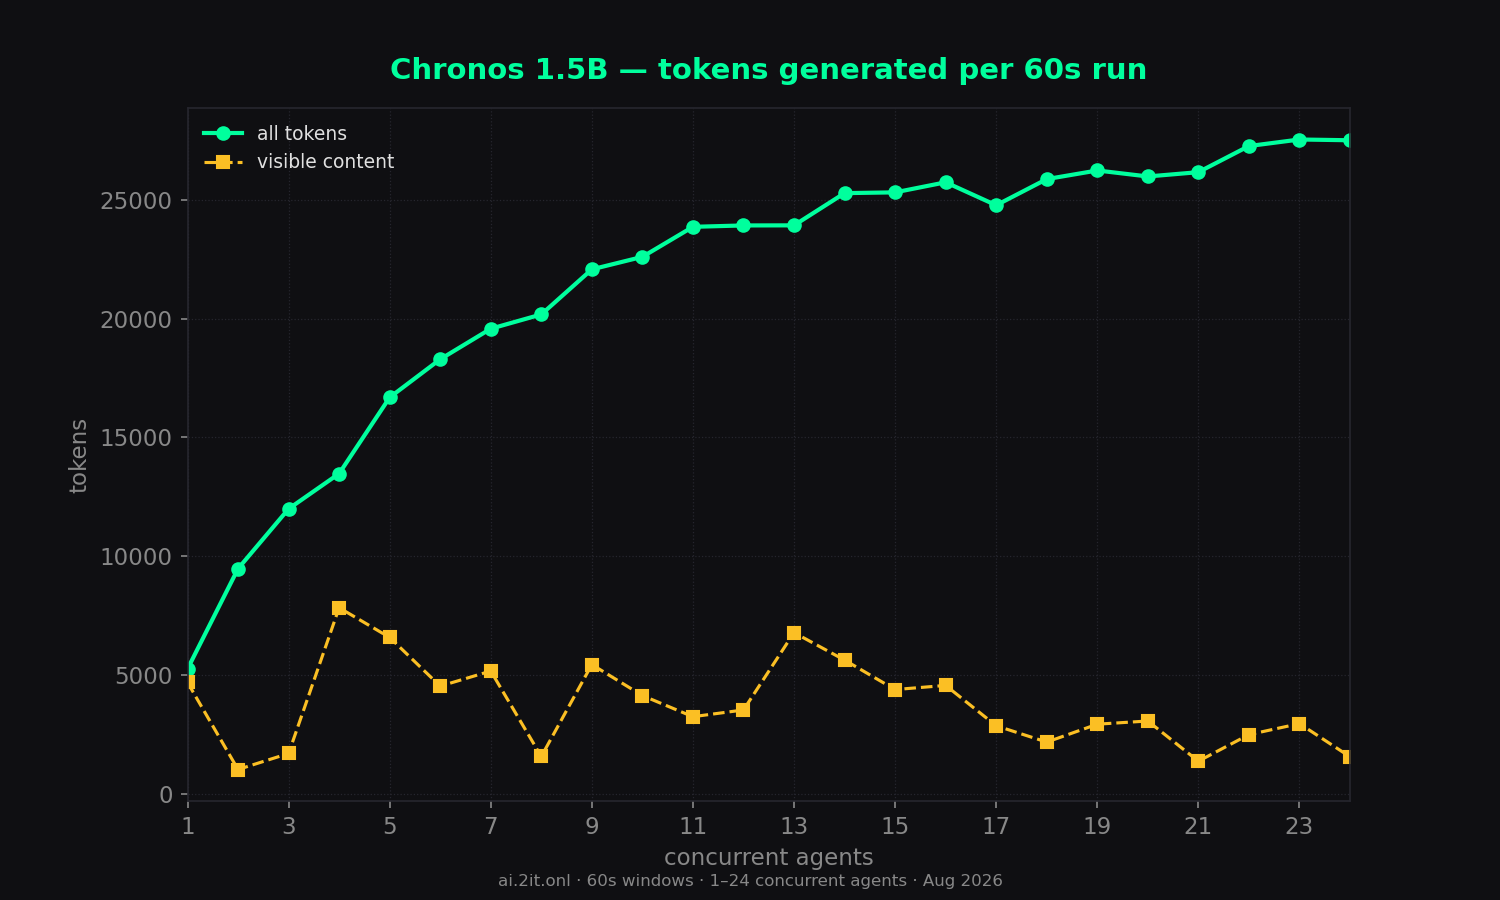
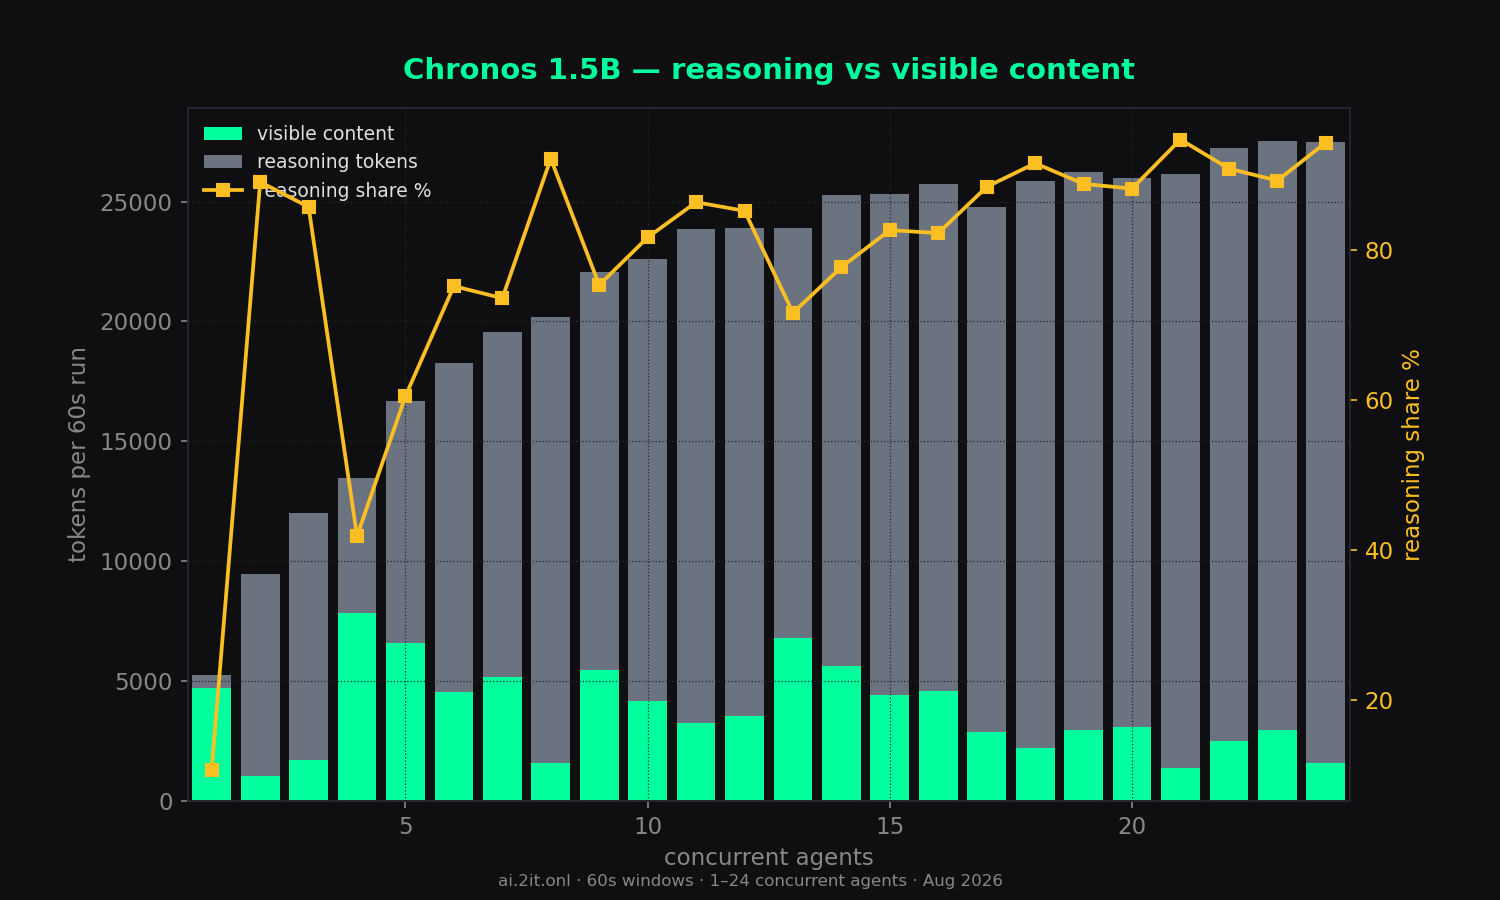
- Reasoning dominates under load: content-only throughput is tiny at high concurrency (26 tok/s at 24) — ~94% of output is hidden
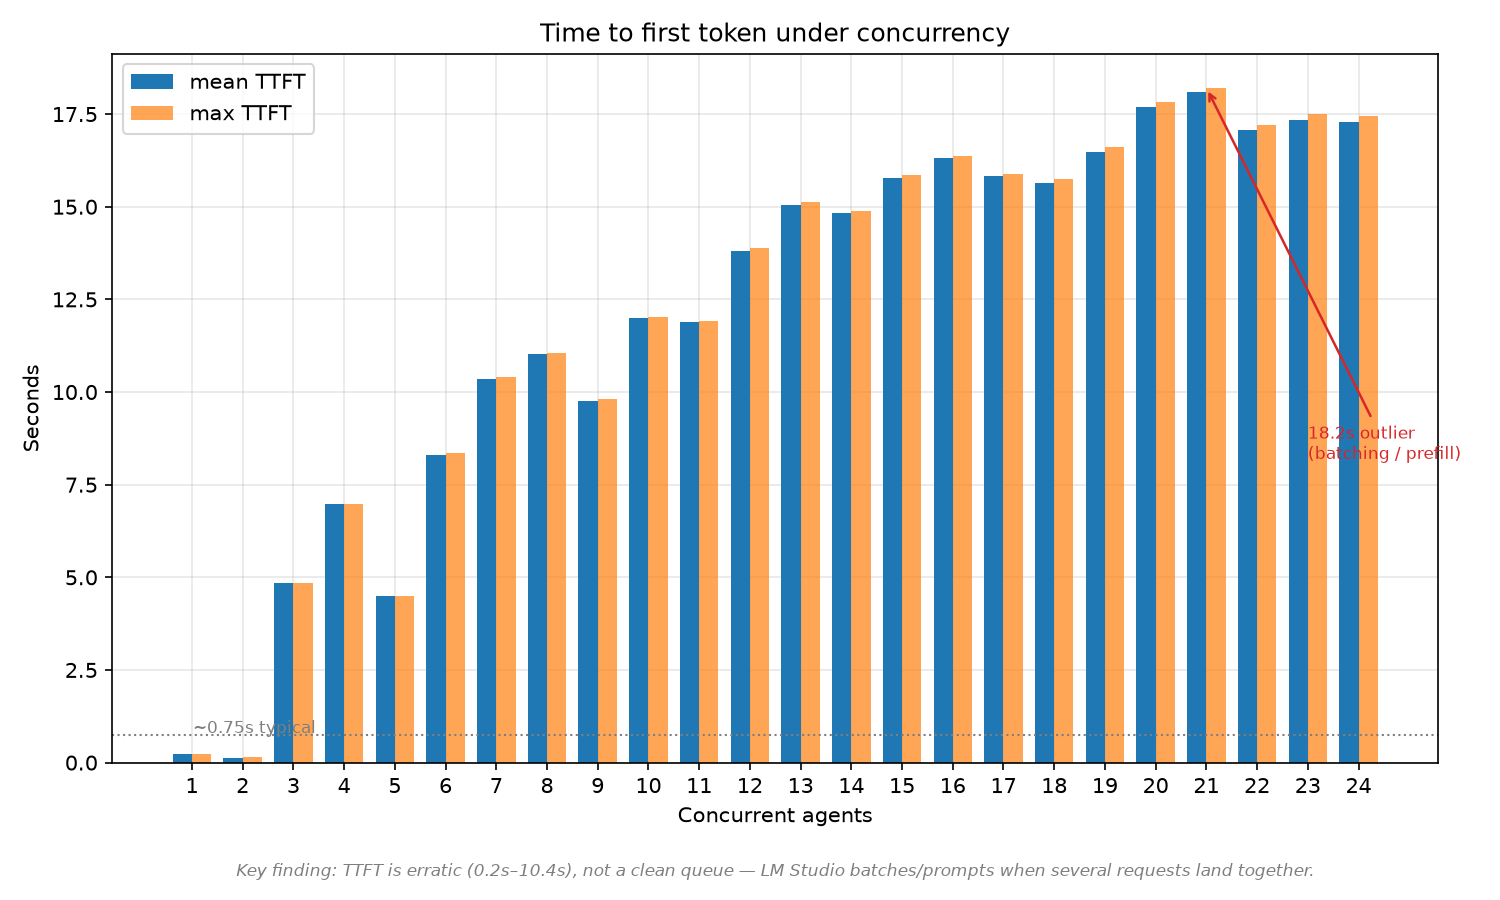
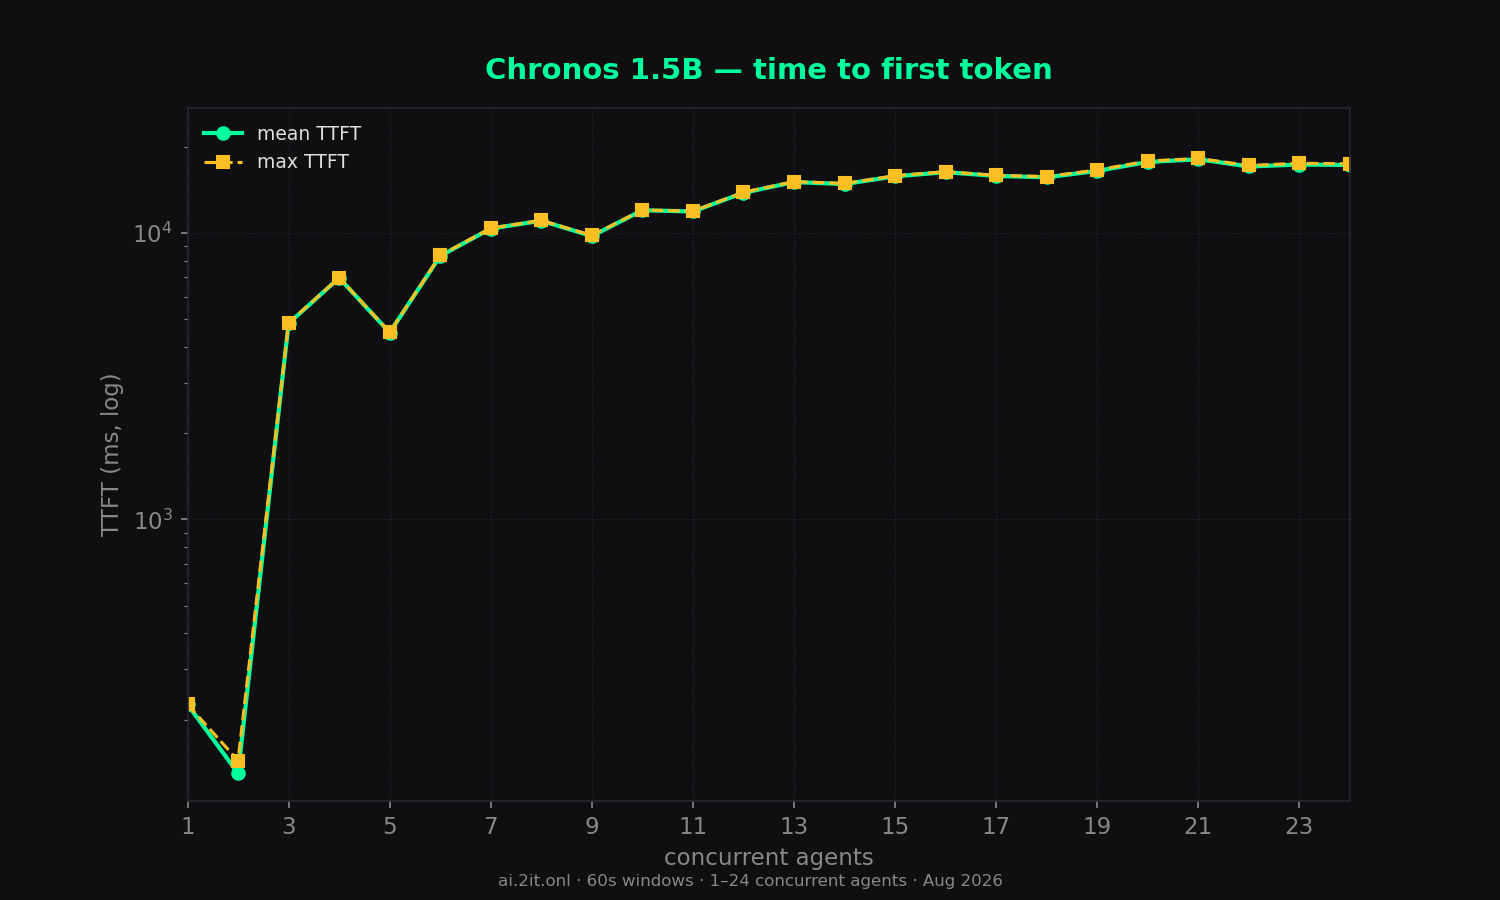
reasoning_content(25k–26k reasoning tokens per run at 22–24 agents). - TTFT degrades steadily: 226ms solo → 17–18s at 20–24 agents.
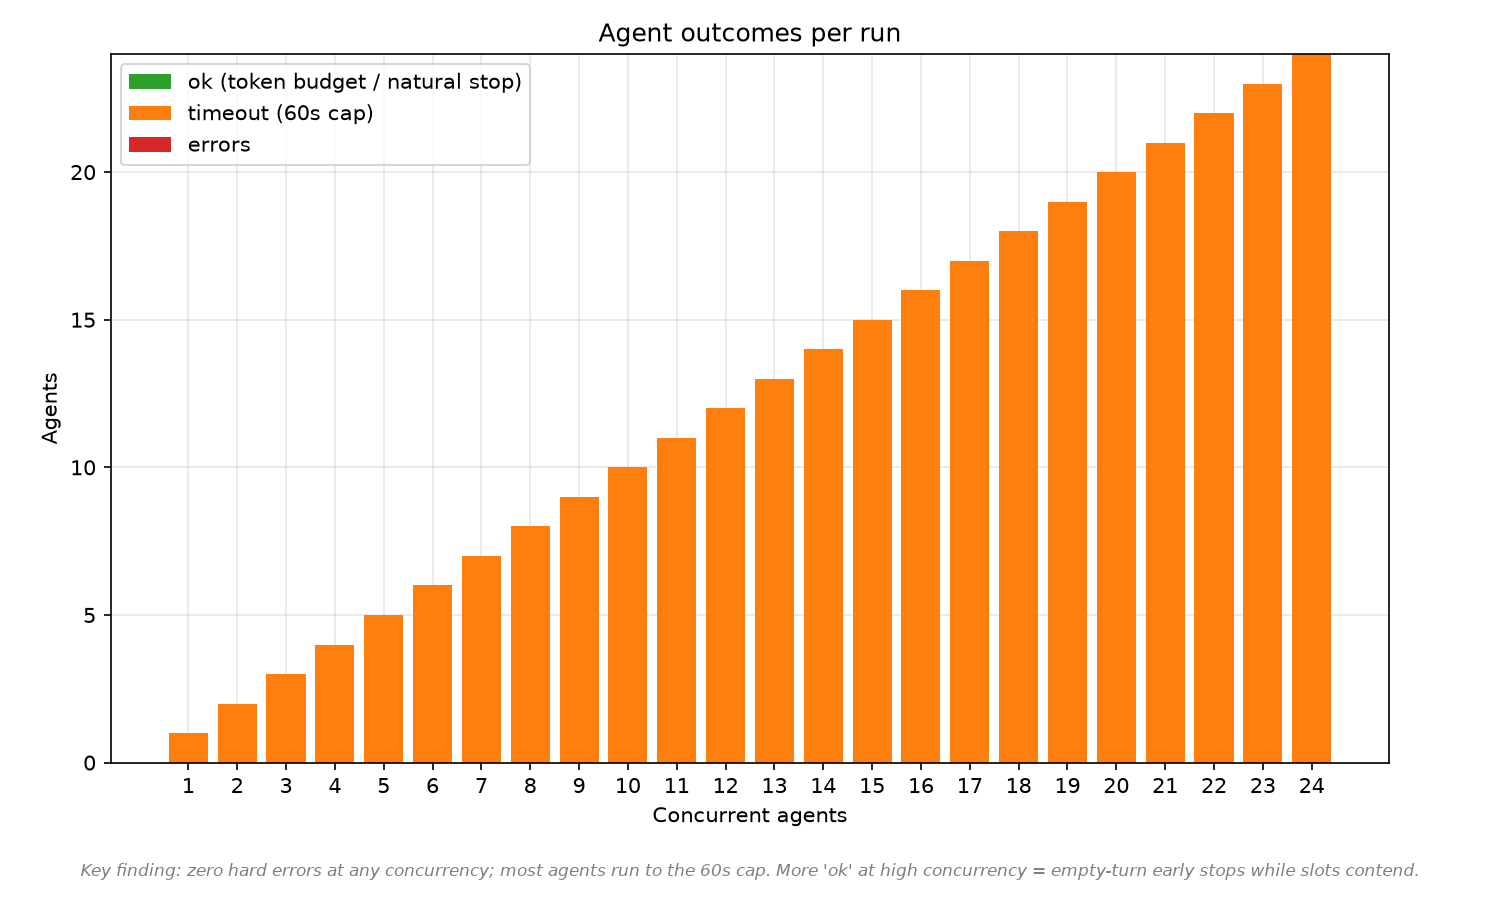
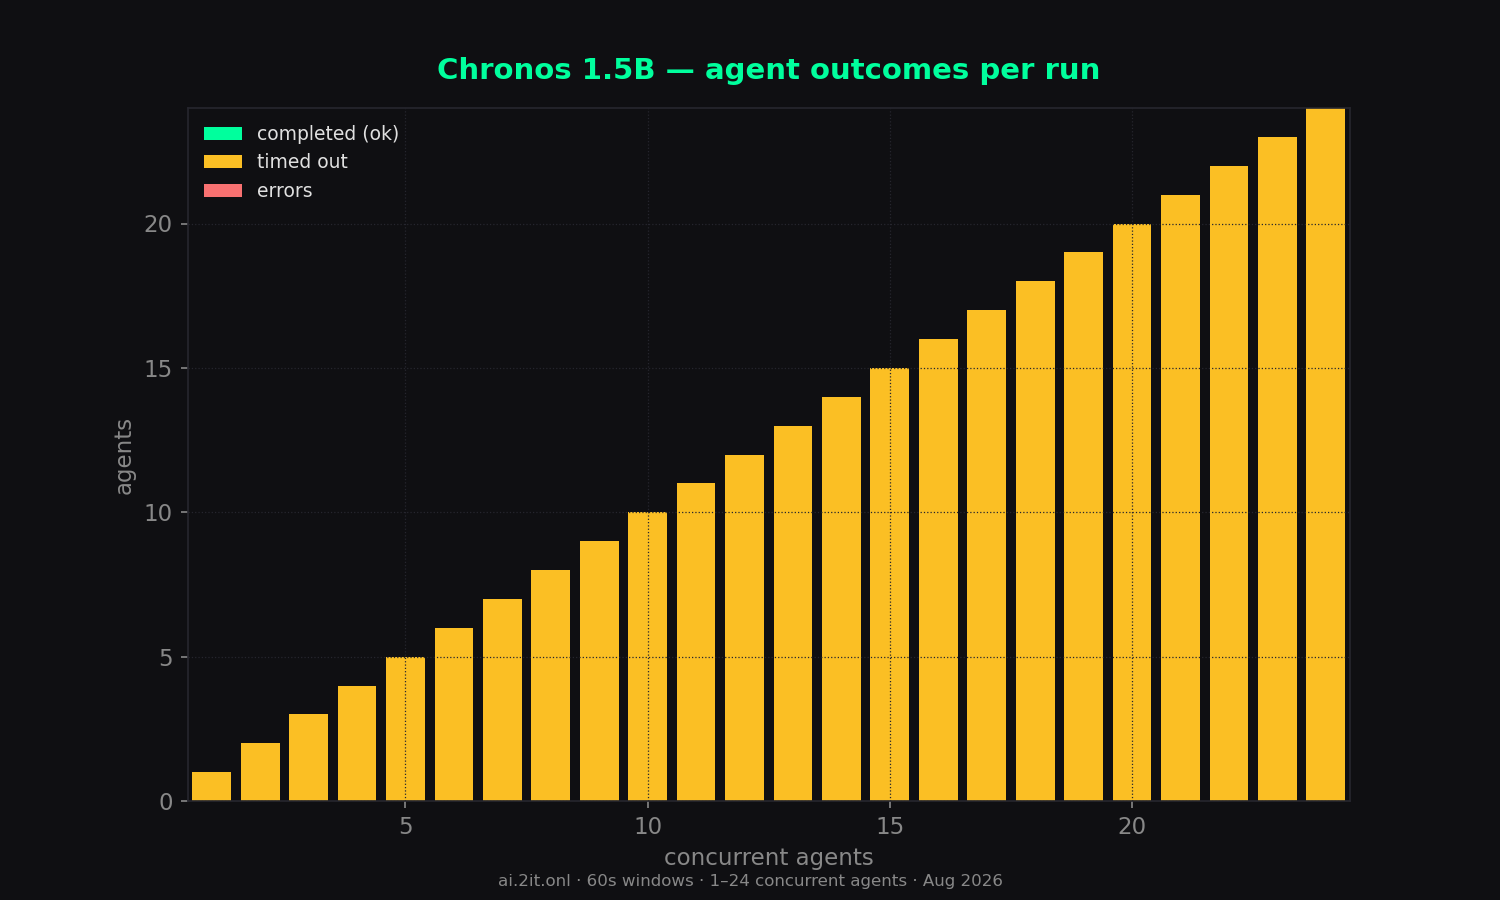
- Errors: 0 across all 24 runs.
Sweep — total concurrency 1–24
| agents | wall (s) | content | reason | total | comb tok/s | comb all | per-agent | per-agent all | scale % | TTFT mean | TTFT max | ok | timeout | err |
|---|---|---|---|---|---|---|---|---|---|---|---|---|---|---|
| 1 | 60.0 | 4,703 | 565 | 5,268 | 78 | 88 | 78.7 | 88.1 | 100% | 226ms | 226ms | 0 | 1 | 0 |
| 2 | 60.0 | 1,042 | 8,442 | 9,484 | 17 | 158 | 8.7 | 79.2 | 180% | 130ms | 144ms | 0 | 2 | 0 |
| 3 | 60.0 | 1,716 | 10,283 | 11,999 | 29 | 200 | 10.4 | 72.5 | 227% | 4.8s | 4.9s | 0 | 3 | 0 |
| 4 | 60.0 | 7,843 | 5,639 | 13,482 | 131 | 225 | 38.7 | 66.9 | 256% | 7.0s | 7.0s | 0 | 4 | 0 |
| 5 | 60.0 | 6,593 | 10,091 | 16,684 | 110 | 278 | 25.3 | 63.7 | 316% | 4.5s | 4.5s | 0 | 5 | 0 |
| 6 | 60.0 | 4,546 | 13,742 | 18,288 | 76 | 305 | 14.7 | 59.0 | 347% | 8.3s | 8.4s | 0 | 6 | 0 |
| 7 | 60.0 | 5,181 | 14,391 | 19,572 | 86 | 326 | 14.9 | 56.4 | 370% | 10.4s | 10.4s | 0 | 7 | 0 |
| 8 | 60.0 | 1,589 | 18,583 | 20,172 | 26 | 336 | 4.7 | 52.8 | 382% | 11.0s | 11.1s | 0 | 8 | 0 |
| 9 | 60.0 | 5,453 | 16,614 | 22,067 | 91 | 368 | 12.1 | 48.8 | 418% | 9.8s | 9.8s | 0 | 9 | 0 |
| 10 | 60.0 | 4,150 | 18,443 | 22,593 | 69 | 376 | 8.6 | 47.1 | 427% | 12.0s | 12.0s | 0 | 10 | 0 |
| 11 | 60.0 | 3,262 | 20,593 | 23,855 | 54 | 397 | 6.2 | 45.1 | 451% | 11.9s | 11.9s | 0 | 11 | 0 |
| 12 | 60.0 | 3,545 | 20,368 | 23,913 | 59 | 398 | 6.4 | 43.2 | 452% | 13.8s | 13.9s | 0 | 12 | 0 |
| 13 | 60.0 | 6,796 | 17,121 | 23,917 | 113 | 398 | 11.9 | 41.3 | 452% | 15.1s | 15.1s | 0 | 13 | 0 |
| 14 | 60.0 | 5,642 | 19,629 | 25,271 | 94 | 421 | 8.9 | 40.0 | 478% | 14.8s | 14.9s | 0 | 14 | 0 |
| 15 | 60.0 | 4,402 | 20,902 | 25,304 | 73 | 421 | 6.6 | 38.2 | 478% | 15.8s | 15.8s | 0 | 15 | 0 |
| 16 | 60.0 | 4,577 | 21,150 | 25,727 | 76 | 429 | 6.5 | 36.8 | 488% | 16.3s | 16.4s | 0 | 16 | 0 |
| 17 | 60.0 | 2,880 | 21,882 | 24,762 | 48 | 412 | 3.8 | 33.0 | 468% | 15.8s | 15.9s | 0 | 17 | 0 |
| 18 | 60.0 | 2,194 | 23,667 | 25,861 | 37 | 431 | 2.7 | 32.4 | 490% | 15.7s | 15.7s | 0 | 18 | 0 |
| 19 | 60.0 | 2,947 | 23,277 | 26,224 | 49 | 437 | 3.5 | 31.7 | 497% | 16.5s | 16.6s | 0 | 19 | 0 |
| 20 | 60.0 | 3,081 | 22,891 | 25,972 | 51 | 433 | 3.6 | 30.7 | 492% | 17.7s | 17.8s | 0 | 20 | 0 |
| 21 | 60.0 | 1,391 | 24,762 | 26,153 | 23 | 436 | 1.6 | 29.7 | 495% | 18.1s | 18.2s | 0 | 21 | 0 |
| 22 | 60.0 | 2,508 | 24,743 | 27,251 | 42 | 454 | 2.6 | 28.9 | 516% | 17.1s | 17.2s | 0 | 22 | 0 |
| 23 peak | 60.0 | 2,971 | 24,555 | 27,526 | 49 | 458 | 3.0 | 28.1 | 520% | 17.3s | 17.5s | 0 | 23 | 0 |
| 24 | 60.0 | 1,577 | 25,917 | 27,494 | 26 | 458 | 1.5 | 26.8 | 520% | 17.3s | 17.4s | 0 | 24 | 0 |
* burst artifact — agents queued ~11–16s then generated in a short burst; the per-agent timer inflates the number. Trust combined throughput and TTFT columns. Peak row = highest combined (all-token) throughput.
Charts
Raw data & downloads
- report.md5 KB
- sweep-summary.csv2 KB
- sweep-summary.json11 KB
- combined_throughput.png124 KB · original matplotlib export
- combined_vs_per_agent.png107 KB · original matplotlib export
- dashboard_1_24.png180 KB · original matplotlib export
- outcome_breakdown.png57 KB · original matplotlib export
- per_agent_throughput.png114 KB · original matplotlib export
- reasoning_vs_content.png59 KB · original matplotlib export
- scaling_efficiency.png79 KB · original matplotlib export
- time_to_first_token.png69 KB · original matplotlib export
- total_tokens_generated.png76 KB · original matplotlib export