Llama 3.2 3B Instruct
server model id:
llama-3.2-3b-instructnon-thinkingKV Q4_0ctx 32k3B params
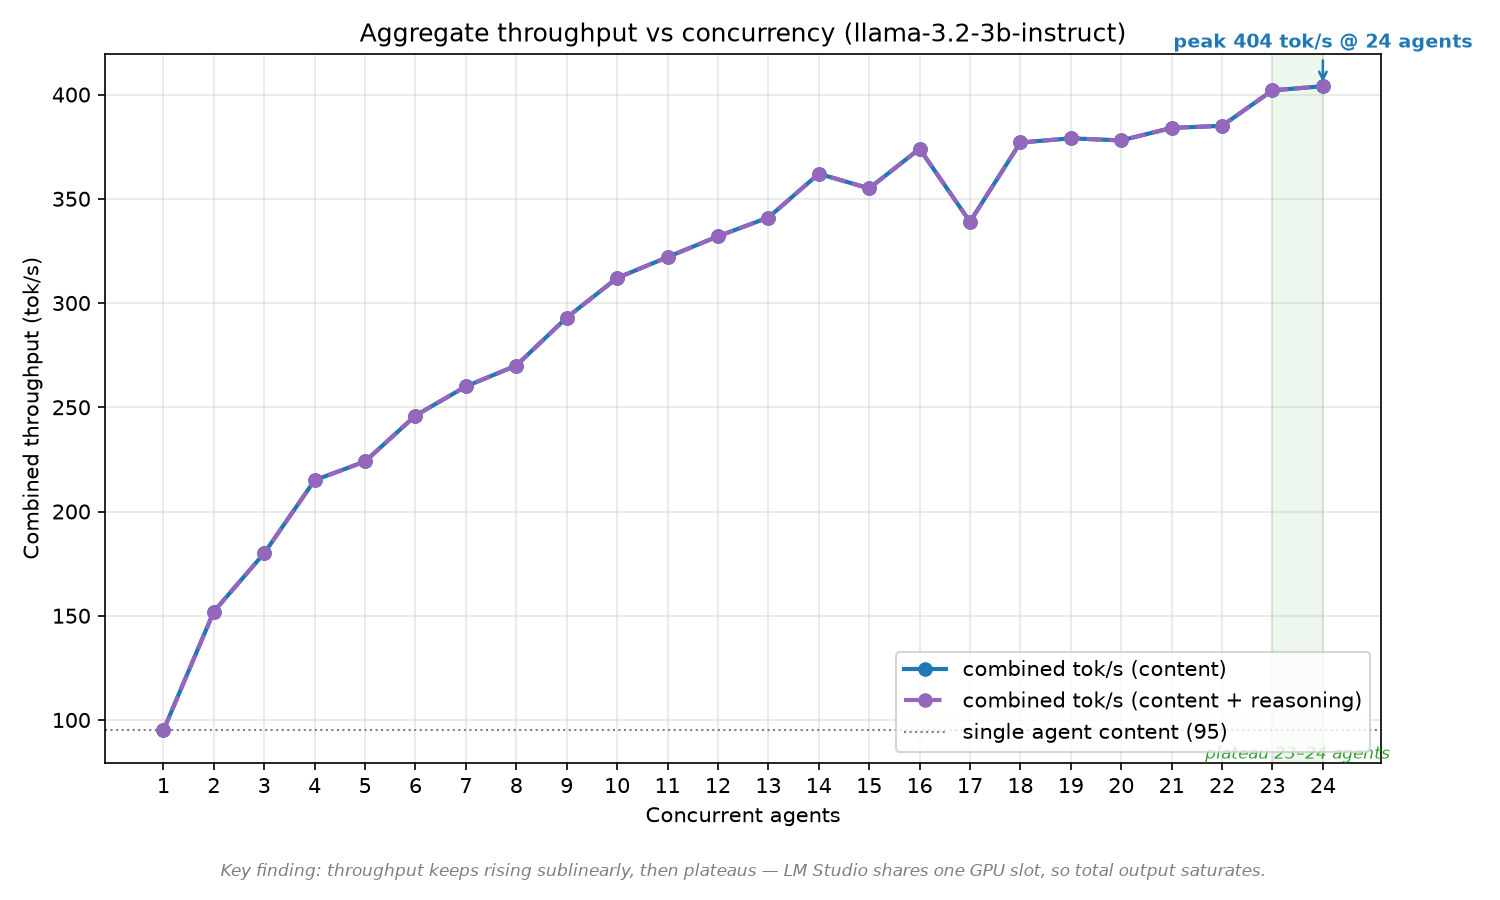
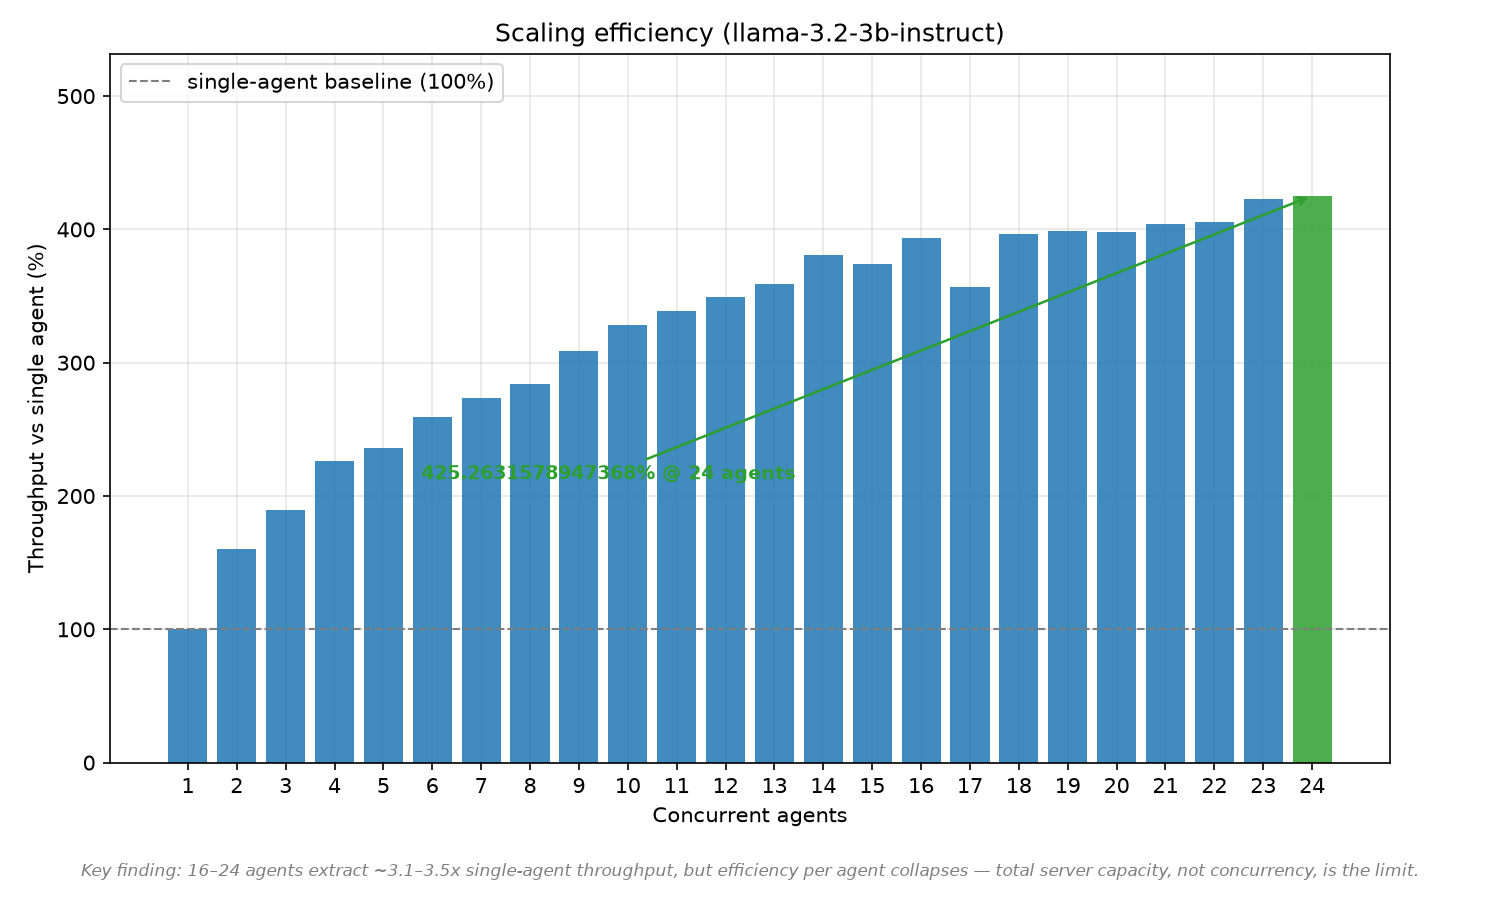
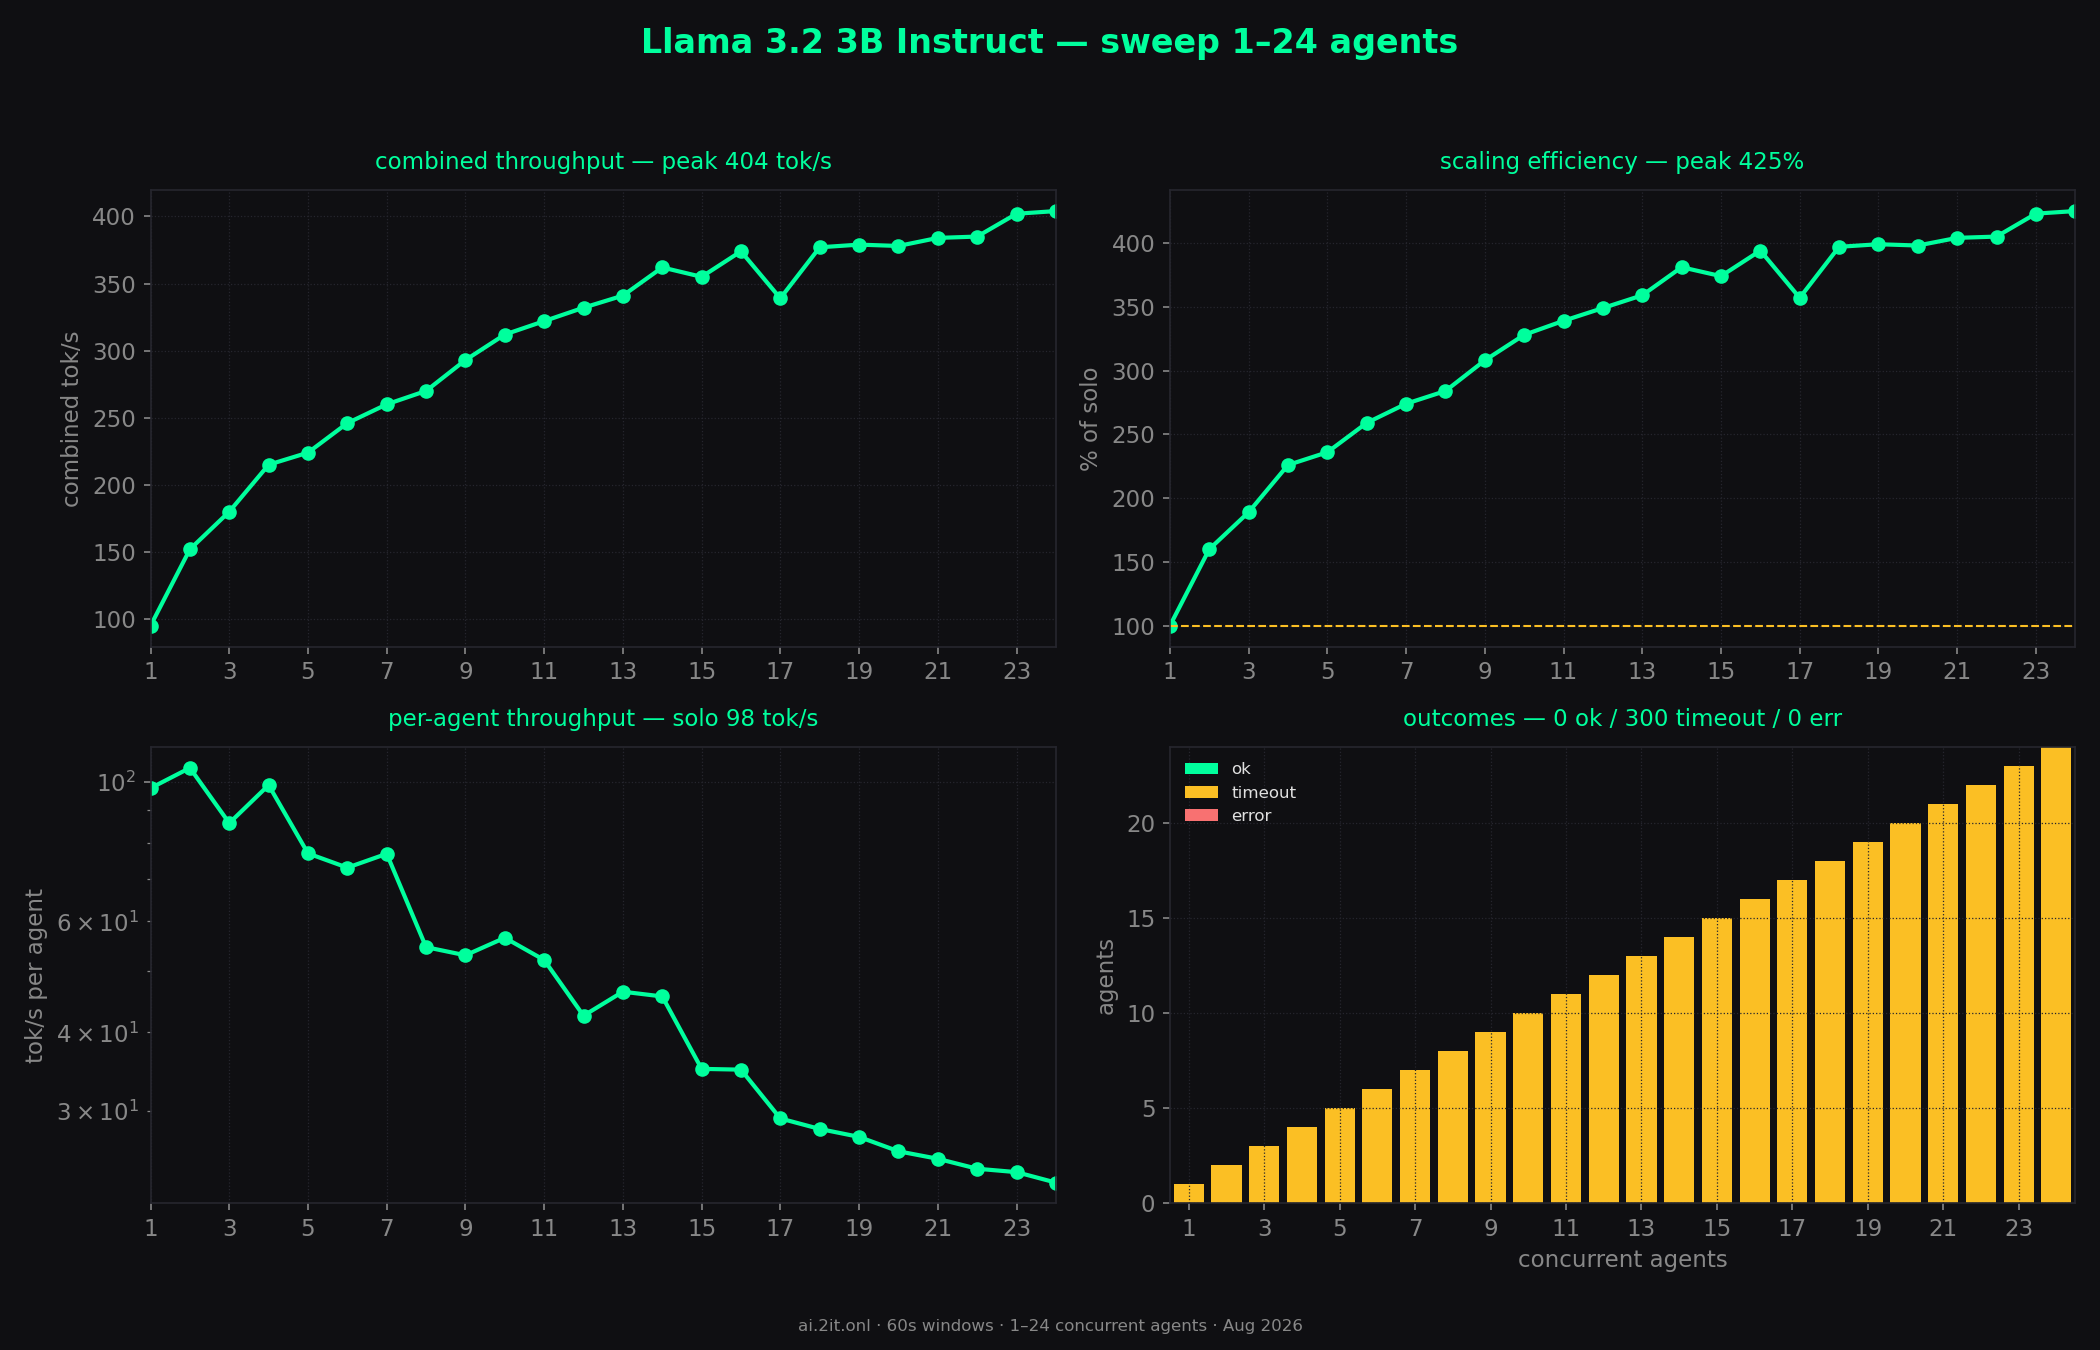
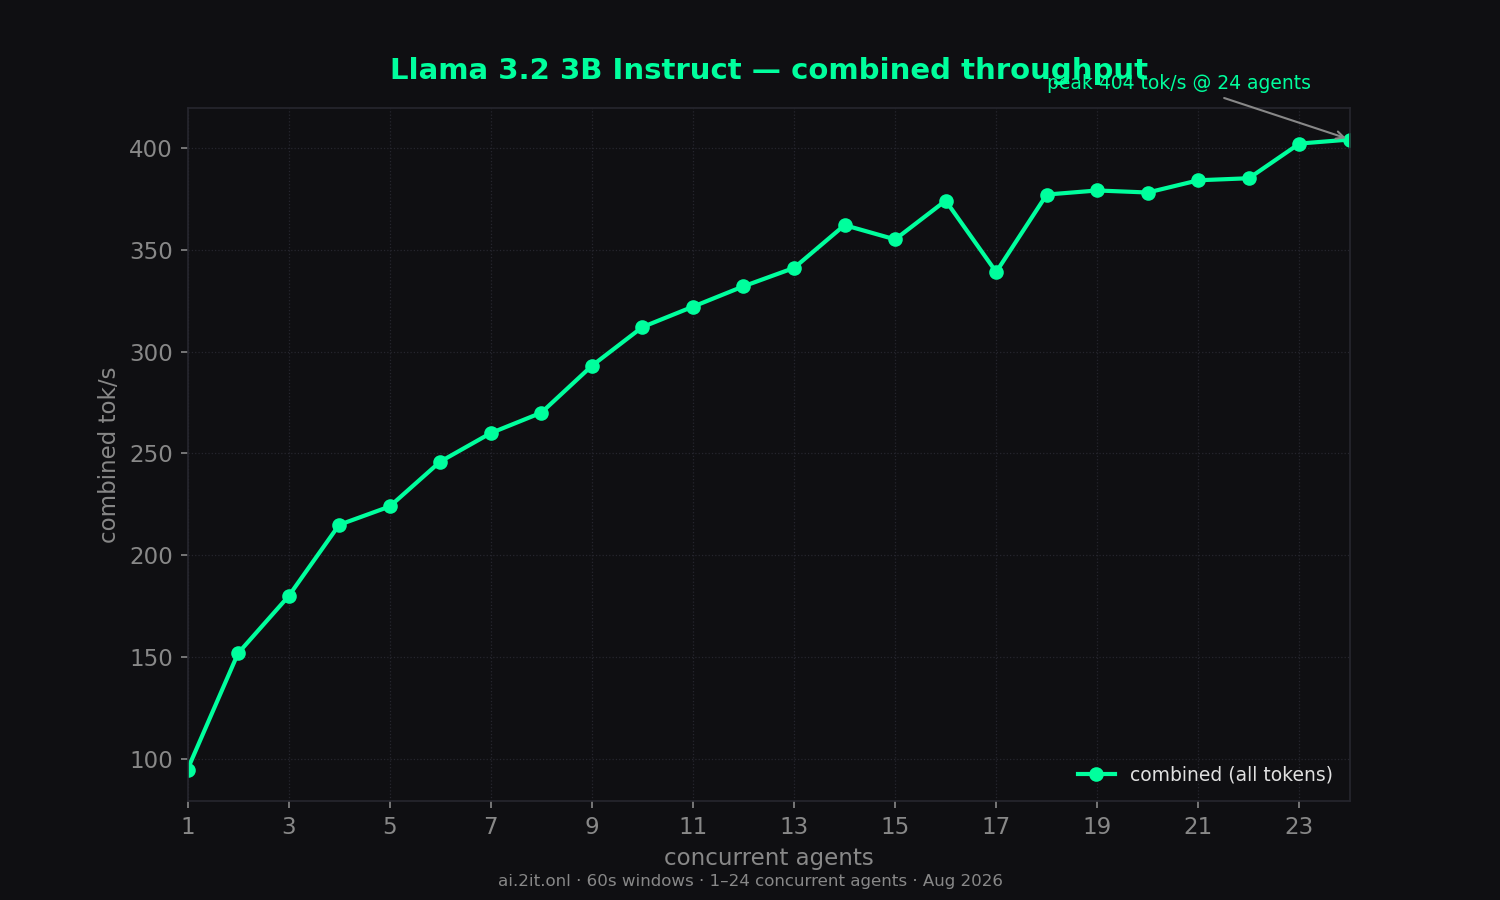
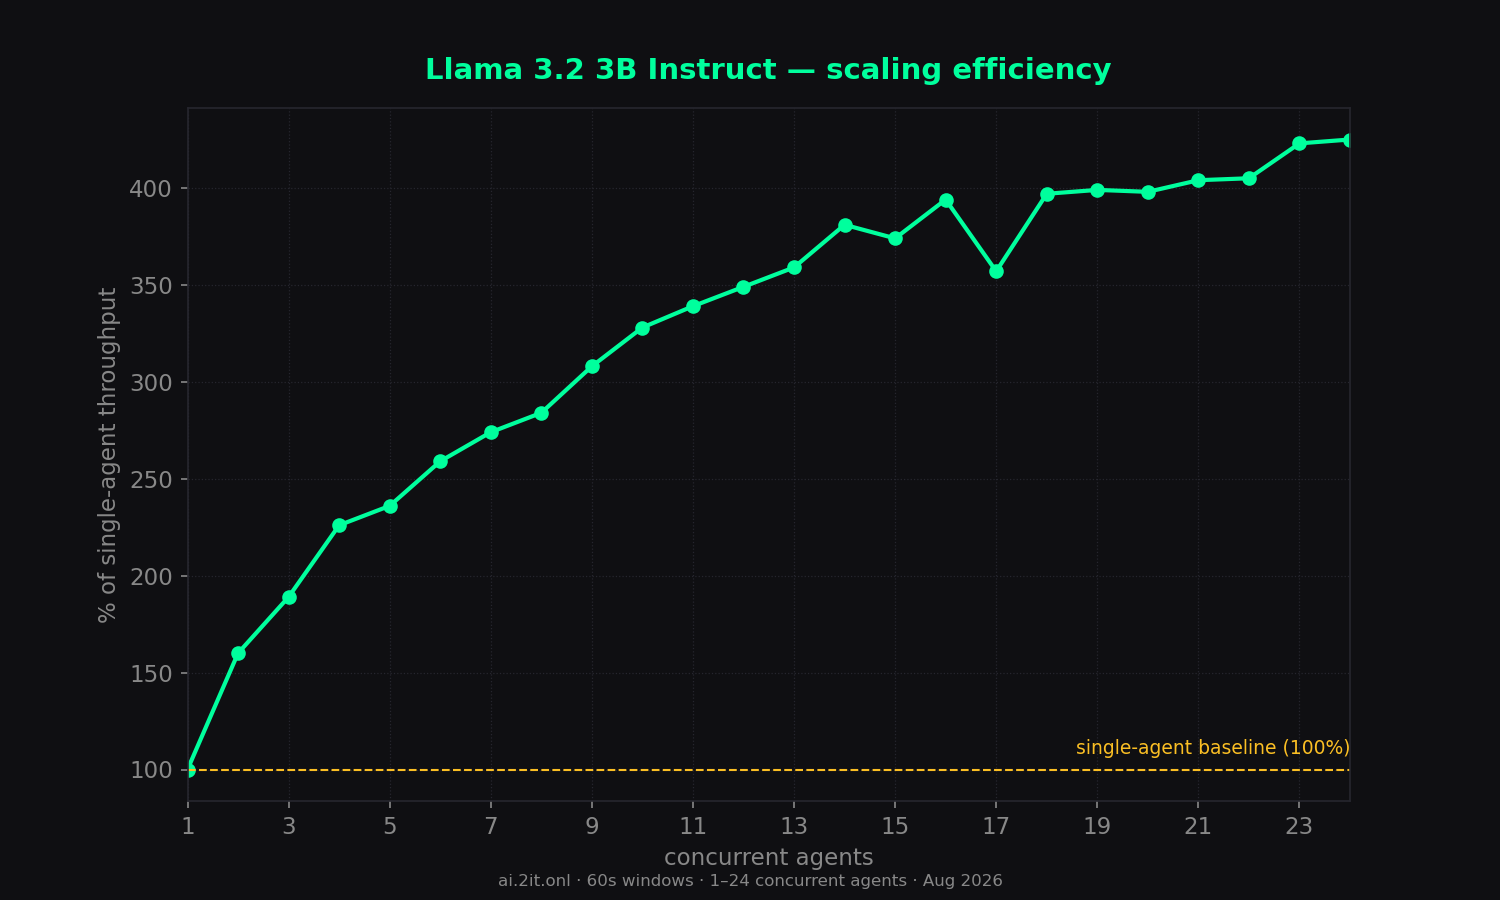
The 3B anchor — only 95 tok/s solo, but the smoothest, most predictable scaling curve in the sweep (4.25x).
Key findings
- Clean, all-content output: 0 reasoning tokens everywhere.
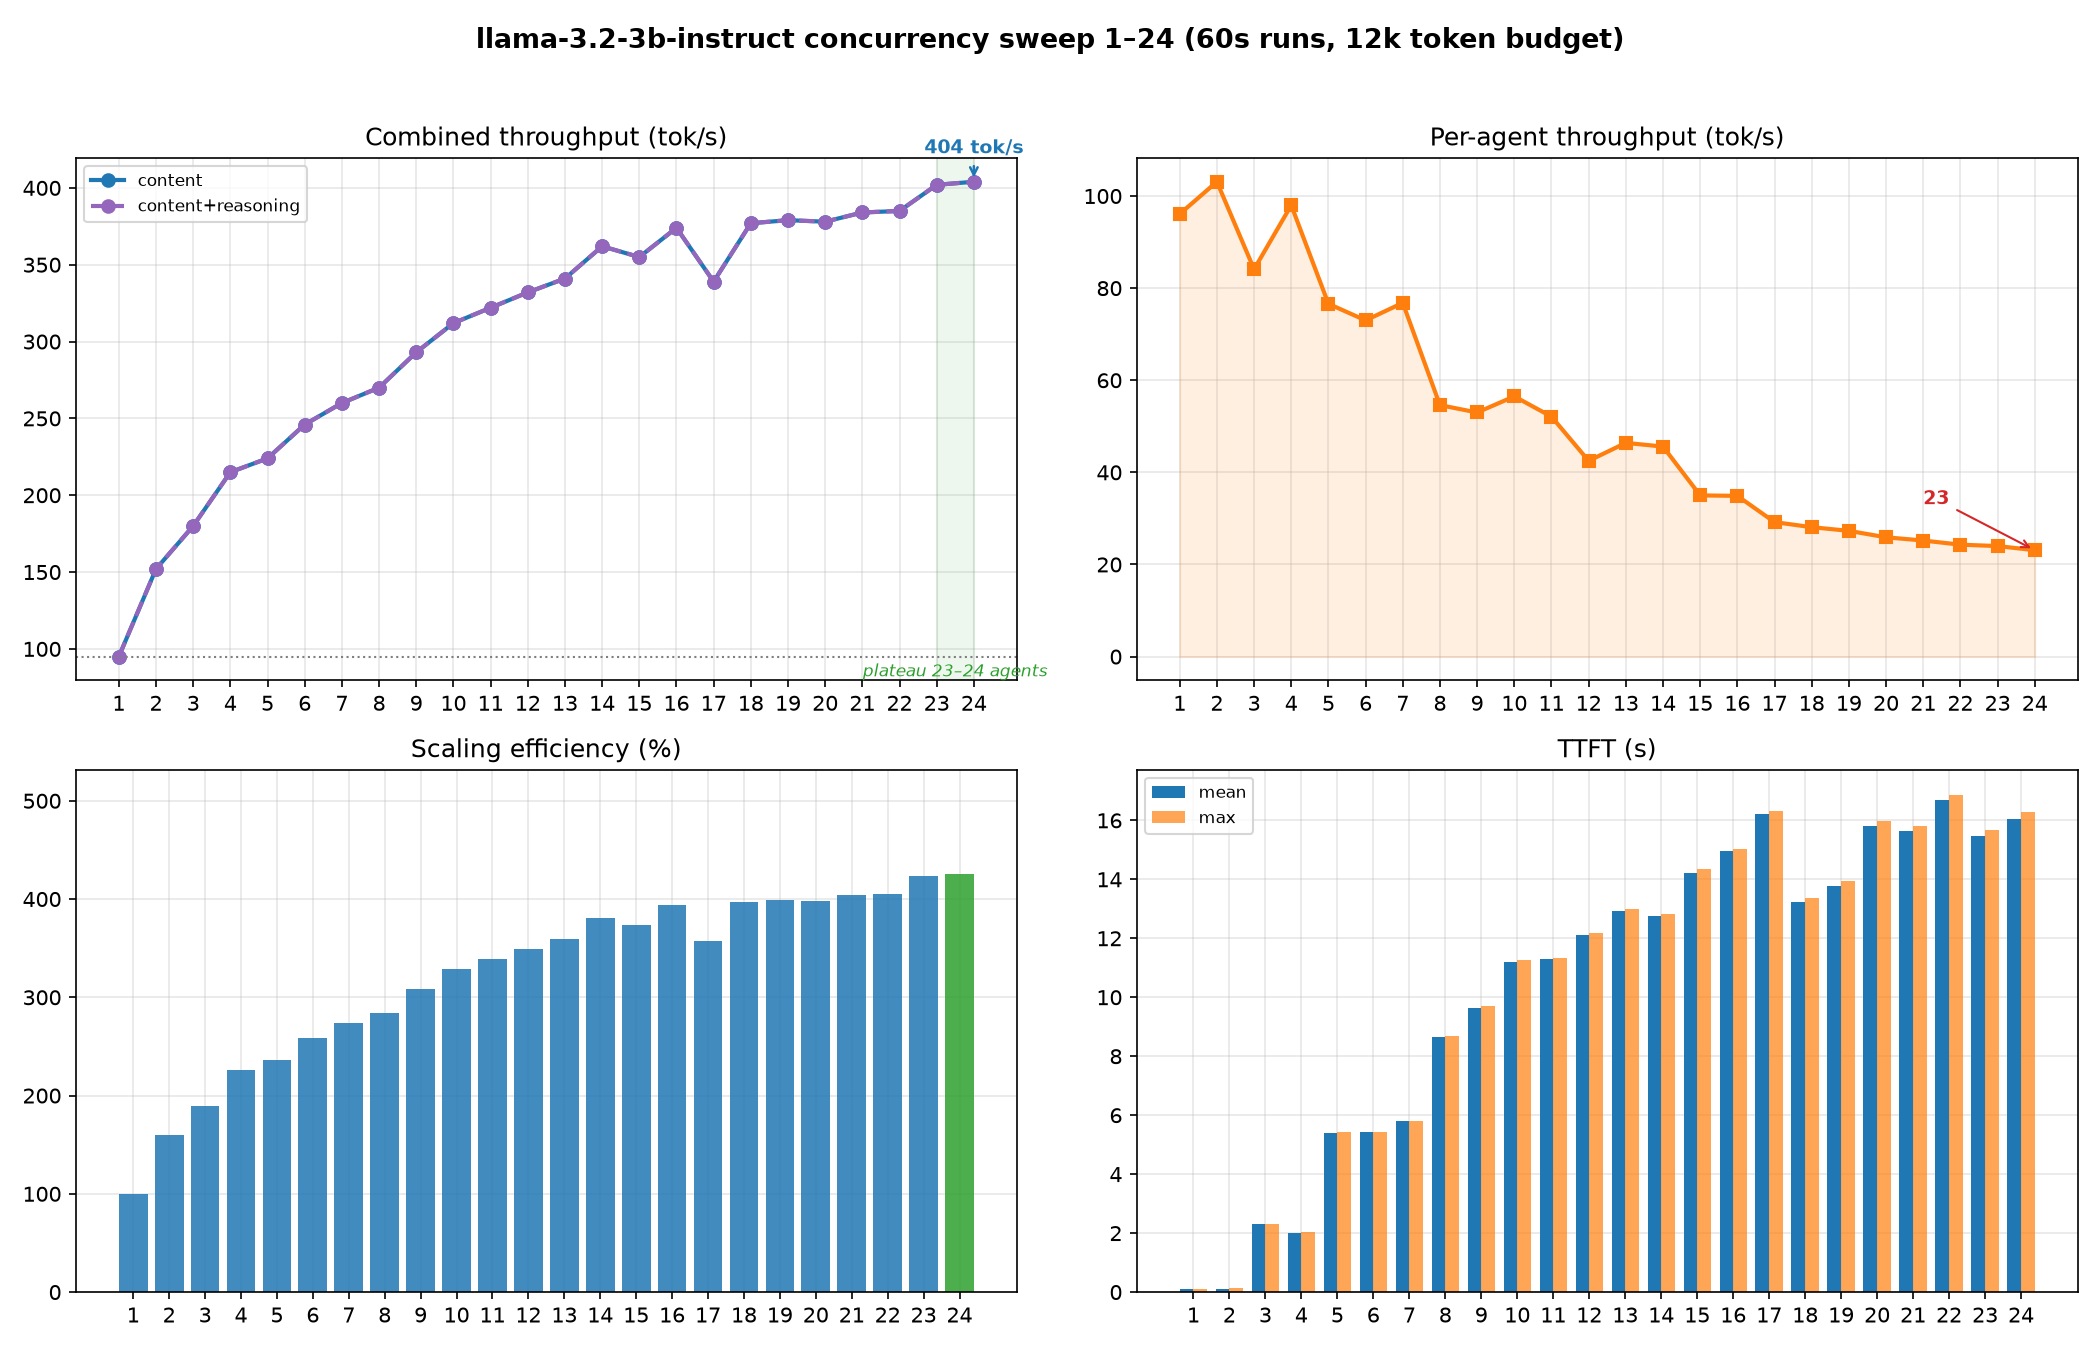
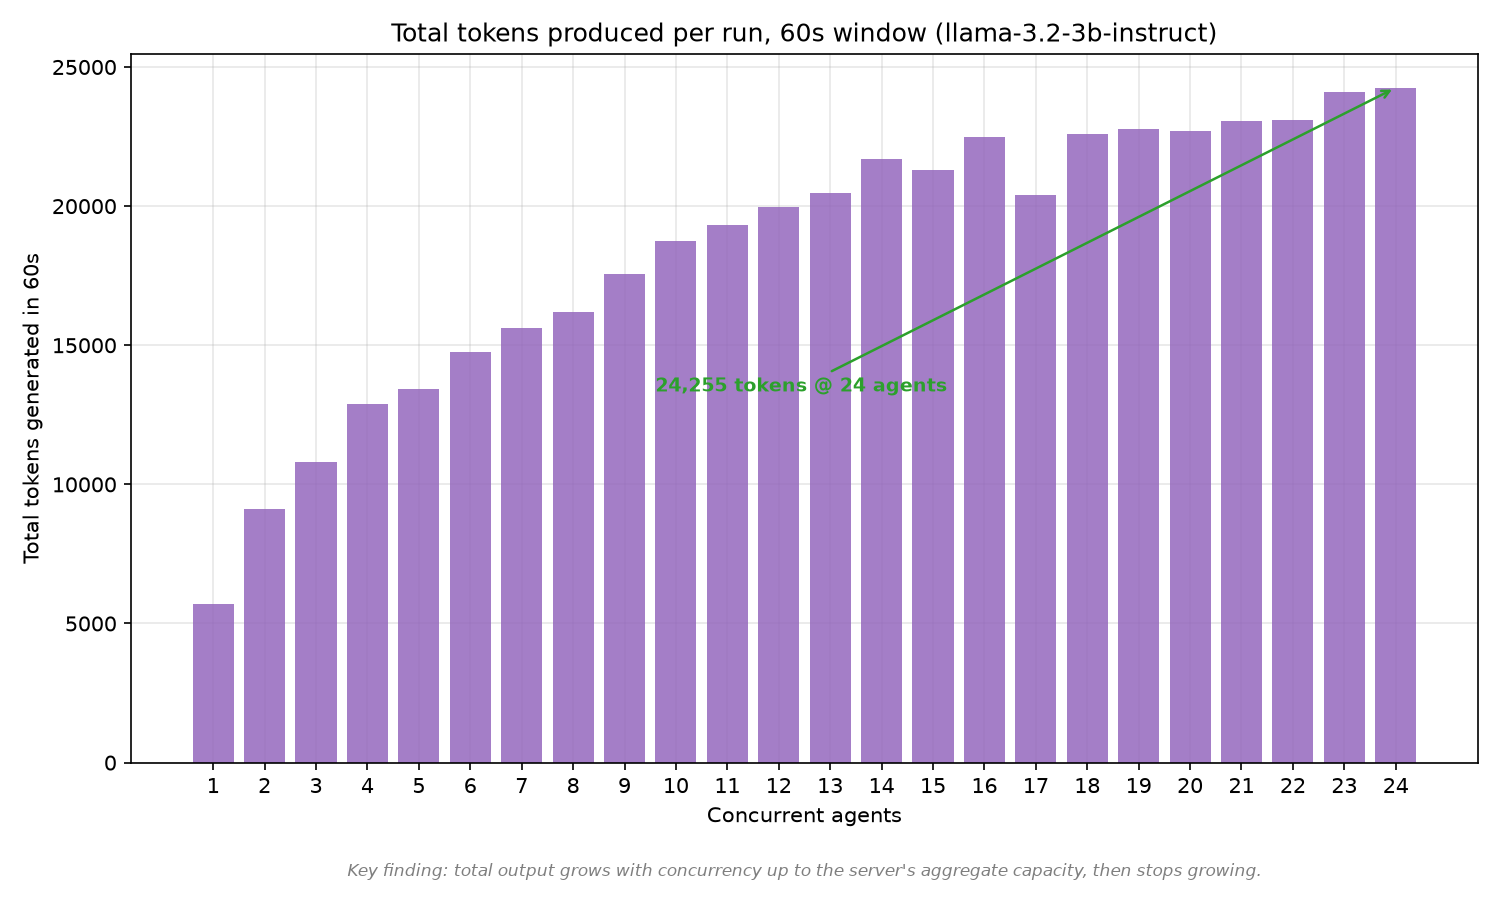
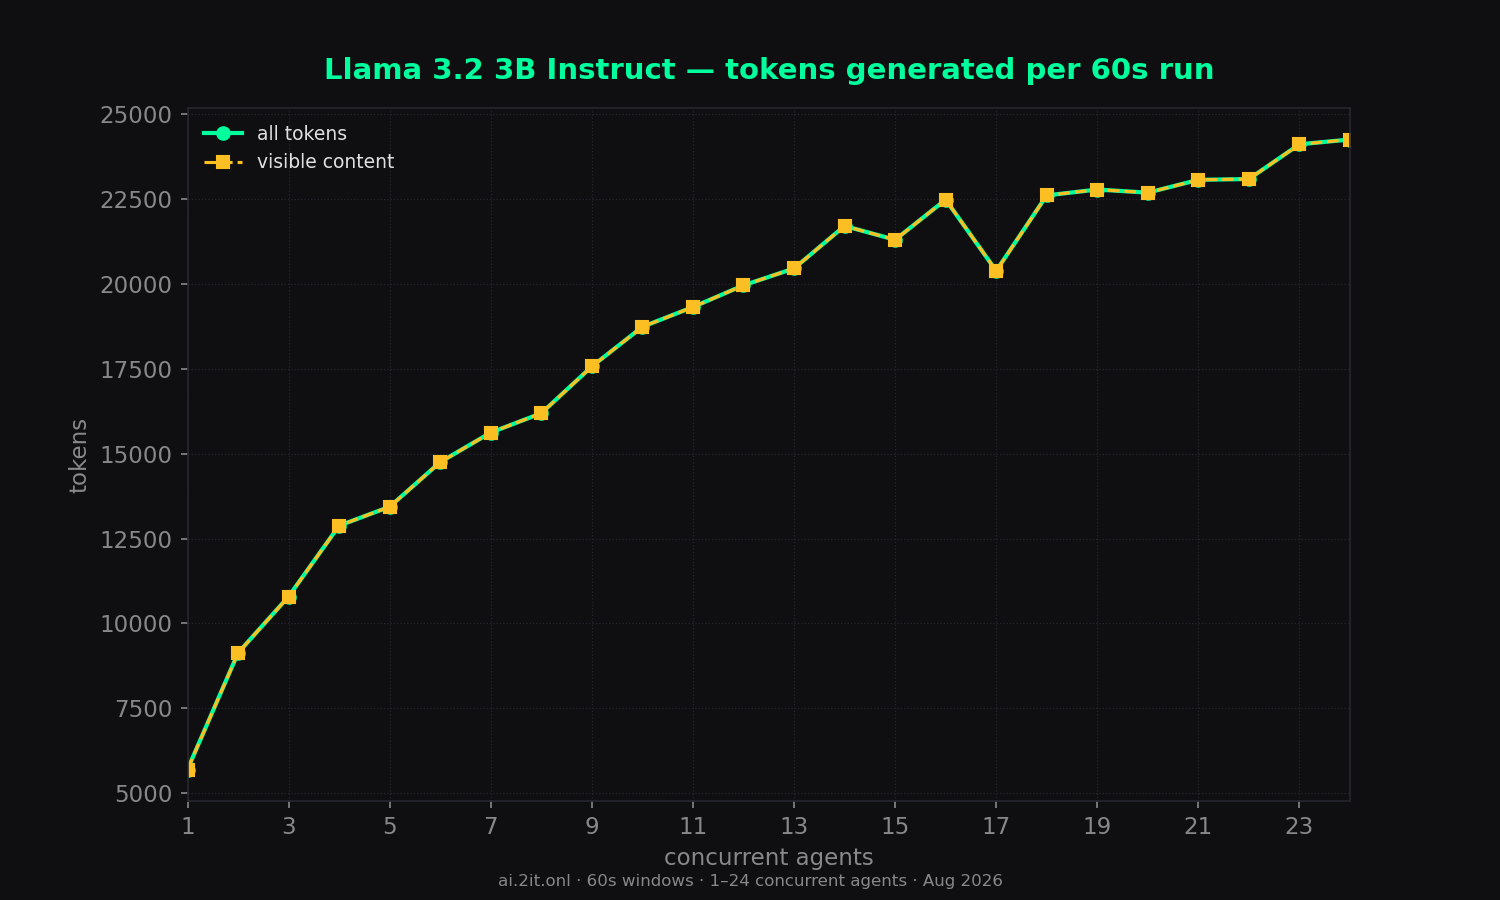
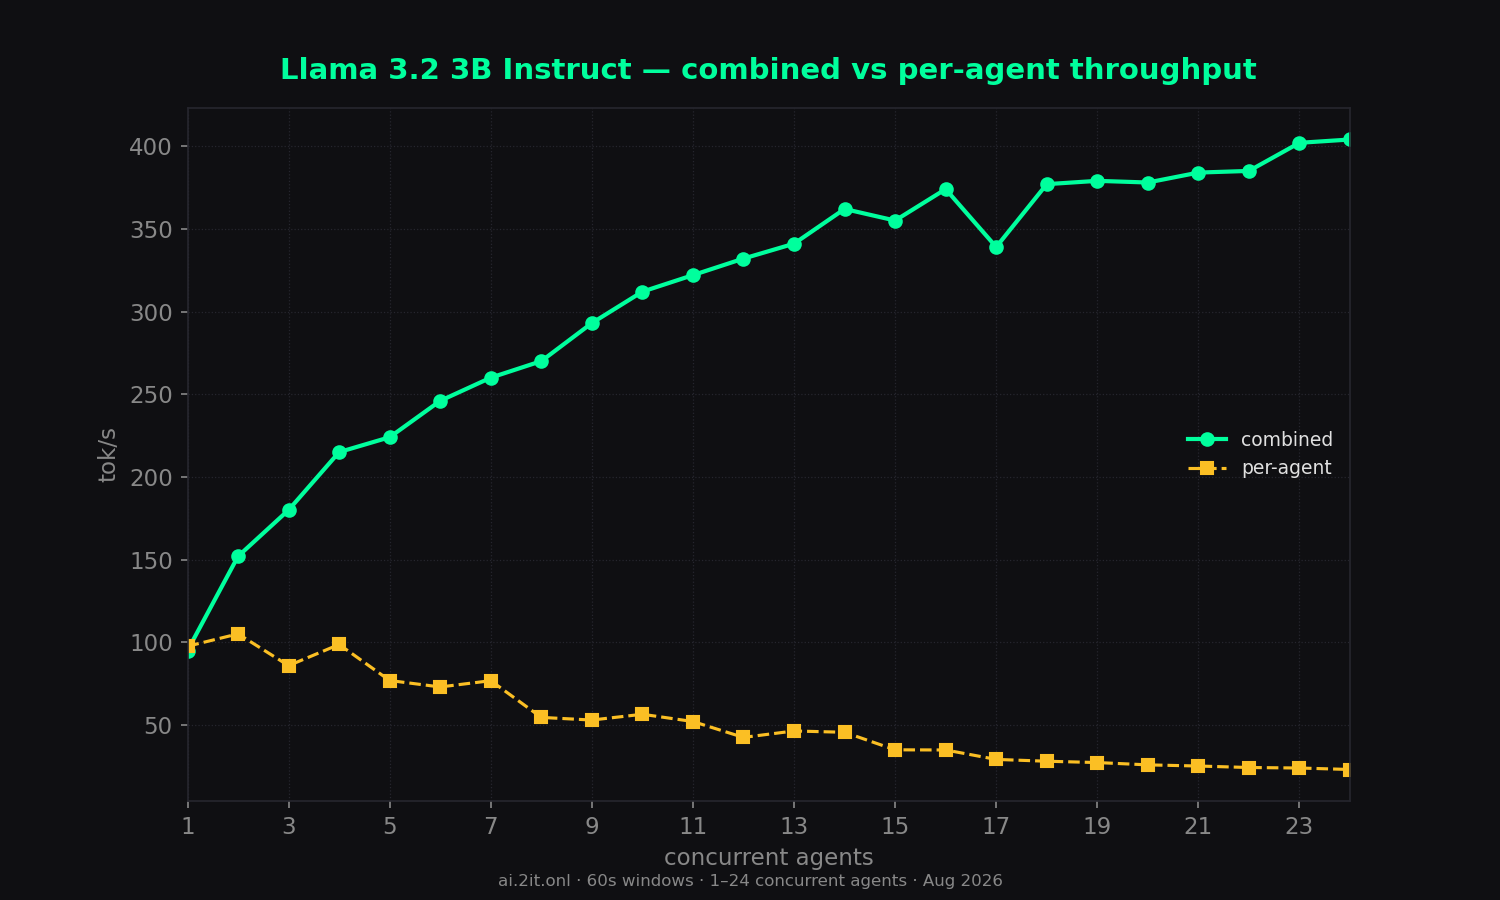
- Steady, efficient scaling: combined throughput climbs nearly monotonically from 95 tok/s solo to 404 tok/s at 24 agents (4.25x) — a smooth, well-behaved curve with no rolloff and no stall (unlike falcon3's rolloff or the thinking models' swings).
- Slower single-agent than the 1b siblings: 95 tok/s solo vs 196 for llama-3.2-1b — the extra params cost per-token speed.
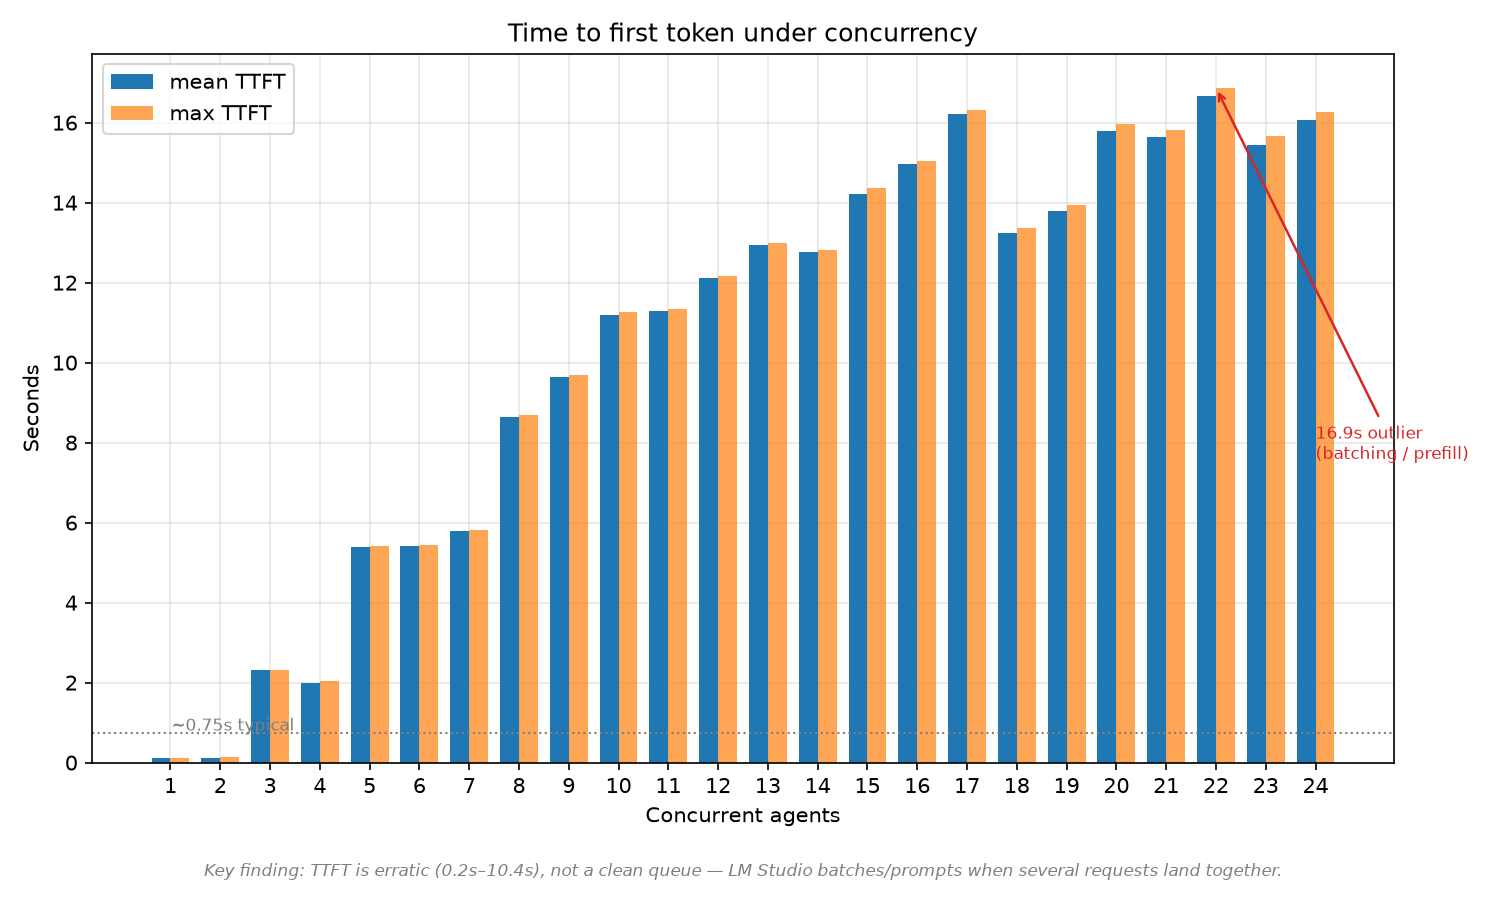
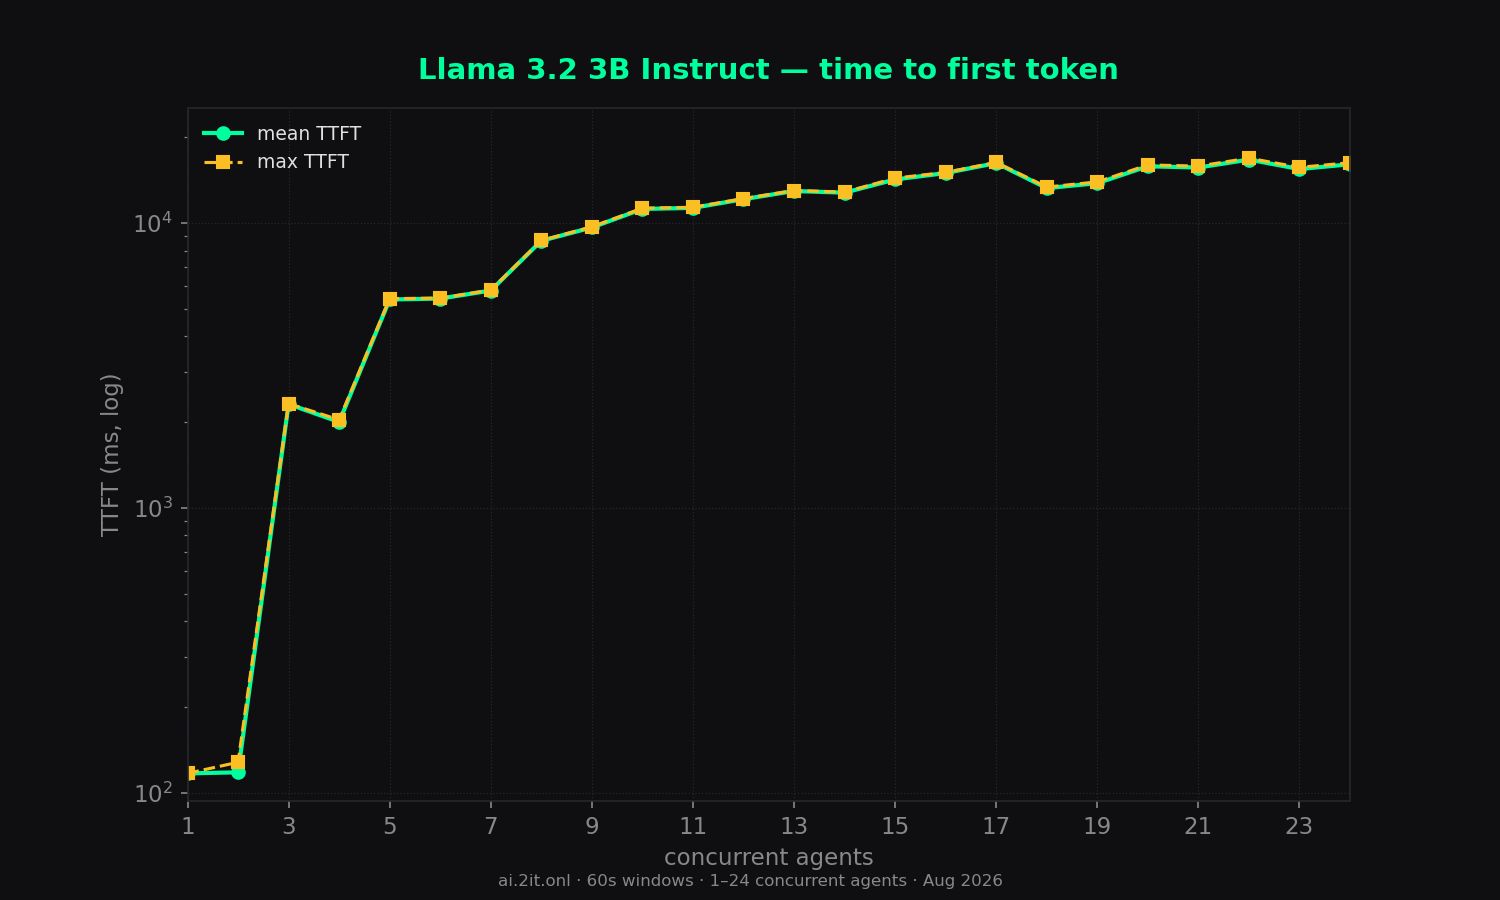
- TTFT grows steadily with load: 117ms solo, rising smoothly to 12–17s at 14+ agents as requests queue. No erratic 50s+ spikes, but high concurrency clearly serializes starts.
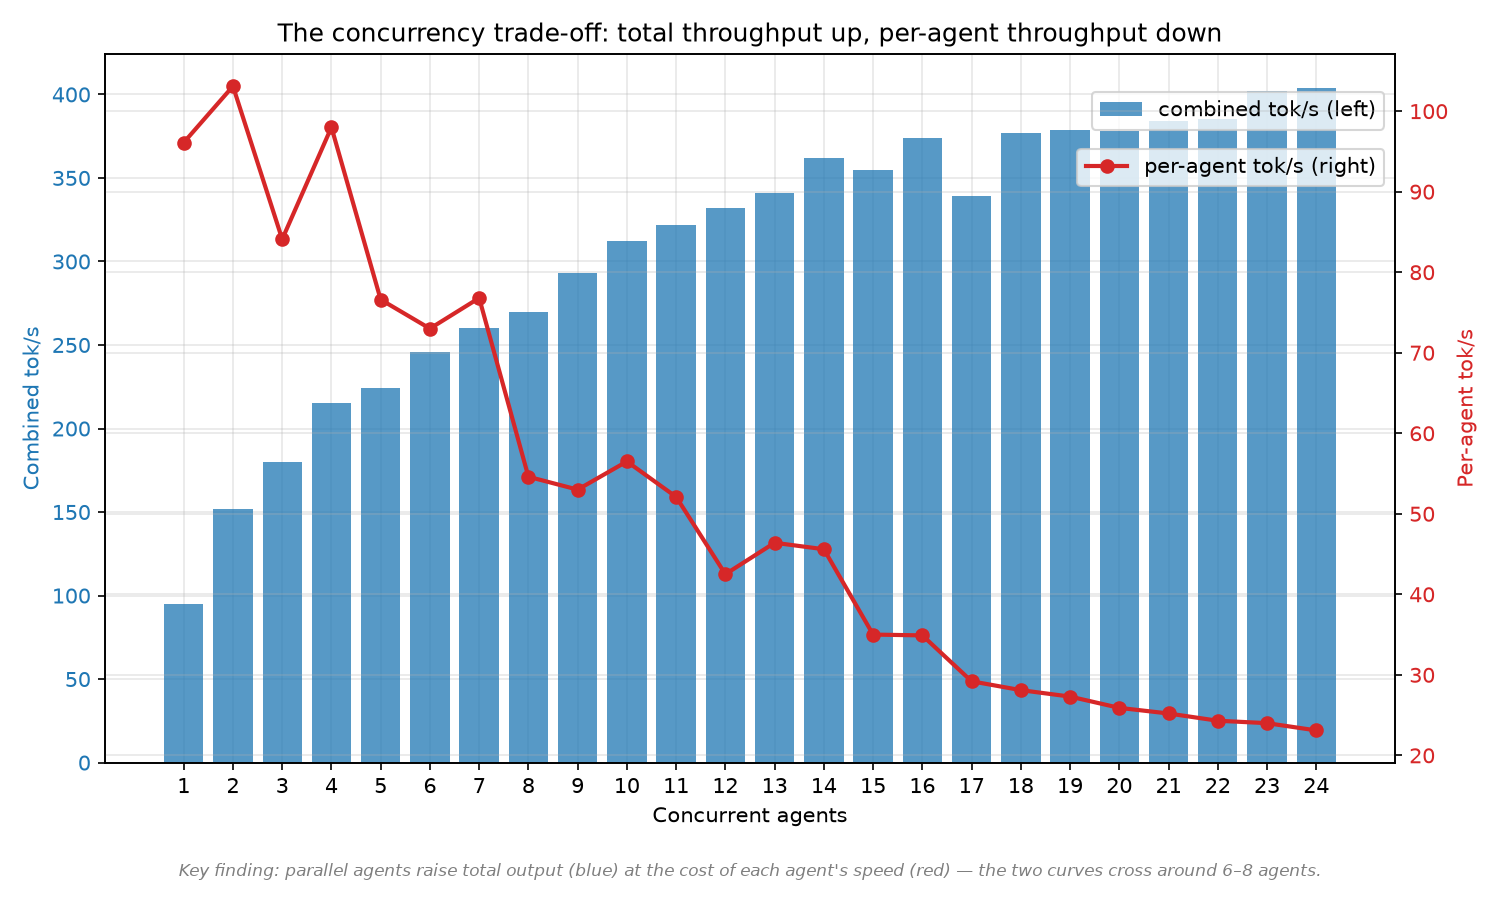
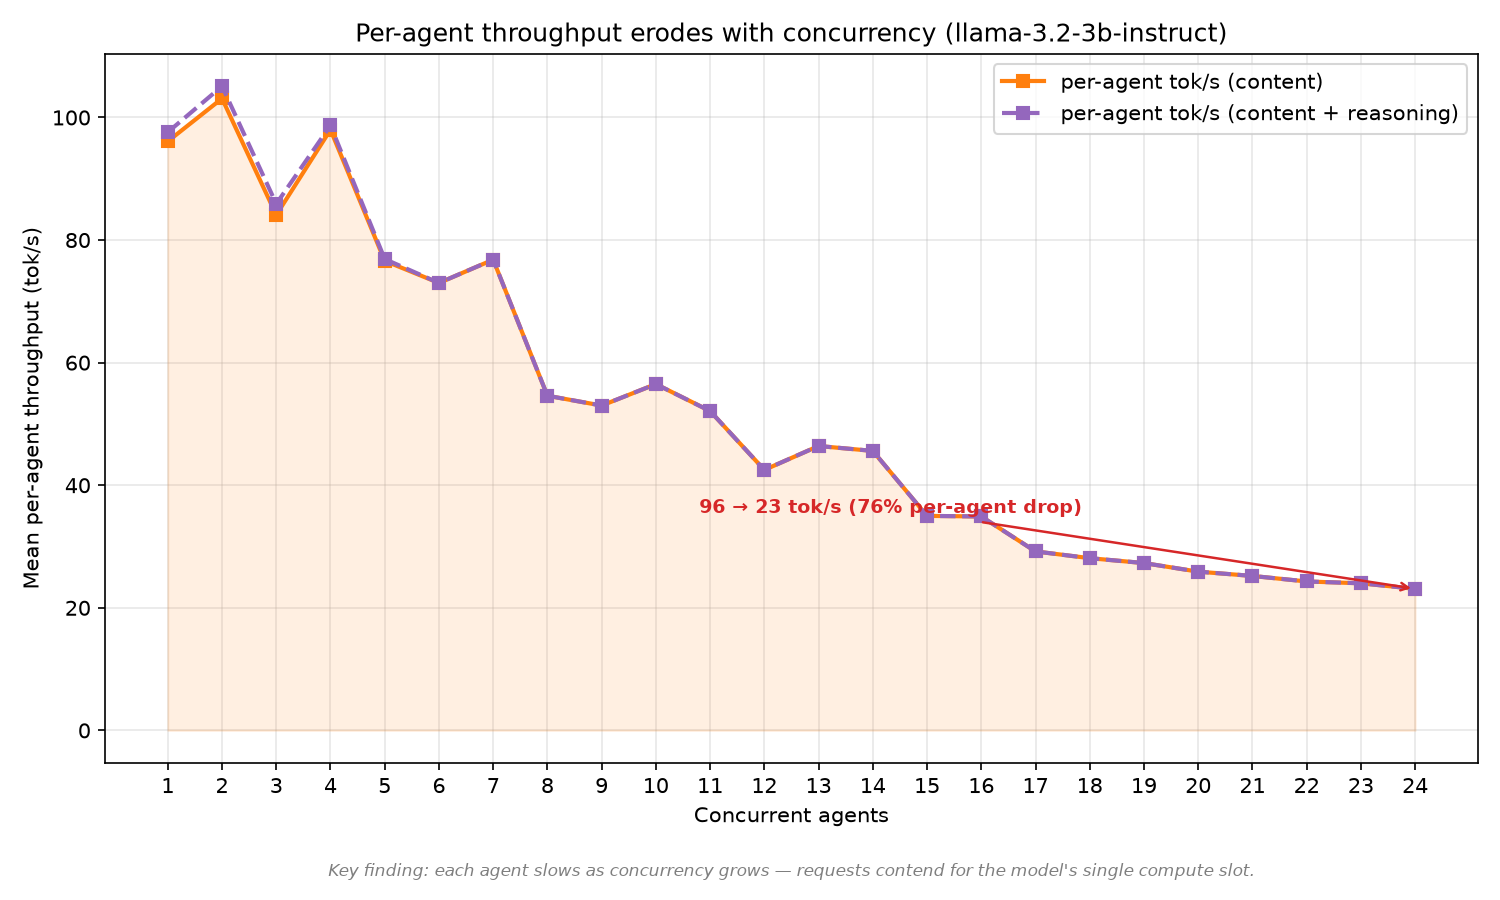
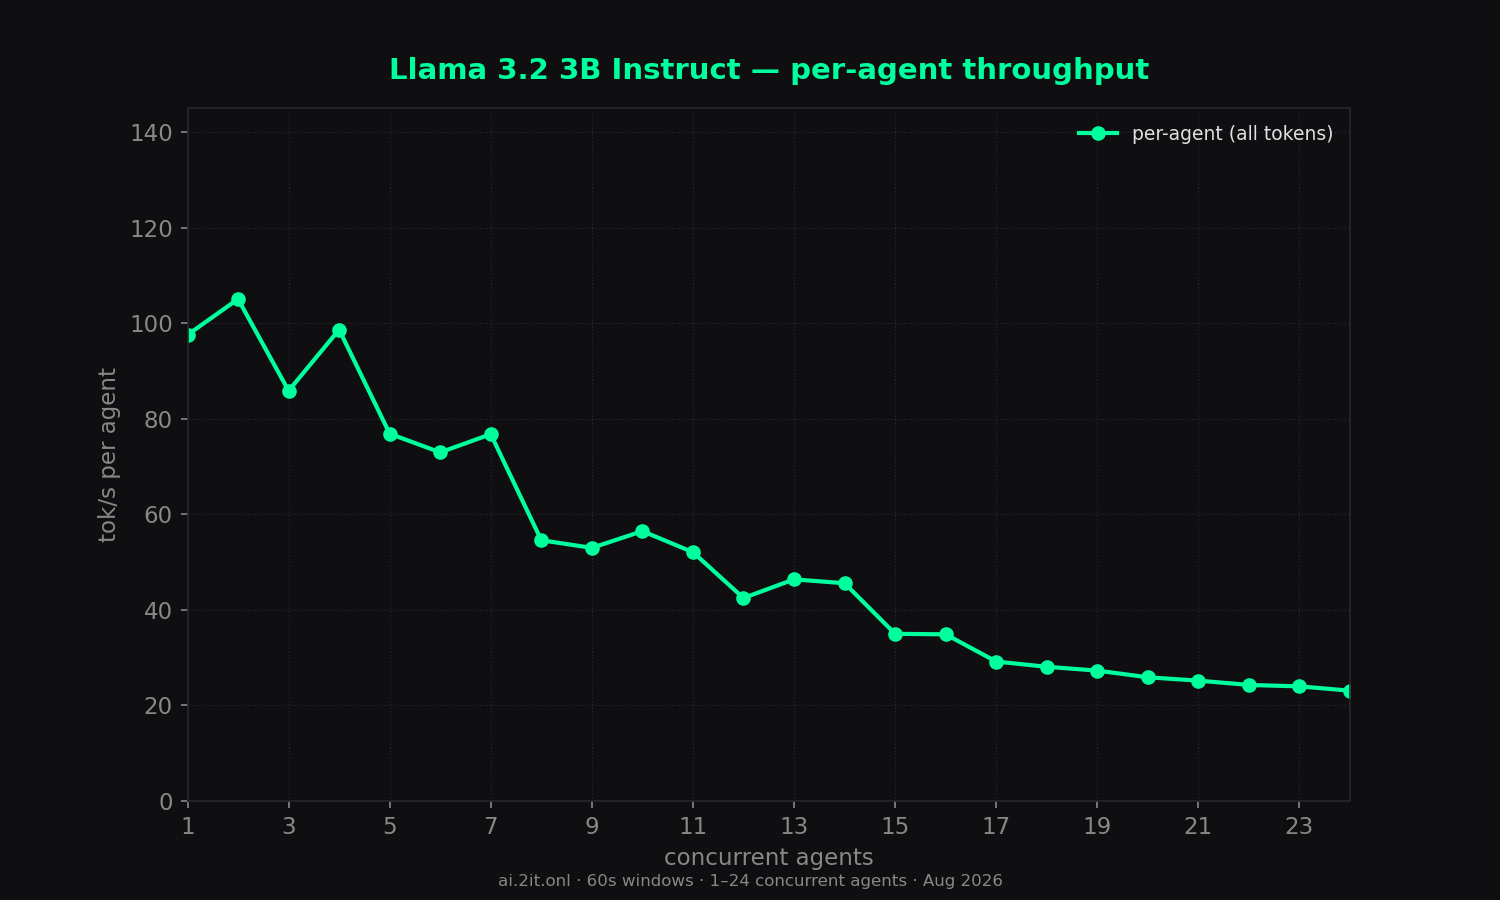
- Per-agent speed: ~23–25 tok/s at 24 agents (vs 95 solo).
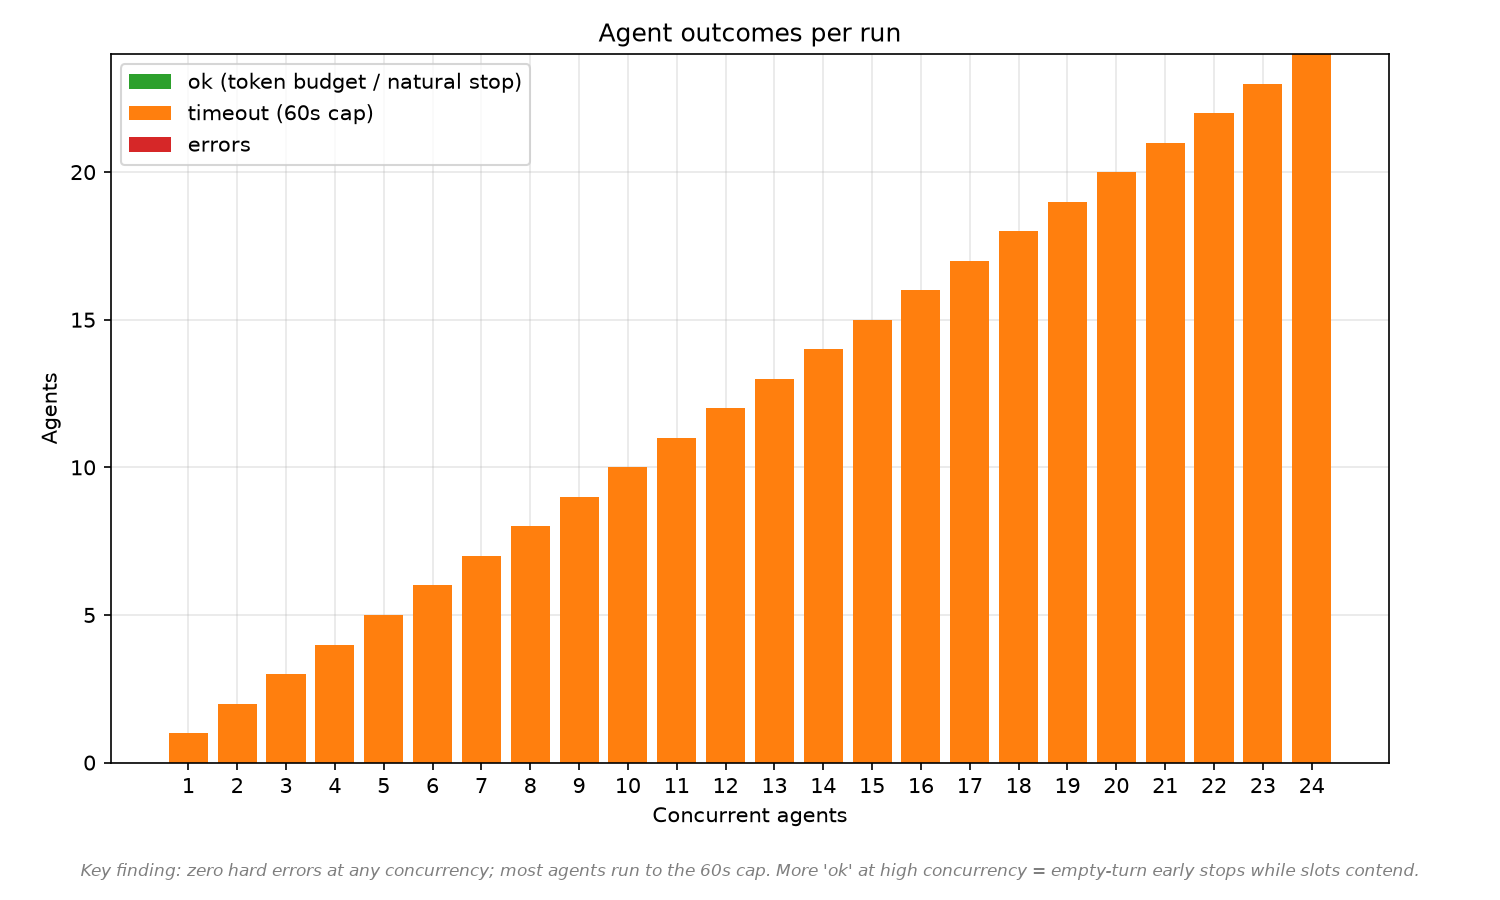
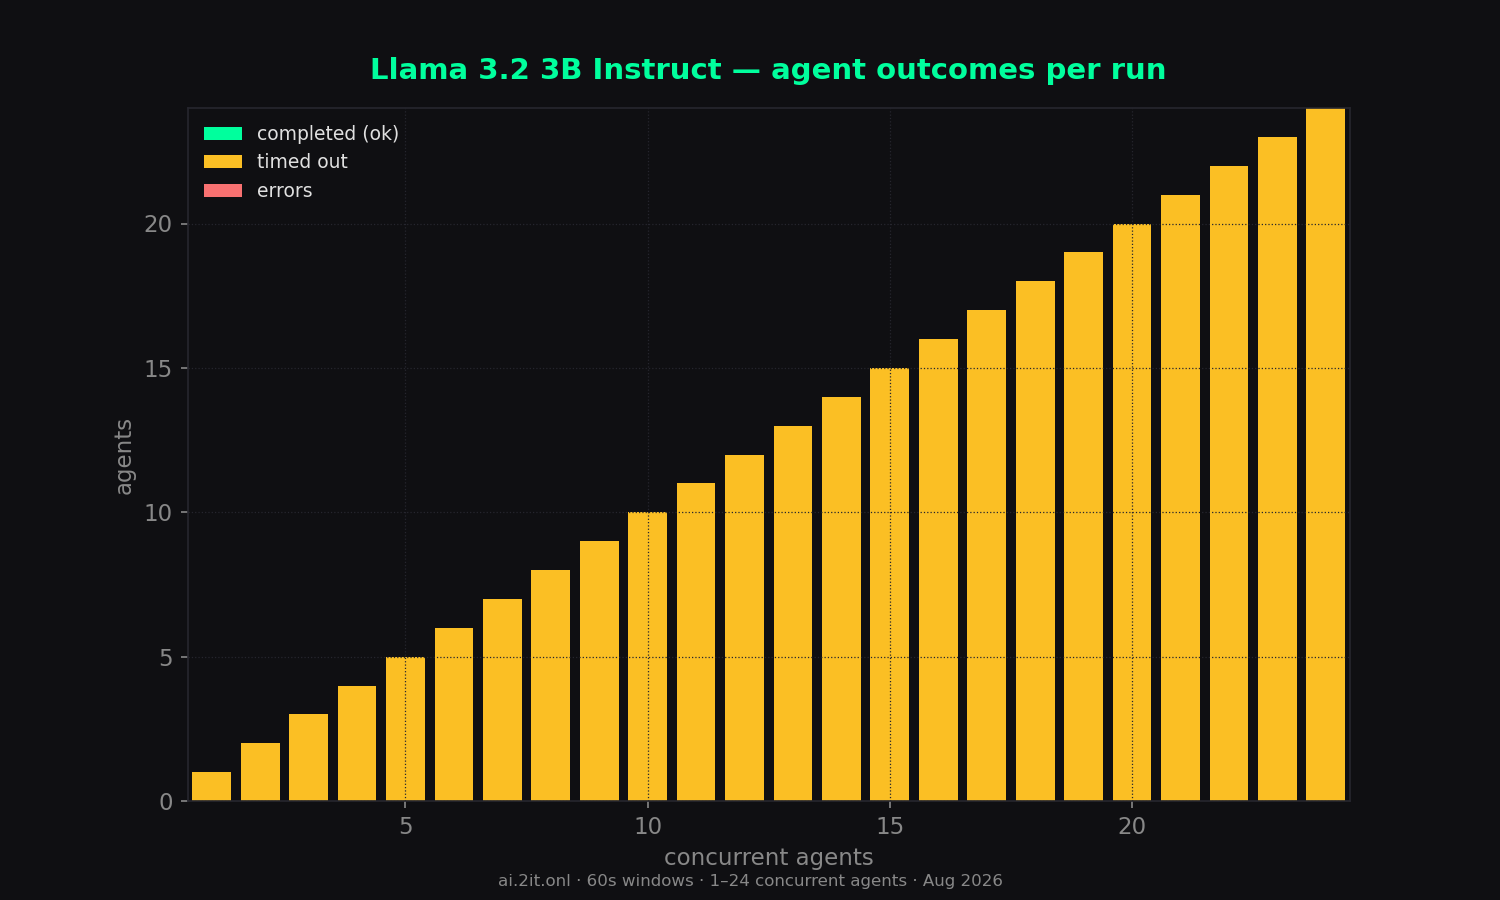
- Errors: 0 across all 24 runs.
Sweep — total concurrency 1–24
| agents | wall (s) | content | reason | total | comb tok/s | comb all | per-agent | per-agent all | scale % | TTFT mean | TTFT max | ok | timeout | err |
|---|---|---|---|---|---|---|---|---|---|---|---|---|---|---|
| 1 | 60.0 | 5,696 | 0 | 5,696 | 95 | 95 | 96.1 | 97.6 | 100% | 117ms | 117ms | 0 | 1 | 0 |
| 2 | 60.0 | 9,131 | 0 | 9,131 | 152 | 152 | 103.1 | 105.1 | 160% | 118ms | 128ms | 0 | 2 | 0 |
| 3 | 60.0 | 10,791 | 0 | 10,791 | 180 | 180 | 84.1 | 85.9 | 189% | 2.3s | 2.3s | 0 | 3 | 0 |
| 4 | 60.0 | 12,879 | 0 | 12,879 | 215 | 215 | 98.0 | 98.7 | 226% | 2.0s | 2.0s | 0 | 4 | 0 |
| 5 | 60.0 | 13,437 | 0 | 13,437 | 224 | 224 | 76.6 | 76.9 | 236% | 5.4s | 5.4s | 0 | 5 | 0 |
| 6 | 60.0 | 14,751 | 0 | 14,751 | 246 | 246 | 73.0 | 73.0 | 259% | 5.4s | 5.4s | 0 | 6 | 0 |
| 7 | 60.0 | 15,621 | 0 | 15,621 | 260 | 260 | 76.8 | 76.8 | 274% | 5.8s | 5.8s | 0 | 7 | 0 |
| 8 | 60.0 | 16,191 | 0 | 16,191 | 270 | 270 | 54.6 | 54.6 | 284% | 8.7s | 8.7s | 0 | 8 | 0 |
| 9 | 60.0 | 17,569 | 0 | 17,569 | 293 | 293 | 53.0 | 53.0 | 308% | 9.6s | 9.7s | 0 | 9 | 0 |
| 10 | 60.0 | 18,737 | 0 | 18,737 | 312 | 312 | 56.5 | 56.5 | 328% | 11.2s | 11.3s | 0 | 10 | 0 |
| 11 | 60.0 | 19,319 | 0 | 19,319 | 322 | 322 | 52.1 | 52.1 | 339% | 11.3s | 11.3s | 0 | 11 | 0 |
| 12 | 60.0 | 19,959 | 0 | 19,959 | 332 | 332 | 42.5 | 42.5 | 349% | 12.1s | 12.2s | 0 | 12 | 0 |
| 13 | 60.0 | 20,456 | 0 | 20,456 | 341 | 341 | 46.4 | 46.4 | 359% | 12.9s | 13.0s | 0 | 13 | 0 |
| 14 | 60.0 | 21,708 | 0 | 21,708 | 362 | 362 | 45.6 | 45.6 | 381% | 12.8s | 12.8s | 0 | 14 | 0 |
| 15 | 60.0 | 21,301 | 0 | 21,301 | 355 | 355 | 35.0 | 35.0 | 374% | 14.2s | 14.4s | 0 | 15 | 0 |
| 16 | 60.0 | 22,483 | 0 | 22,483 | 374 | 374 | 34.9 | 34.9 | 394% | 15.0s | 15.0s | 0 | 16 | 0 |
| 17 | 60.0 | 20,385 | 0 | 20,385 | 339 | 339 | 29.2 | 29.2 | 357% | 16.2s | 16.3s | 0 | 17 | 0 |
| 18 | 60.0 | 22,609 | 0 | 22,609 | 377 | 377 | 28.1 | 28.1 | 397% | 13.2s | 13.4s | 0 | 18 | 0 |
| 19 | 60.0 | 22,781 | 0 | 22,781 | 379 | 379 | 27.3 | 27.3 | 399% | 13.8s | 13.9s | 0 | 19 | 0 |
| 20 | 60.0 | 22,689 | 0 | 22,689 | 378 | 378 | 25.9 | 25.9 | 398% | 15.8s | 16.0s | 0 | 20 | 0 |
| 21 | 60.0 | 23,067 | 0 | 23,067 | 384 | 384 | 25.2 | 25.2 | 404% | 15.6s | 15.8s | 0 | 21 | 0 |
| 22 | 60.1 | 23,090 | 0 | 23,090 | 385 | 385 | 24.3 | 24.3 | 405% | 16.7s | 16.9s | 0 | 22 | 0 |
| 23 | 60.0 | 24,114 | 0 | 24,114 | 402 | 402 | 24.0 | 24.0 | 423% | 15.5s | 15.7s | 0 | 23 | 0 |
| 24 peak | 60.0 | 24,255 | 0 | 24,255 | 404 | 404 | 23.1 | 23.1 | 425% | 16.1s | 16.3s | 0 | 24 | 0 |
* burst artifact — agents queued ~11–16s then generated in a short burst; the per-agent timer inflates the number. Trust combined throughput and TTFT columns. Peak row = highest combined (all-token) throughput.
Charts
Raw data & downloads
- report.md5 KB
- sweep-summary.csv2 KB
- sweep-summary.json11 KB
- combined_throughput.png115 KB · original matplotlib export
- combined_vs_per_agent.png112 KB · original matplotlib export
- dashboard_1_24.png166 KB · original matplotlib export
- outcome_breakdown.png57 KB · original matplotlib export
- per_agent_throughput.png105 KB · original matplotlib export
- scaling_efficiency.png80 KB · original matplotlib export
- time_to_first_token.png70 KB · original matplotlib export
- total_tokens_generated.png71 KB · original matplotlib export