Gemma 2B IT (smashed)
server model id:
gemma-2b-it-smashednon-thinkingKV Q8_0ctx 8k2B params
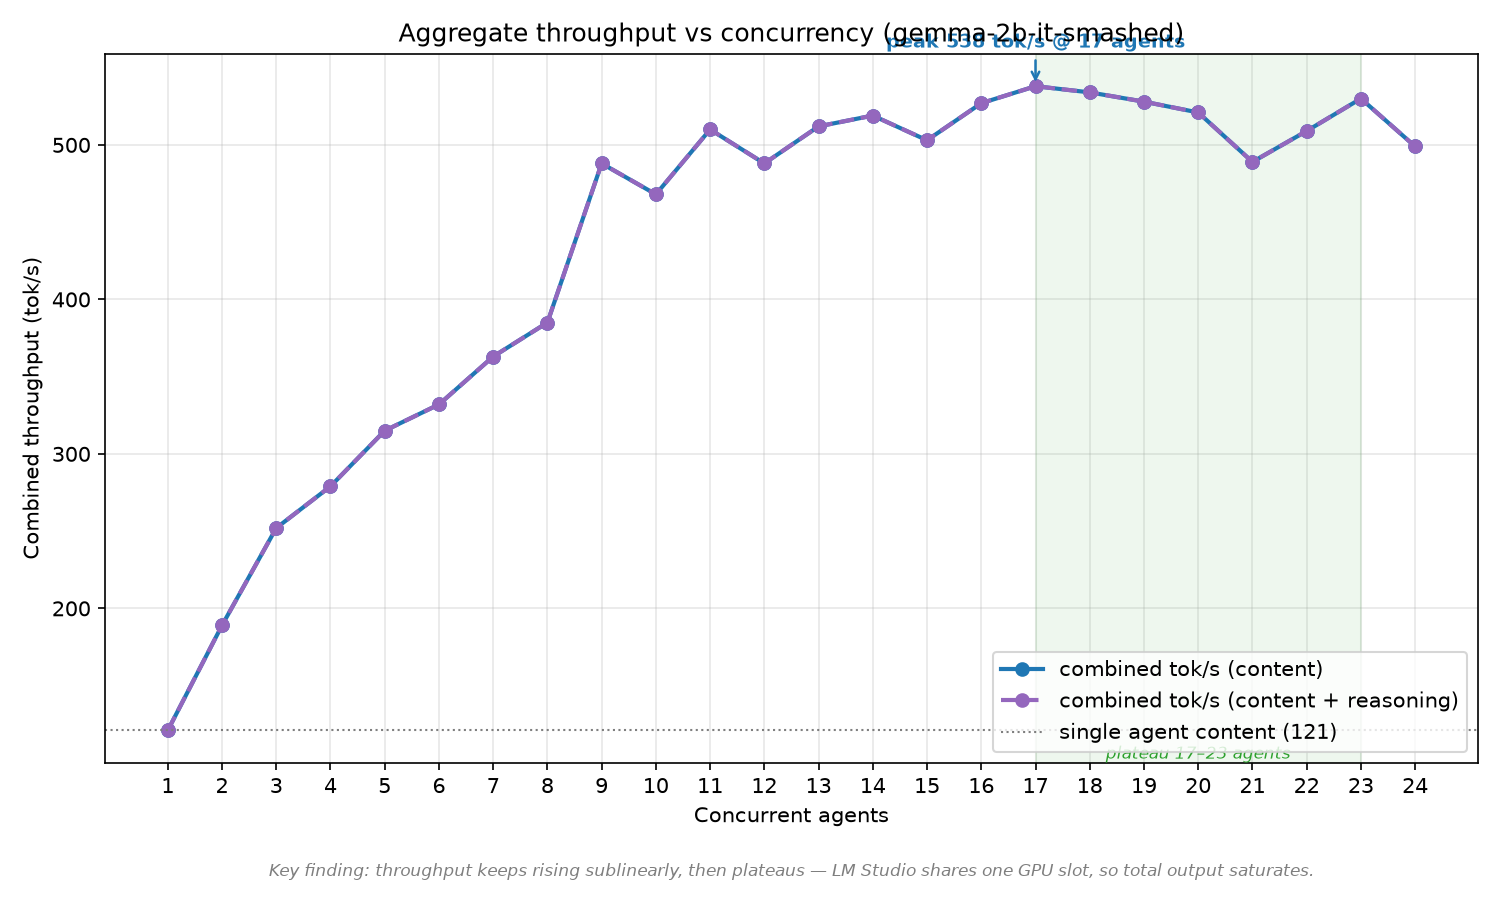
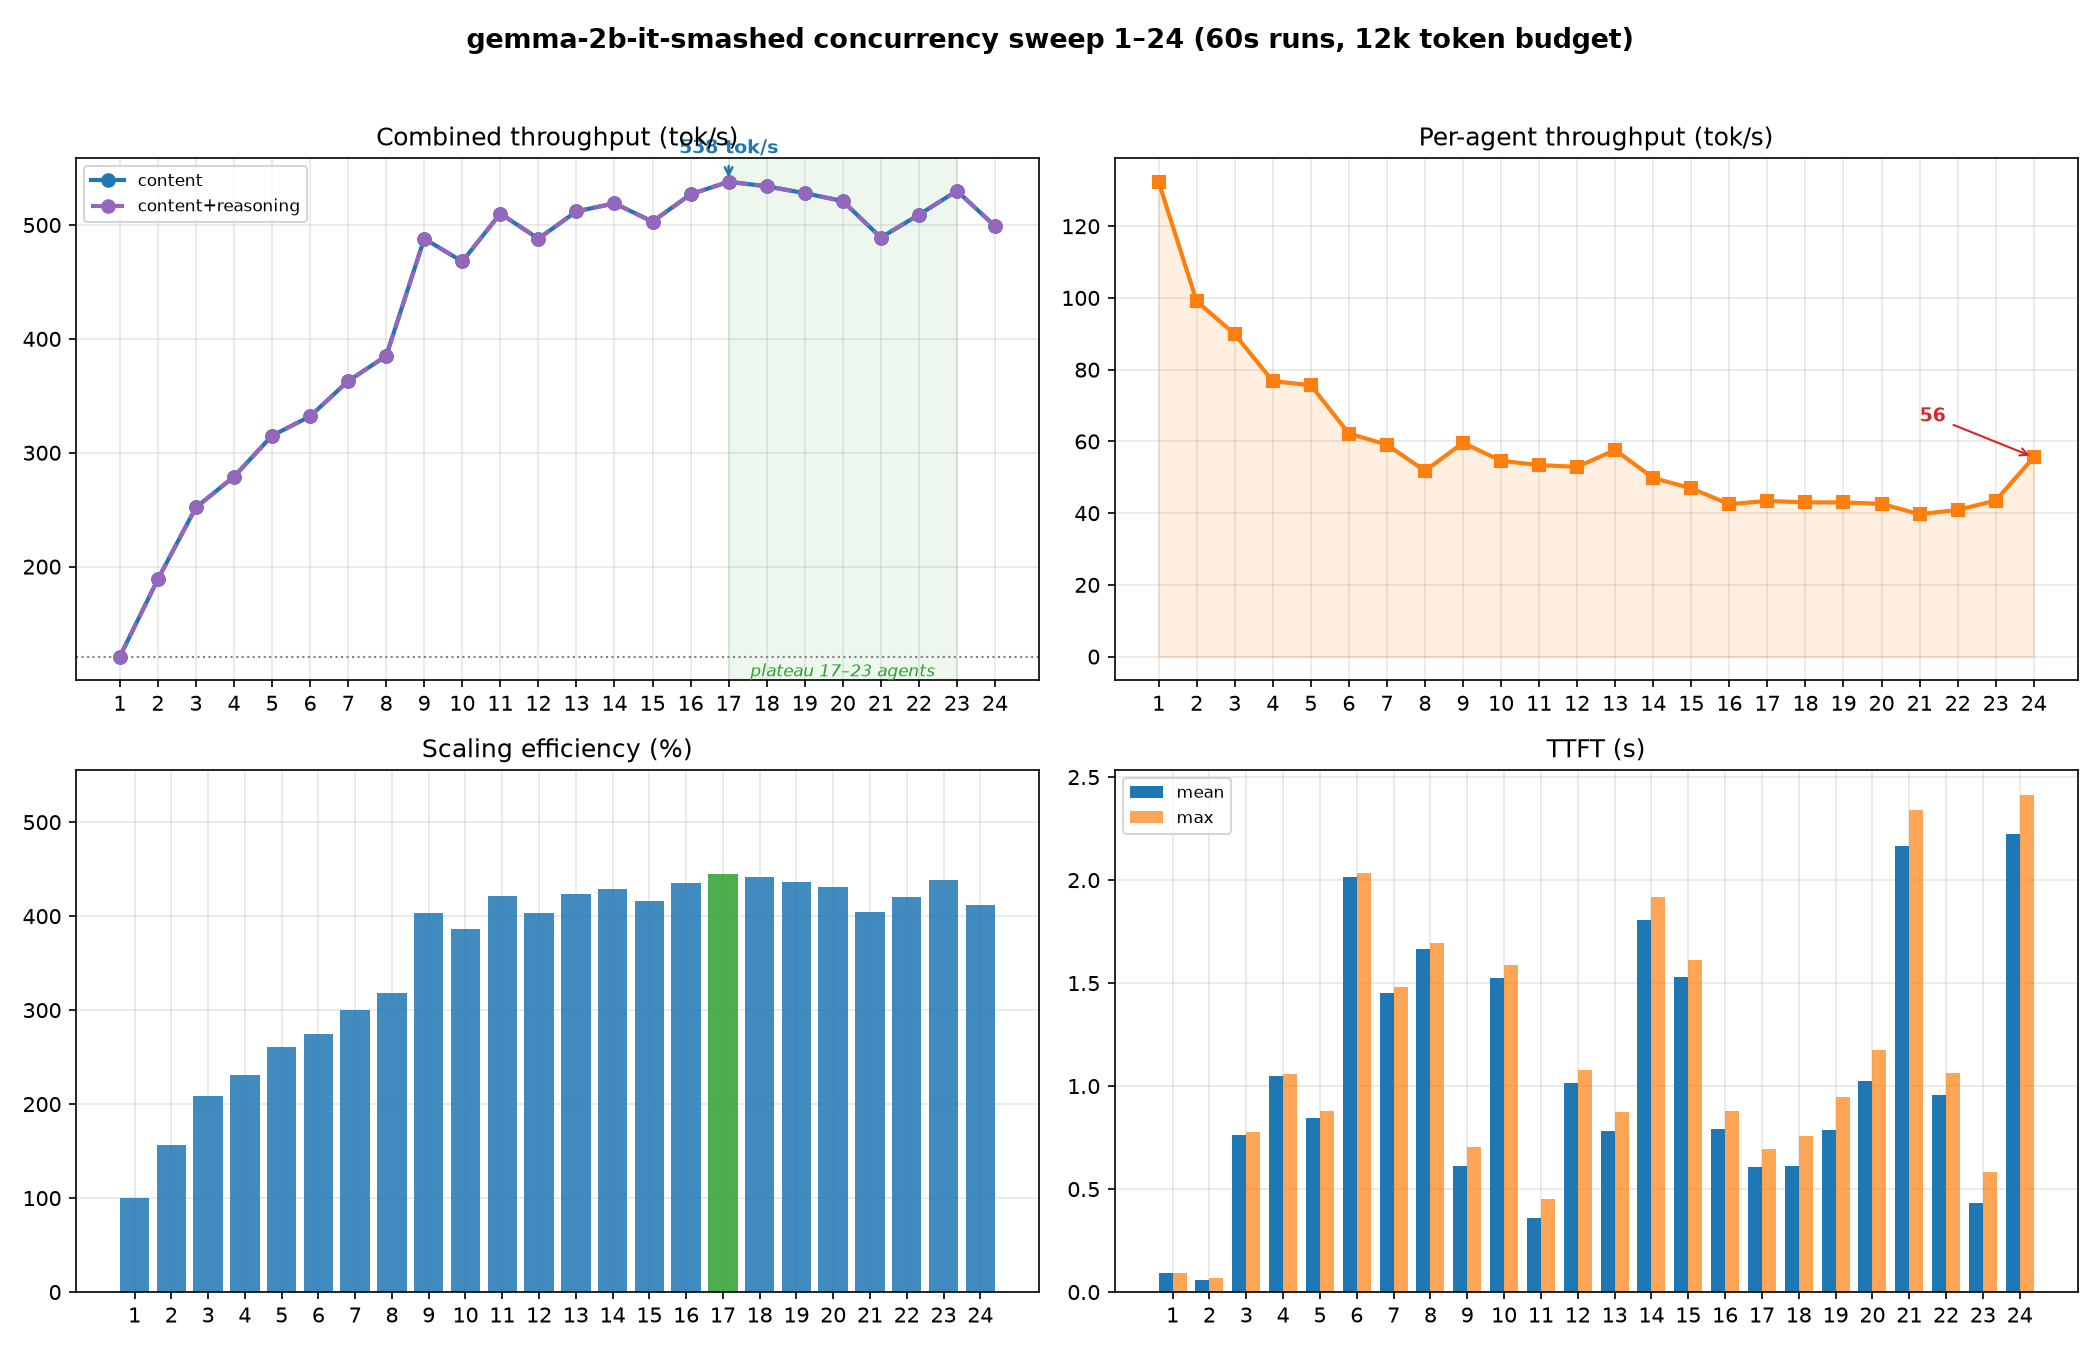
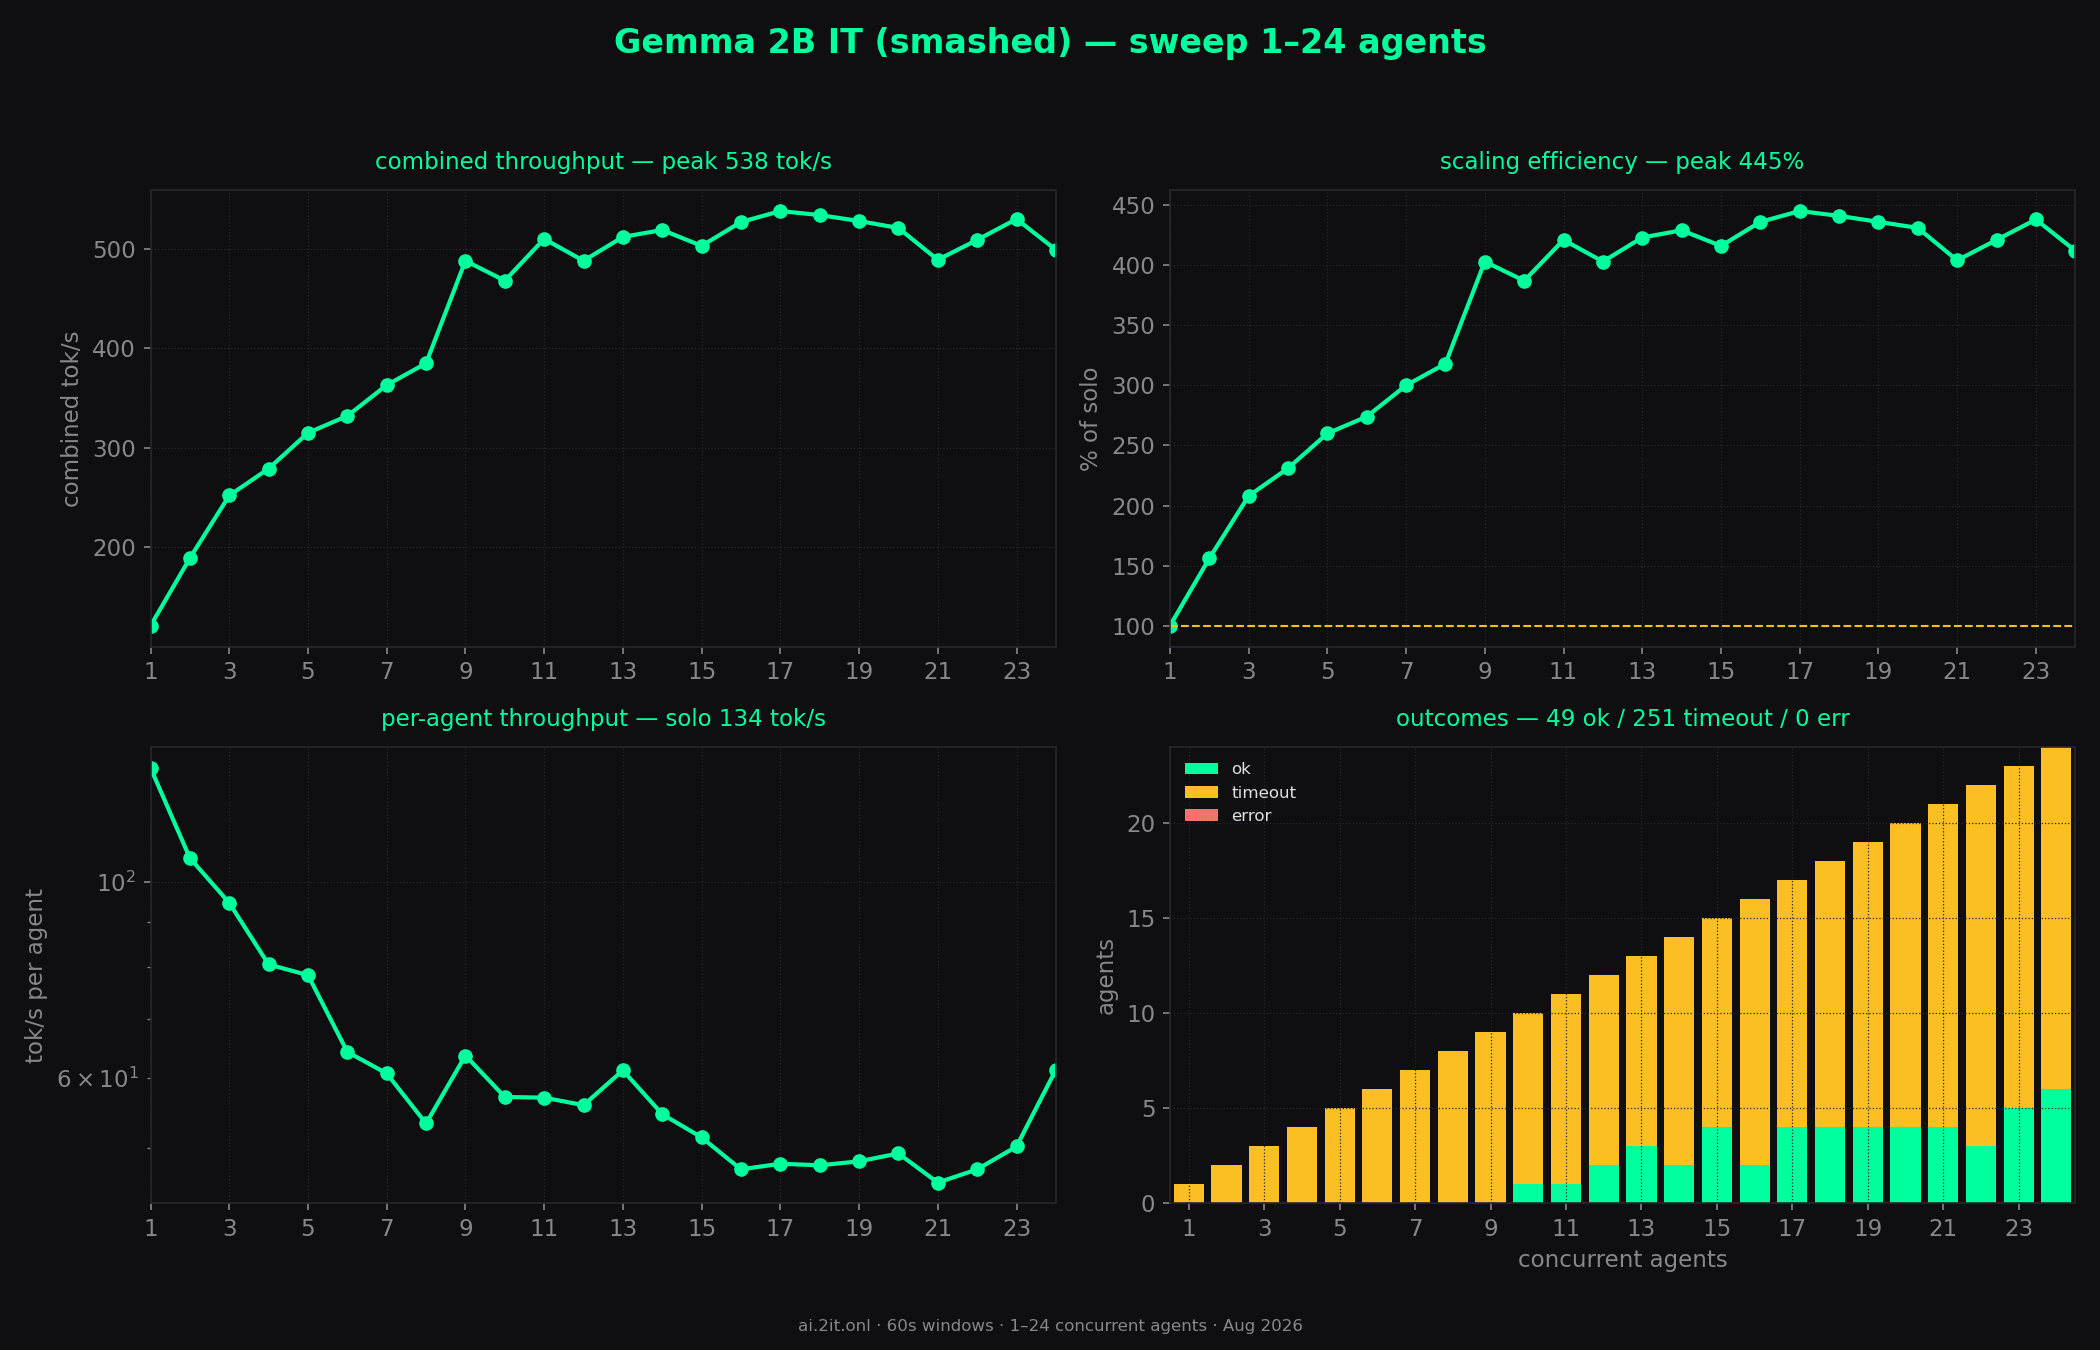
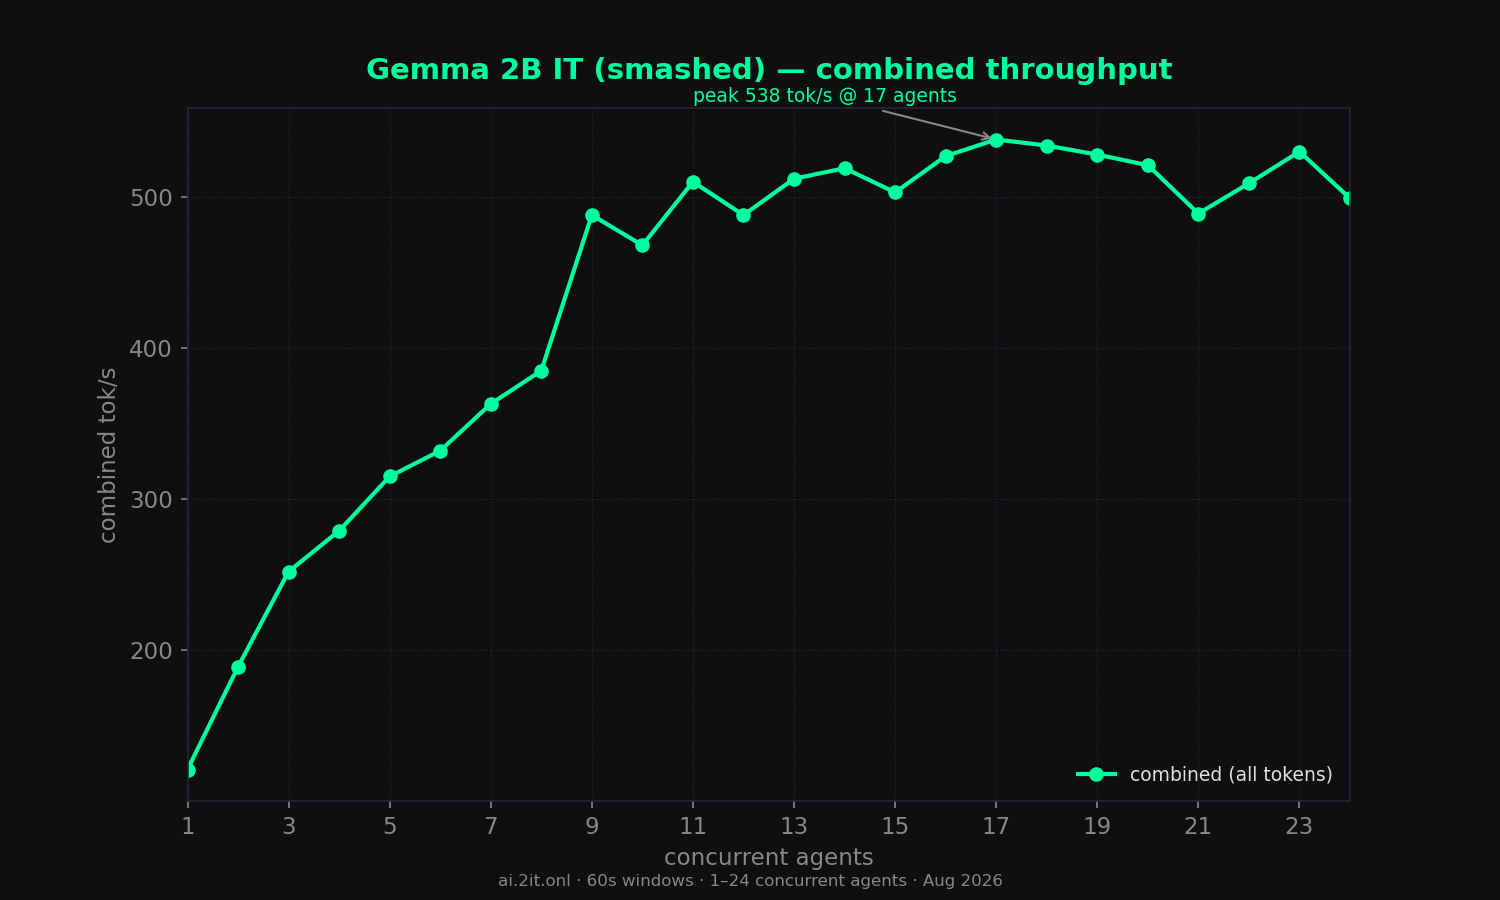
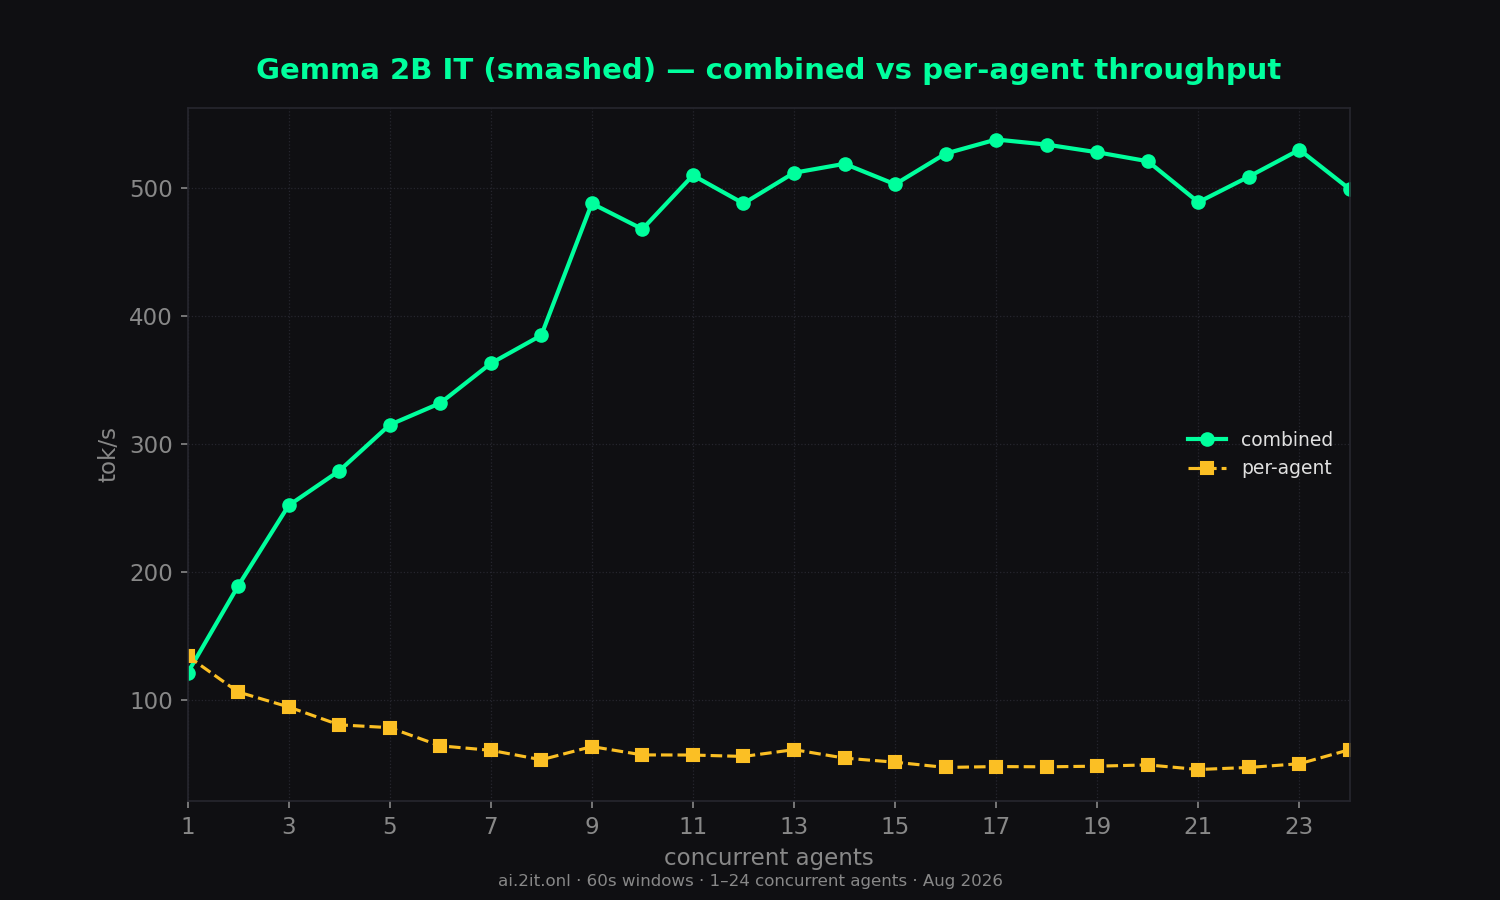
Middle of the pack and steady — 538 tok/s peak, and the best latency of the smaller models (61ms–2.4s).
Key findings
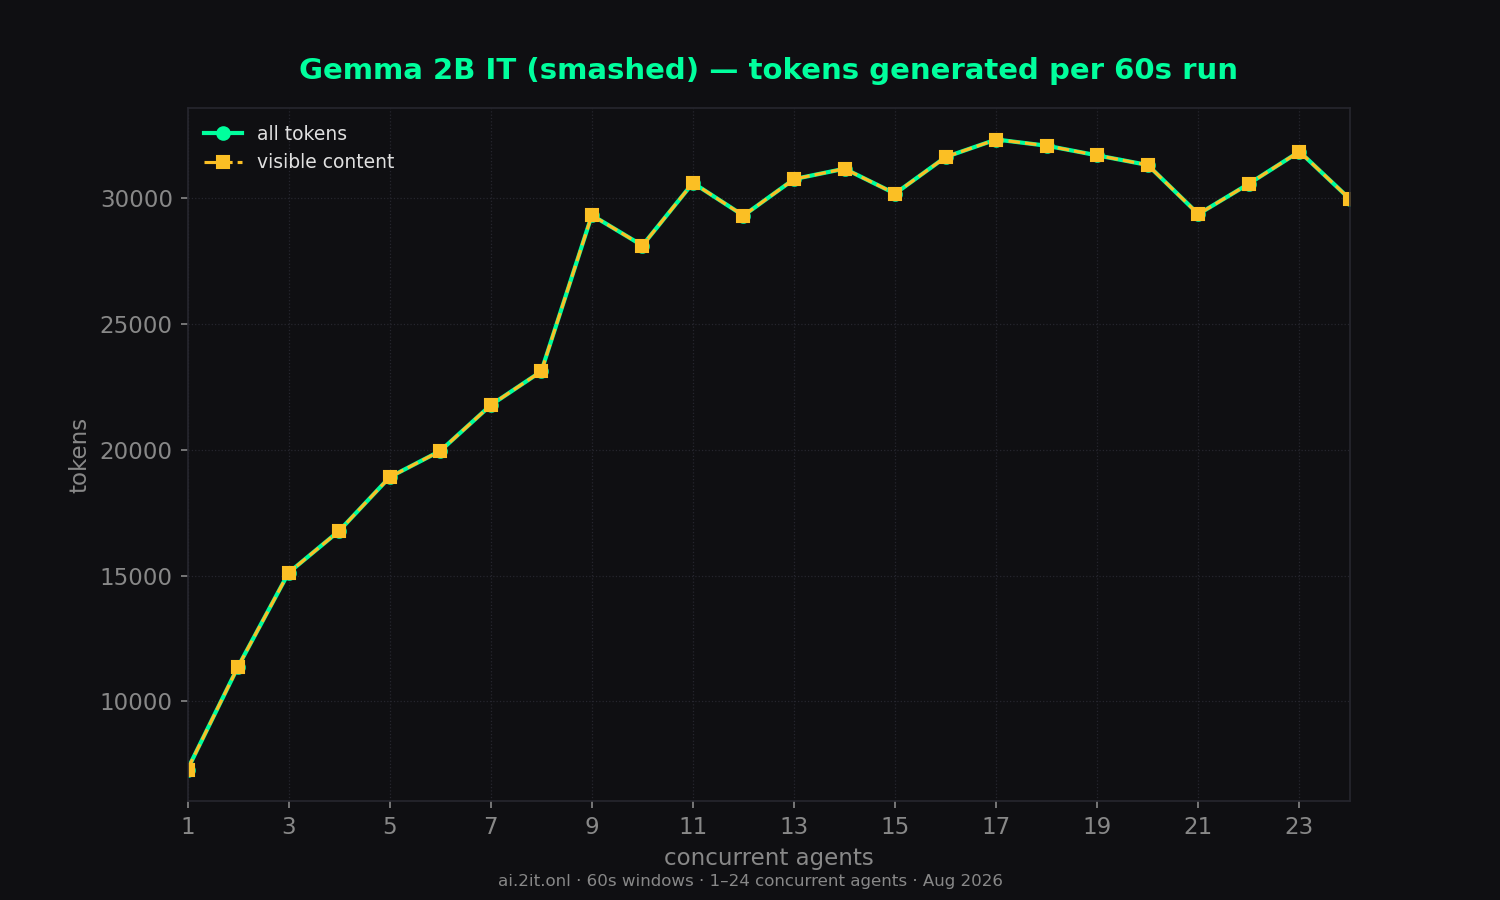
- Clean, all-content output: 0 reasoning tokens everywhere.
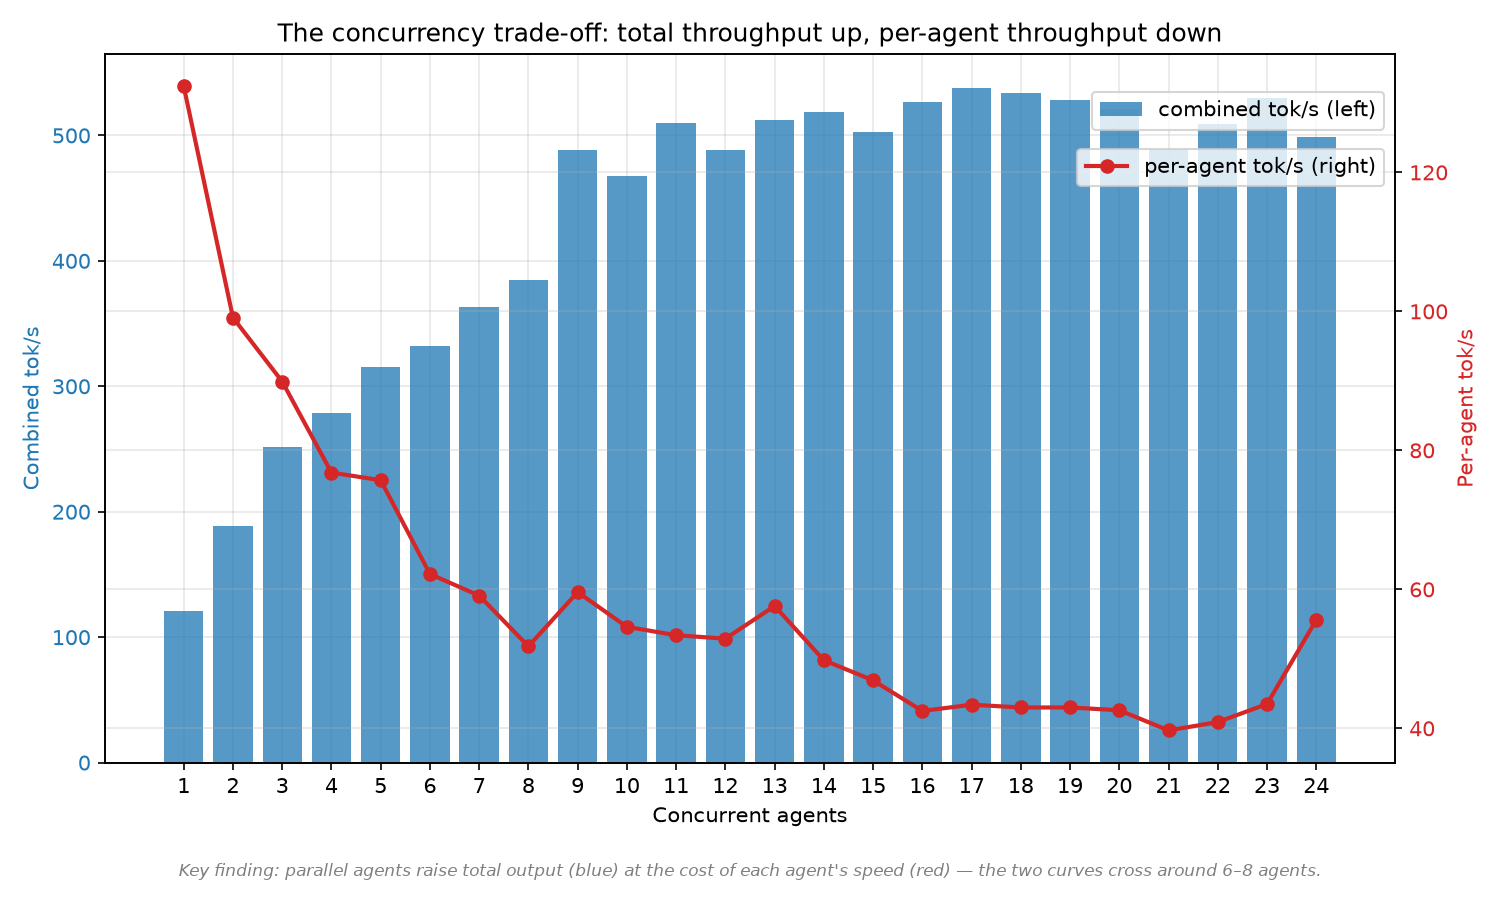
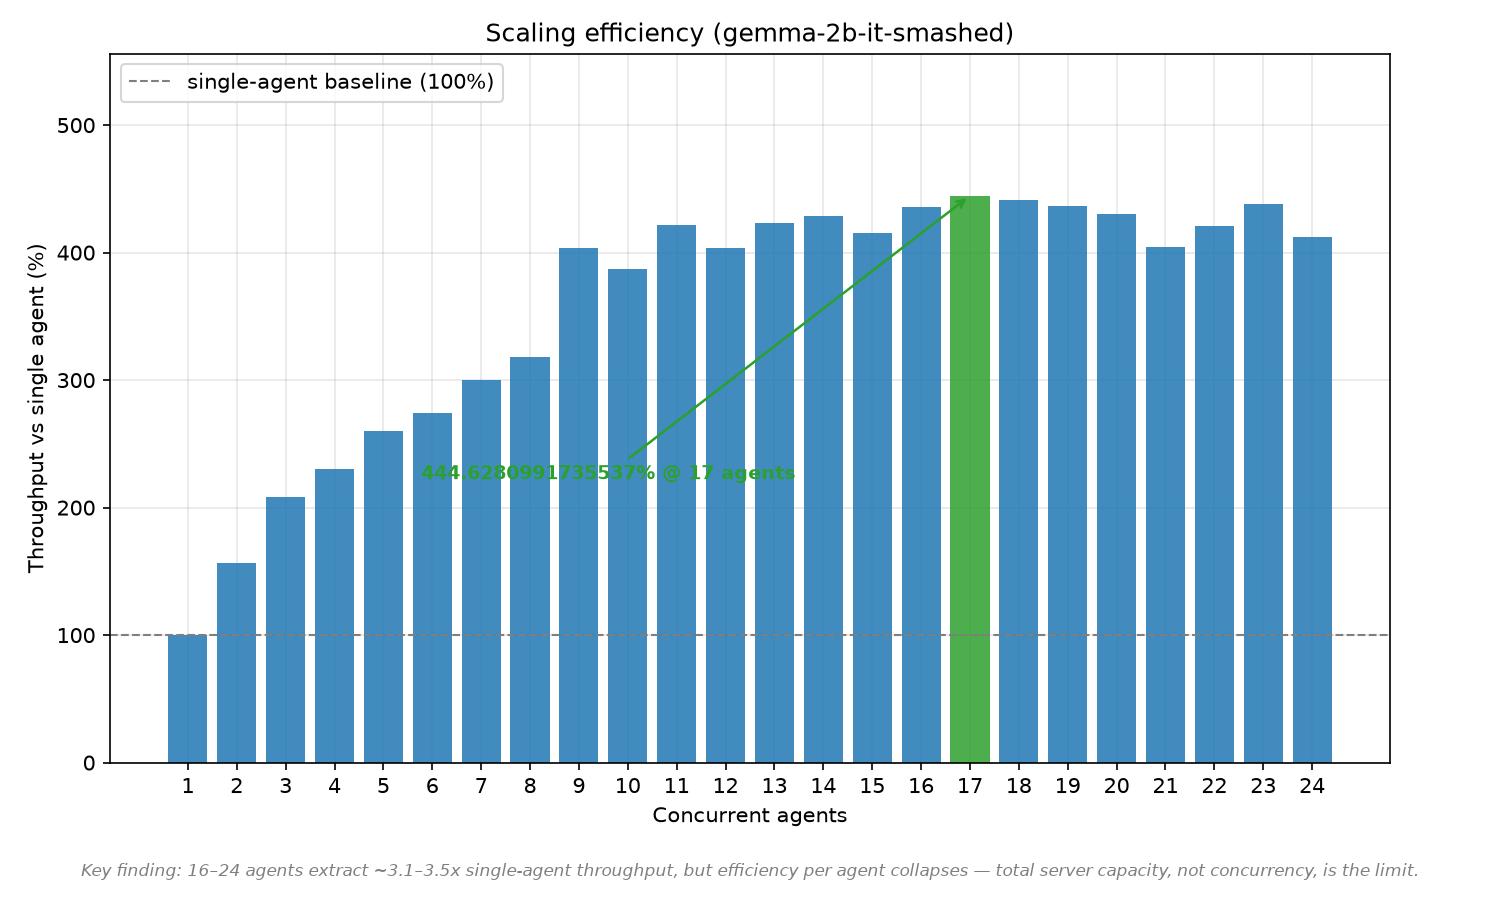
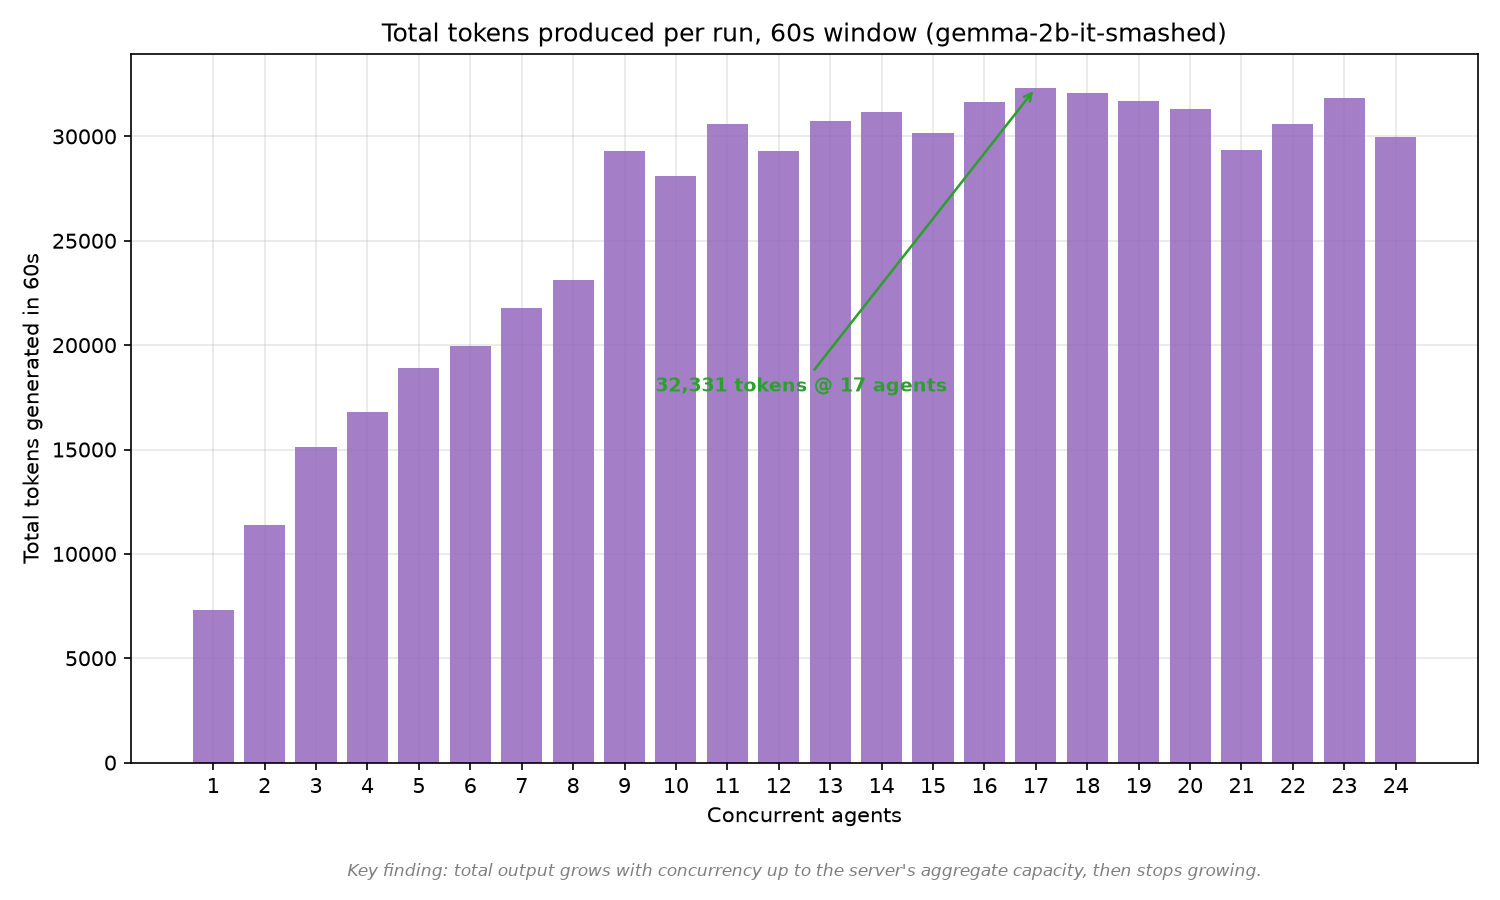
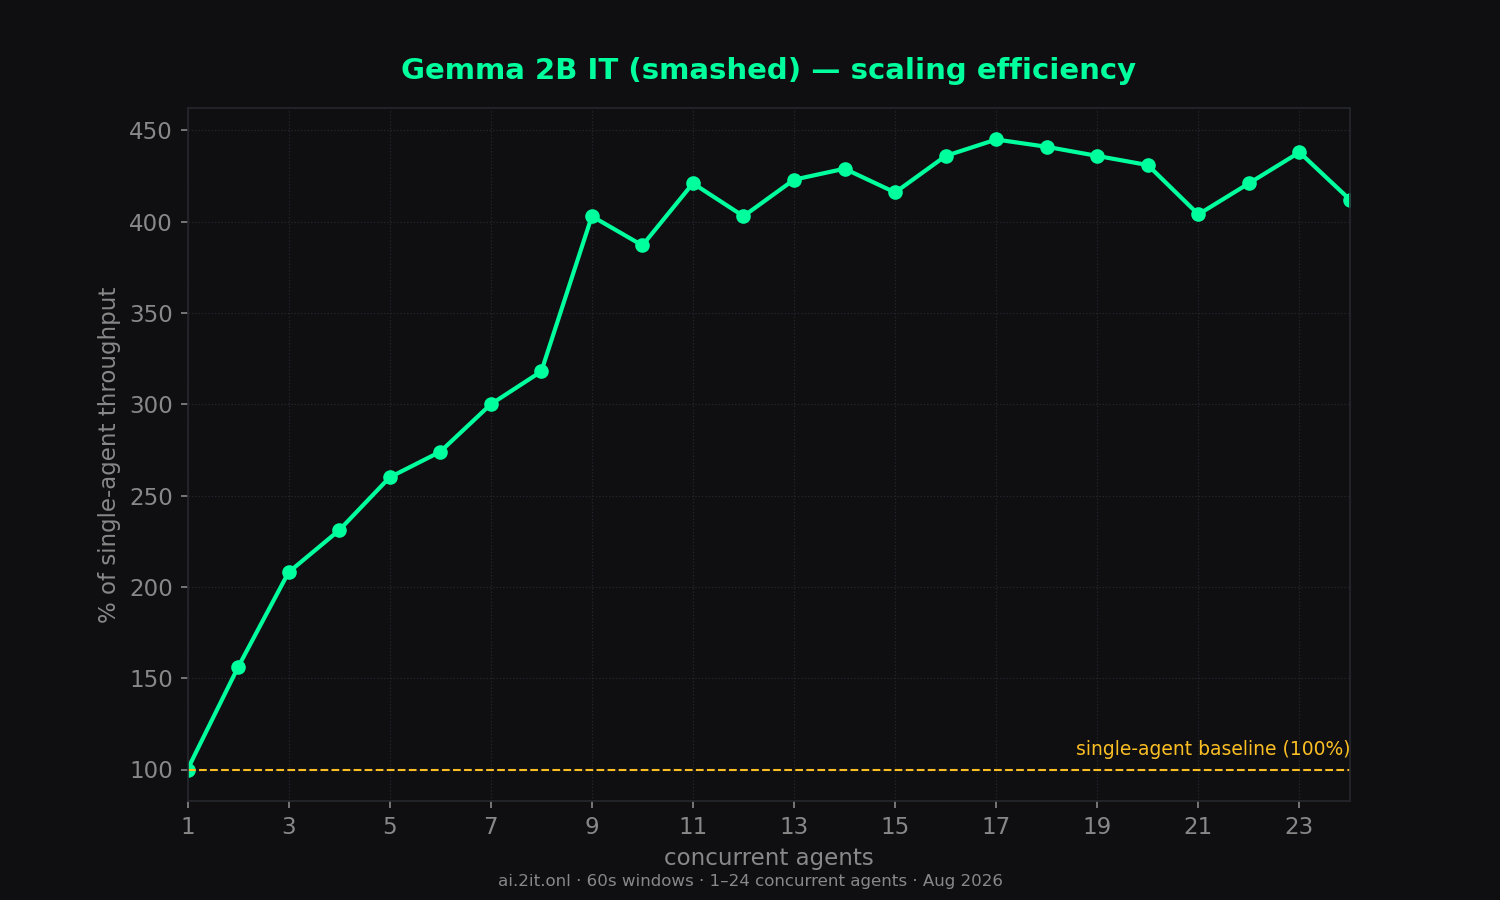
- Steady scaling, modest ceiling: combined throughput rises from 121 tok/s solo to 538 tok/s at 17 agents (4.5x), holding ~490–538 from 9–24. A solid middle-of-the-pack profile.
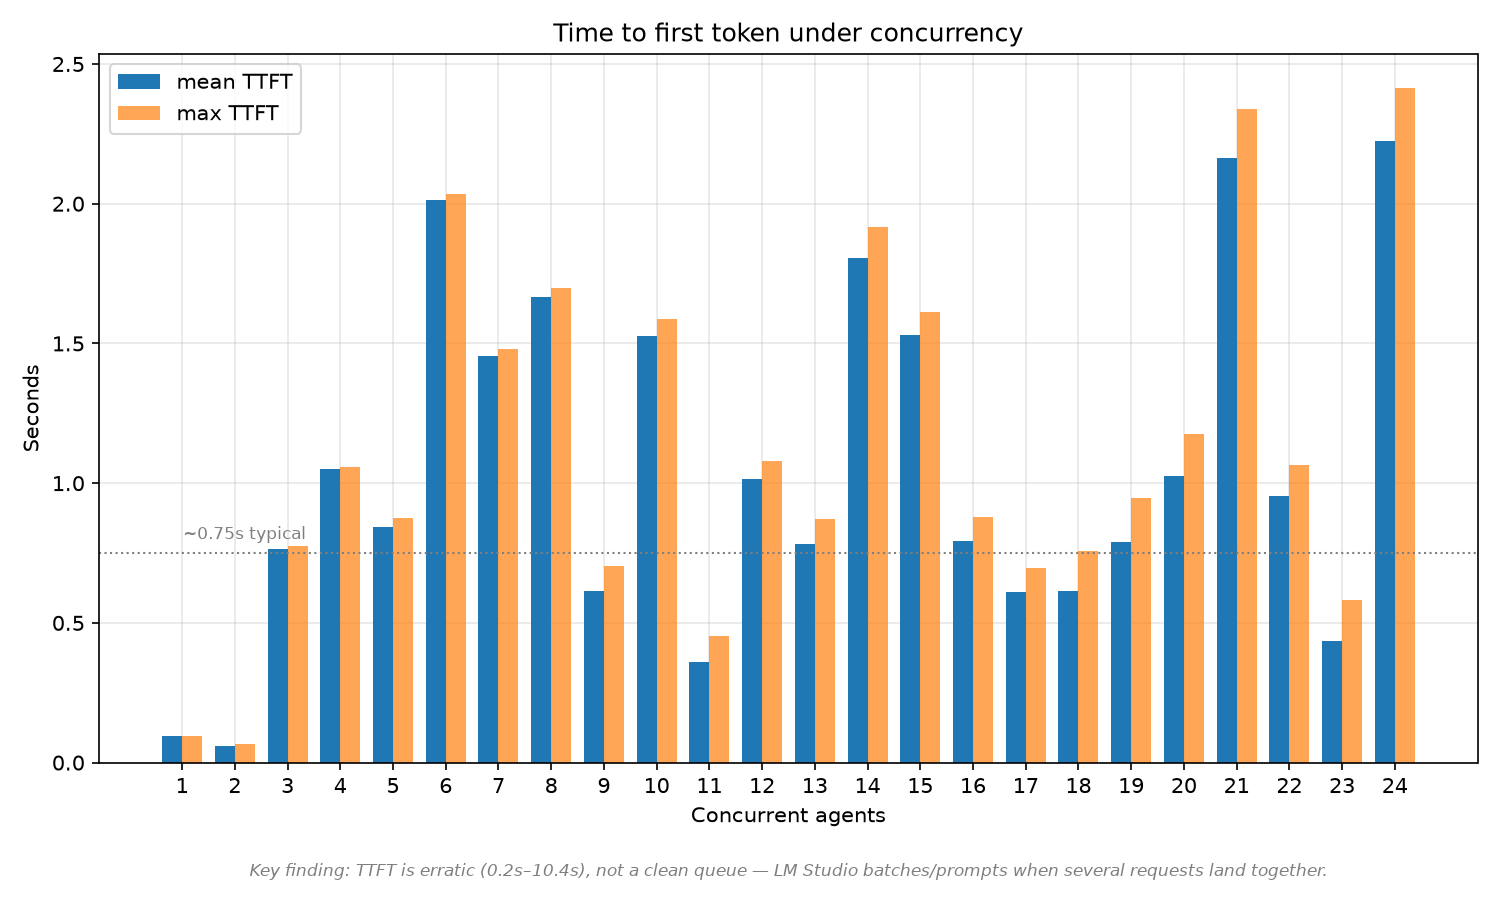
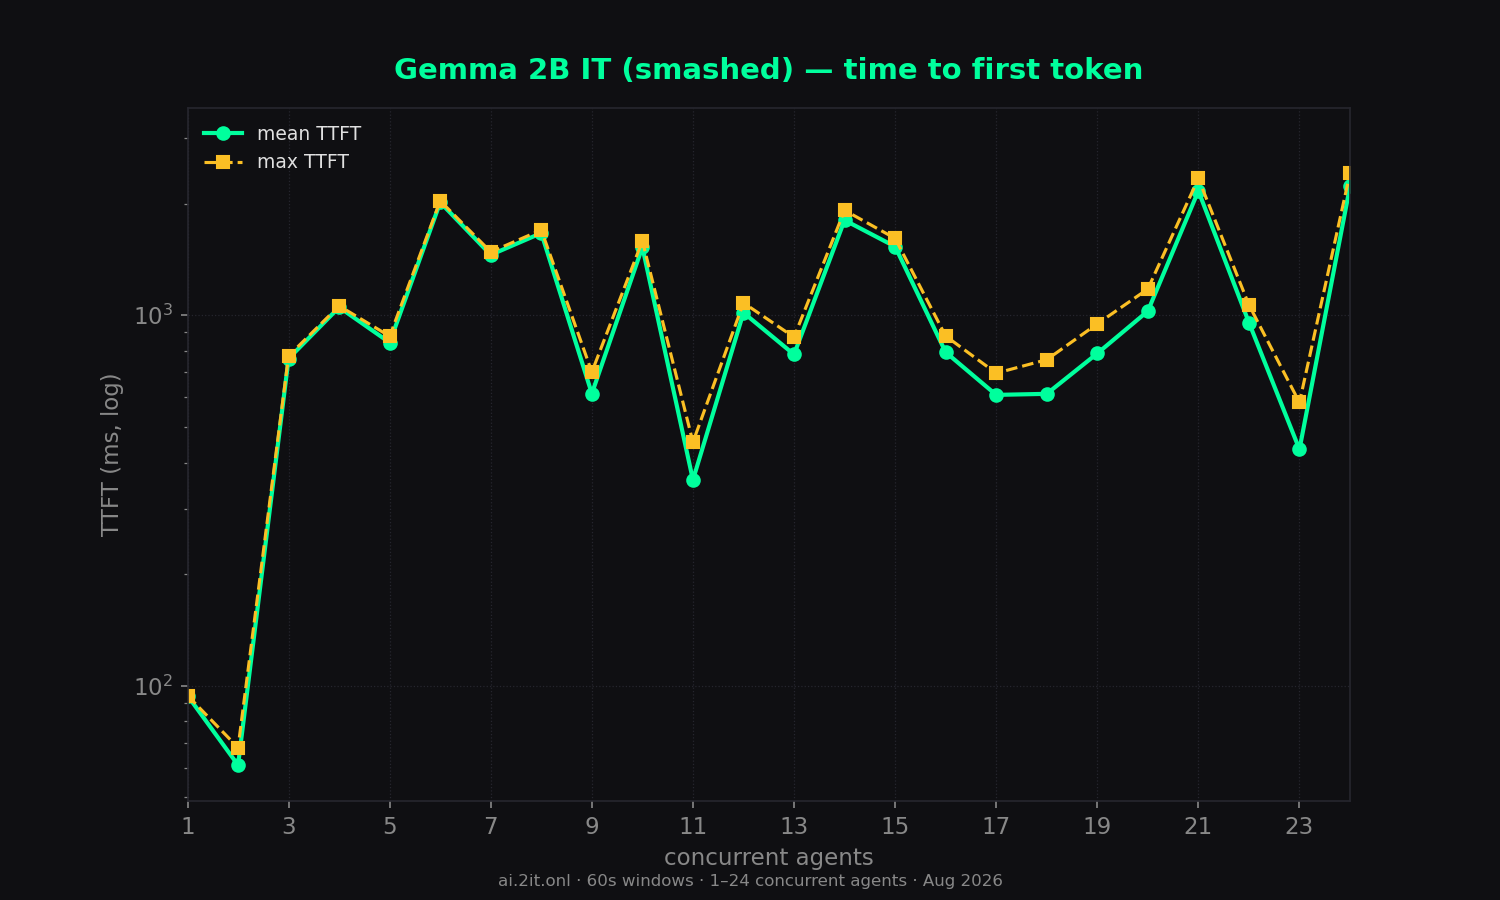
- Best latency of the smaller models: TTFT stays in the 61ms–2.4s range across the entire sweep — no thinking-model spikes, and better than most.
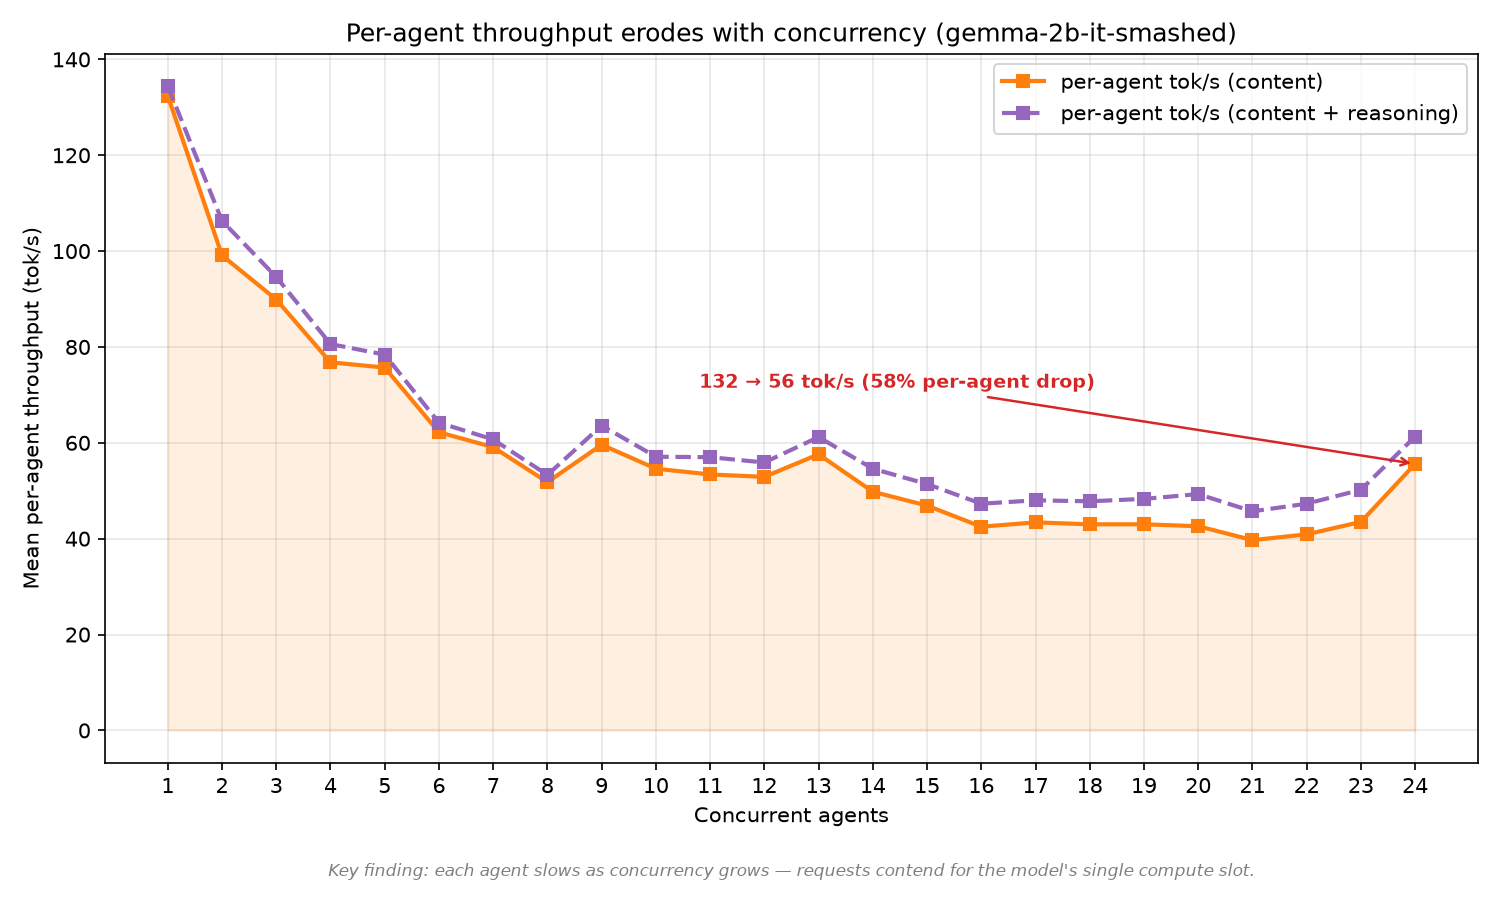
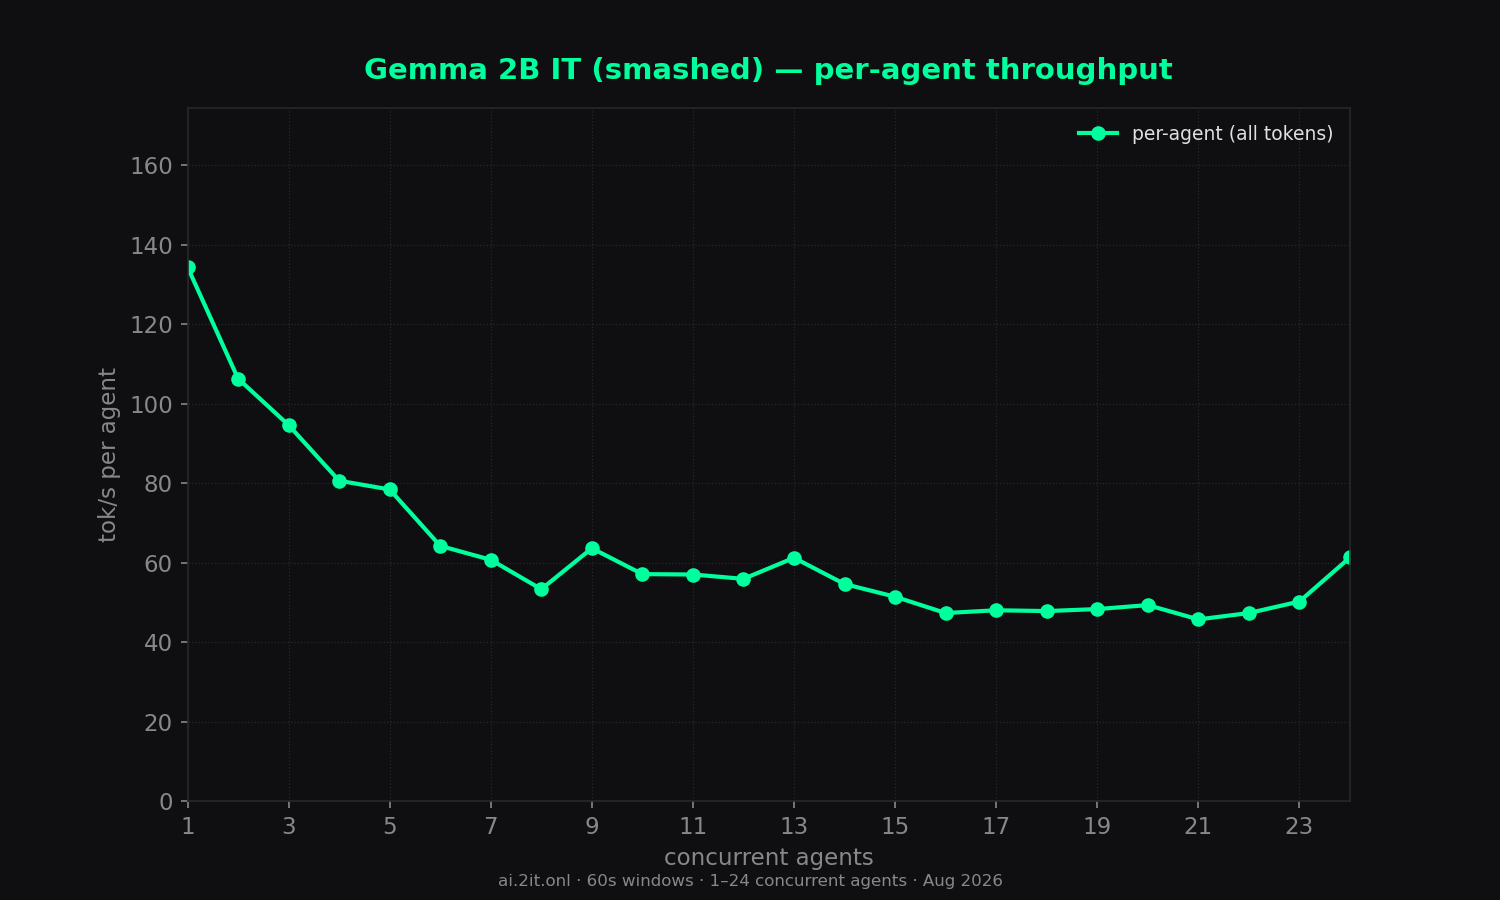
- Per-agent speed: ~43–50 tok/s at high concurrency (vs 121 solo).
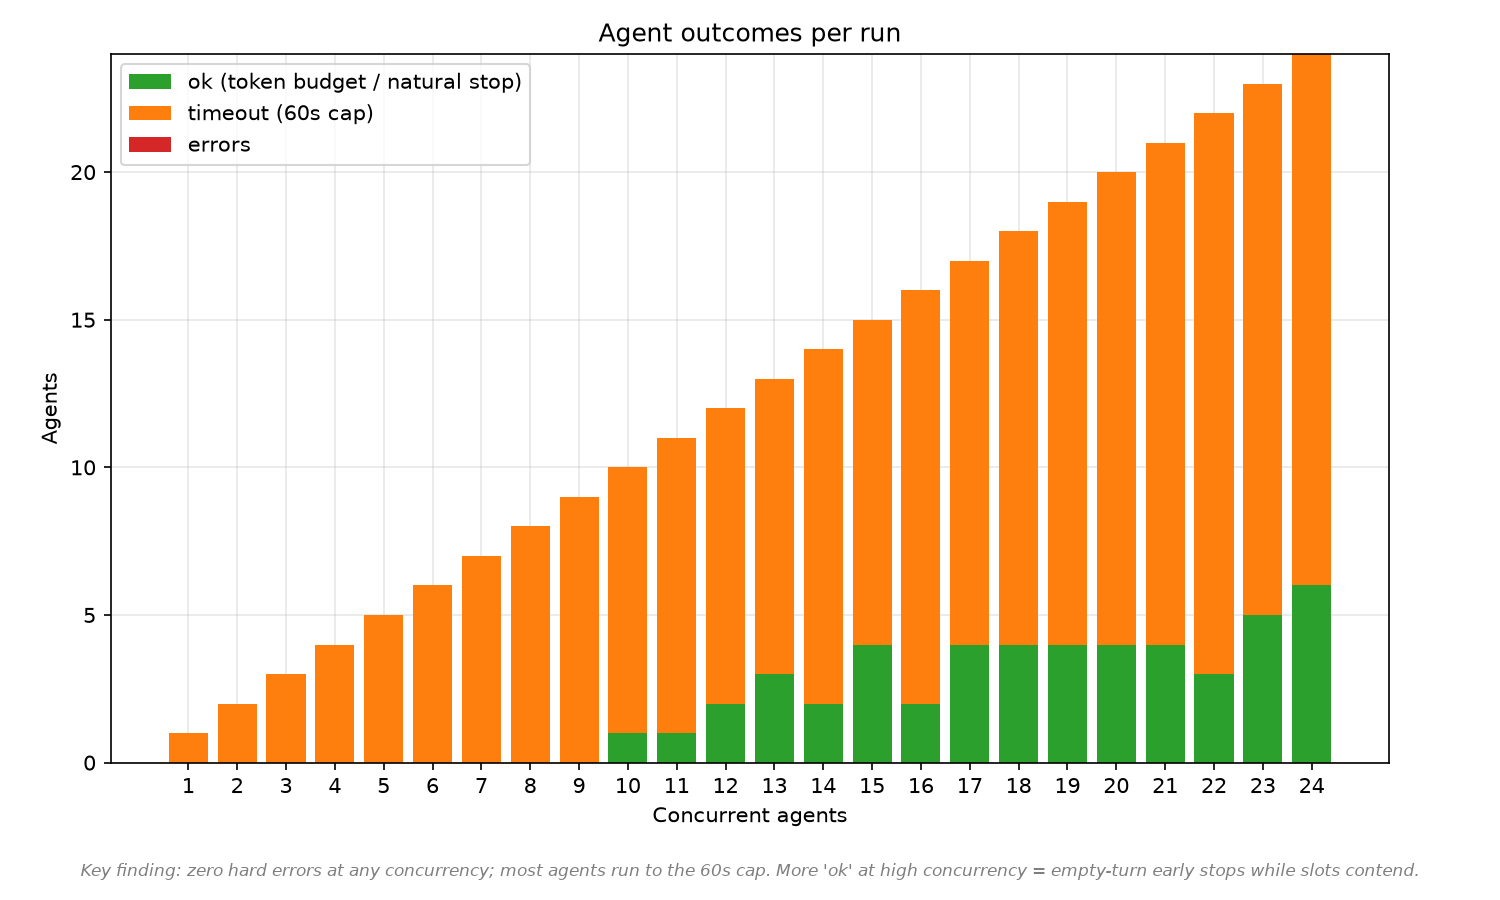
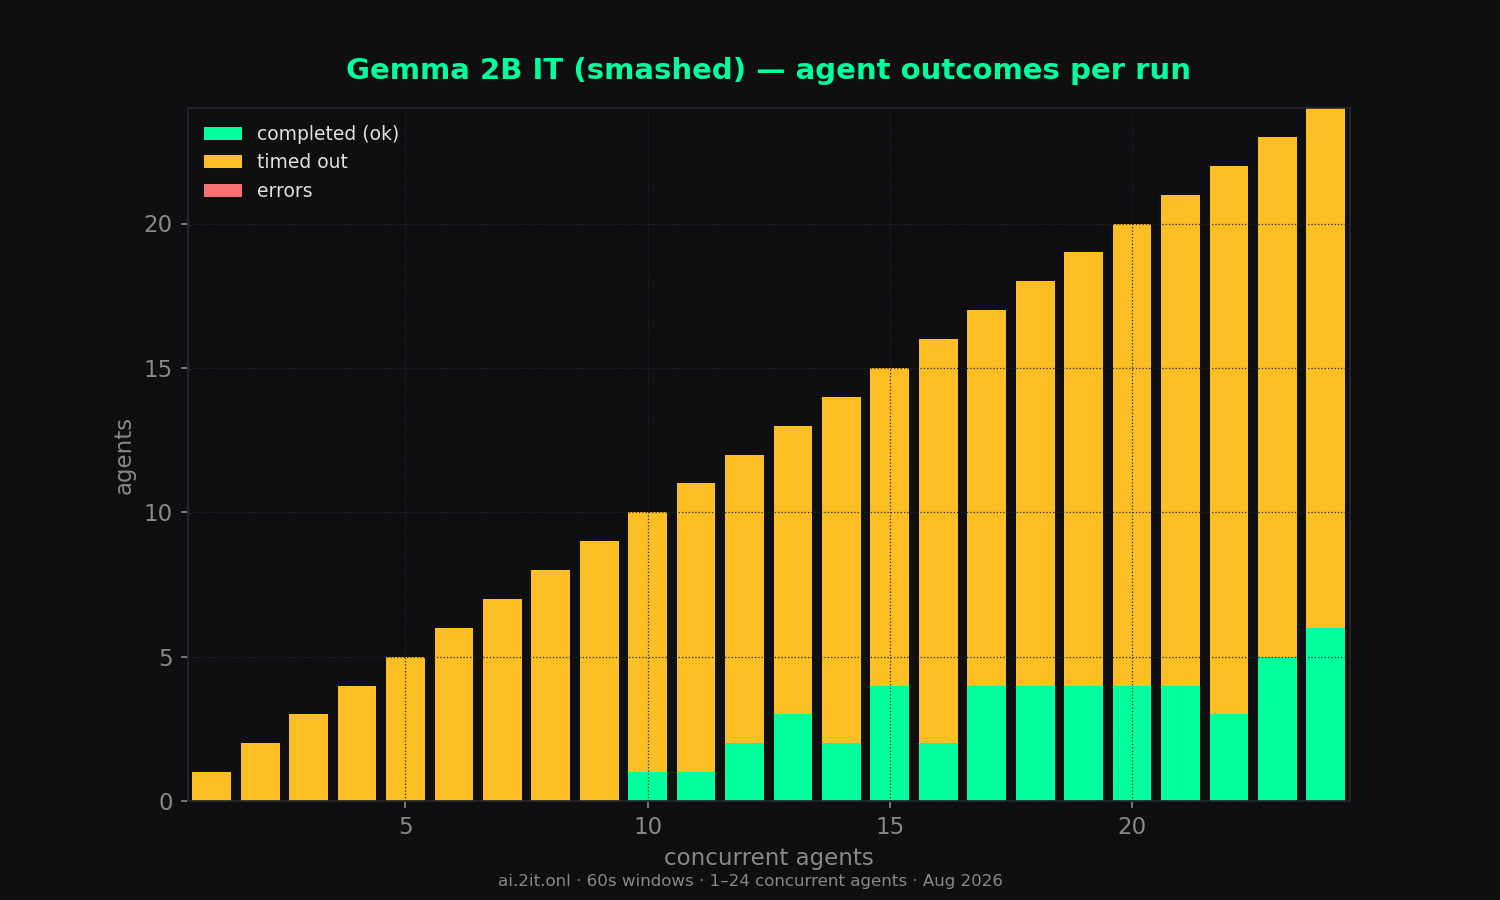
- Errors: 0 across all 24 runs.
Sweep — total concurrency 1–24
| agents | wall (s) | content | reason | total | comb tok/s | comb all | per-agent | per-agent all | scale % | TTFT mean | TTFT max | ok | timeout | err |
|---|---|---|---|---|---|---|---|---|---|---|---|---|---|---|
| 1 | 60.0 | 7,289 | 0 | 7,289 | 121 | 121 | 132.4 | 134.4 | 100% | 94ms | 94ms | 0 | 1 | 0 |
| 2 | 60.0 | 11,374 | 0 | 11,374 | 189 | 189 | 99.1 | 106.3 | 156% | 61ms | 68ms | 0 | 2 | 0 |
| 3 | 60.0 | 15,109 | 0 | 15,109 | 252 | 252 | 89.9 | 94.6 | 208% | 763ms | 776ms | 0 | 3 | 0 |
| 4 | 60.0 | 16,773 | 0 | 16,773 | 279 | 279 | 76.8 | 80.6 | 231% | 1.1s | 1.1s | 0 | 4 | 0 |
| 5 | 60.0 | 18,909 | 0 | 18,909 | 315 | 315 | 75.7 | 78.4 | 260% | 843ms | 877ms | 0 | 5 | 0 |
| 6 | 60.1 | 19,950 | 0 | 19,950 | 332 | 332 | 62.2 | 64.2 | 274% | 2.0s | 2.0s | 0 | 6 | 0 |
| 7 | 60.0 | 21,772 | 0 | 21,772 | 363 | 363 | 59.1 | 60.7 | 300% | 1.5s | 1.5s | 0 | 7 | 0 |
| 8 | 60.0 | 23,116 | 0 | 23,116 | 385 | 385 | 51.8 | 53.3 | 318% | 1.7s | 1.7s | 0 | 8 | 0 |
| 9 | 60.0 | 29,323 | 0 | 29,323 | 488 | 488 | 59.6 | 63.6 | 403% | 614ms | 702ms | 0 | 9 | 0 |
| 10 | 60.0 | 28,116 | 0 | 28,116 | 468 | 468 | 54.6 | 57.1 | 387% | 1.5s | 1.6s | 1 | 9 | 0 |
| 11 | 60.1 | 30,608 | 0 | 30,608 | 510 | 510 | 53.4 | 57.0 | 421% | 359ms | 454ms | 1 | 10 | 0 |
| 12 | 60.1 | 29,305 | 0 | 29,305 | 488 | 488 | 52.9 | 55.9 | 403% | 1.0s | 1.1s | 2 | 10 | 0 |
| 13 | 60.0 | 30,756 | 0 | 30,756 | 512 | 512 | 57.6 | 61.2 | 423% | 783ms | 872ms | 3 | 10 | 0 |
| 14 | 60.1 | 31,170 | 0 | 31,170 | 519 | 519 | 49.8 | 54.6 | 429% | 1.8s | 1.9s | 2 | 12 | 0 |
| 15 | 60.1 | 30,180 | 0 | 30,180 | 503 | 503 | 46.9 | 51.4 | 416% | 1.5s | 1.6s | 4 | 11 | 0 |
| 16 | 60.0 | 31,634 | 0 | 31,634 | 527 | 527 | 42.5 | 47.3 | 436% | 794ms | 878ms | 2 | 14 | 0 |
| 17 peak | 60.1 | 32,331 | 0 | 32,331 | 538 | 538 | 43.4 | 48.0 | 445% | 609ms | 697ms | 4 | 13 | 0 |
| 18 | 60.1 | 32,084 | 0 | 32,084 | 534 | 534 | 43.0 | 47.8 | 441% | 613ms | 758ms | 4 | 14 | 0 |
| 19 | 60.1 | 31,700 | 0 | 31,700 | 528 | 528 | 43.0 | 48.3 | 436% | 788ms | 947ms | 4 | 15 | 0 |
| 20 | 60.1 | 31,317 | 0 | 31,317 | 521 | 521 | 42.6 | 49.3 | 431% | 1.0s | 1.2s | 4 | 16 | 0 |
| 21 | 60.1 | 29,364 | 0 | 29,364 | 489 | 489 | 39.7 | 45.7 | 404% | 2.2s | 2.3s | 4 | 17 | 0 |
| 22 | 60.1 | 30,572 | 0 | 30,572 | 509 | 509 | 40.9 | 47.3 | 421% | 955ms | 1.1s | 3 | 19 | 0 |
| 23 | 60.1 | 31,852 | 0 | 31,852 | 530 | 530 | 43.5 | 50.2 | 438% | 434ms | 581ms | 5 | 18 | 0 |
| 24 | 60.0 | 29,957 | 0 | 29,957 | 499 | 499 | 55.6 | 61.3 | 412% | 2.2s | 2.4s | 6 | 18 | 0 |
* burst artifact — agents queued ~11–16s then generated in a short burst; the per-agent timer inflates the number. Trust combined throughput and TTFT columns. Peak row = highest combined (all-token) throughput.
Charts
Raw data & downloads
- report.md5 KB
- sweep-summary.csv2 KB
- sweep-summary.json11 KB
- combined_throughput.png115 KB · original matplotlib export
- combined_vs_per_agent.png102 KB · original matplotlib export
- dashboard_1_24.png160 KB · original matplotlib export
- outcome_breakdown.png57 KB · original matplotlib export
- per_agent_throughput.png115 KB · original matplotlib export
- scaling_efficiency.png78 KB · original matplotlib export
- time_to_first_token.png57 KB · original matplotlib export
- total_tokens_generated.png70 KB · original matplotlib export