Gemma 4 E2B
server model id:
google/gemma-4-e2bthinkingKV Q8_0ctx 32k2B params
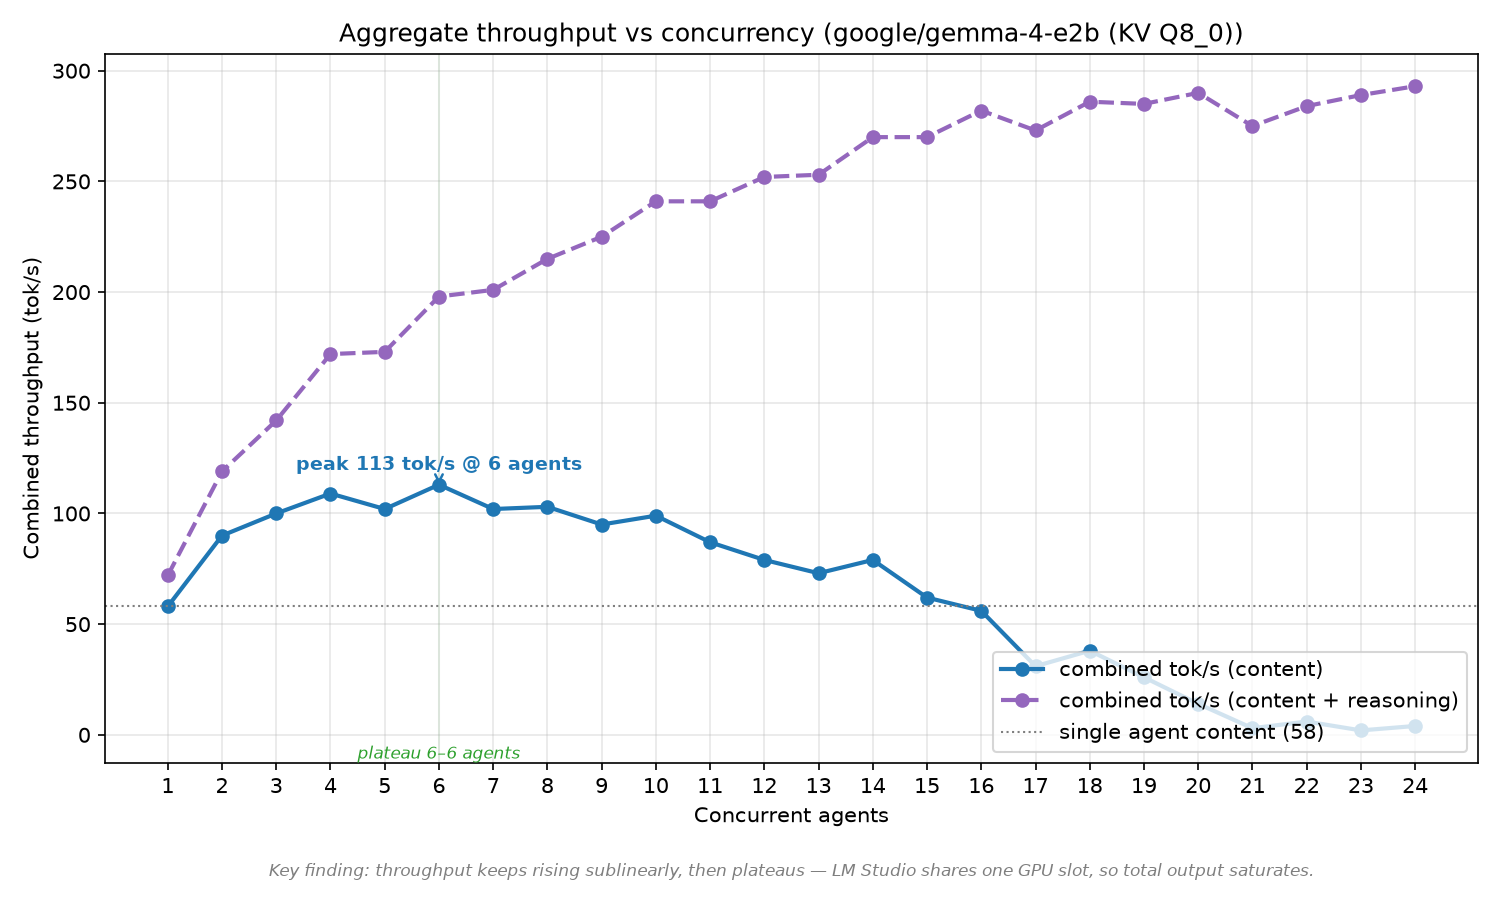
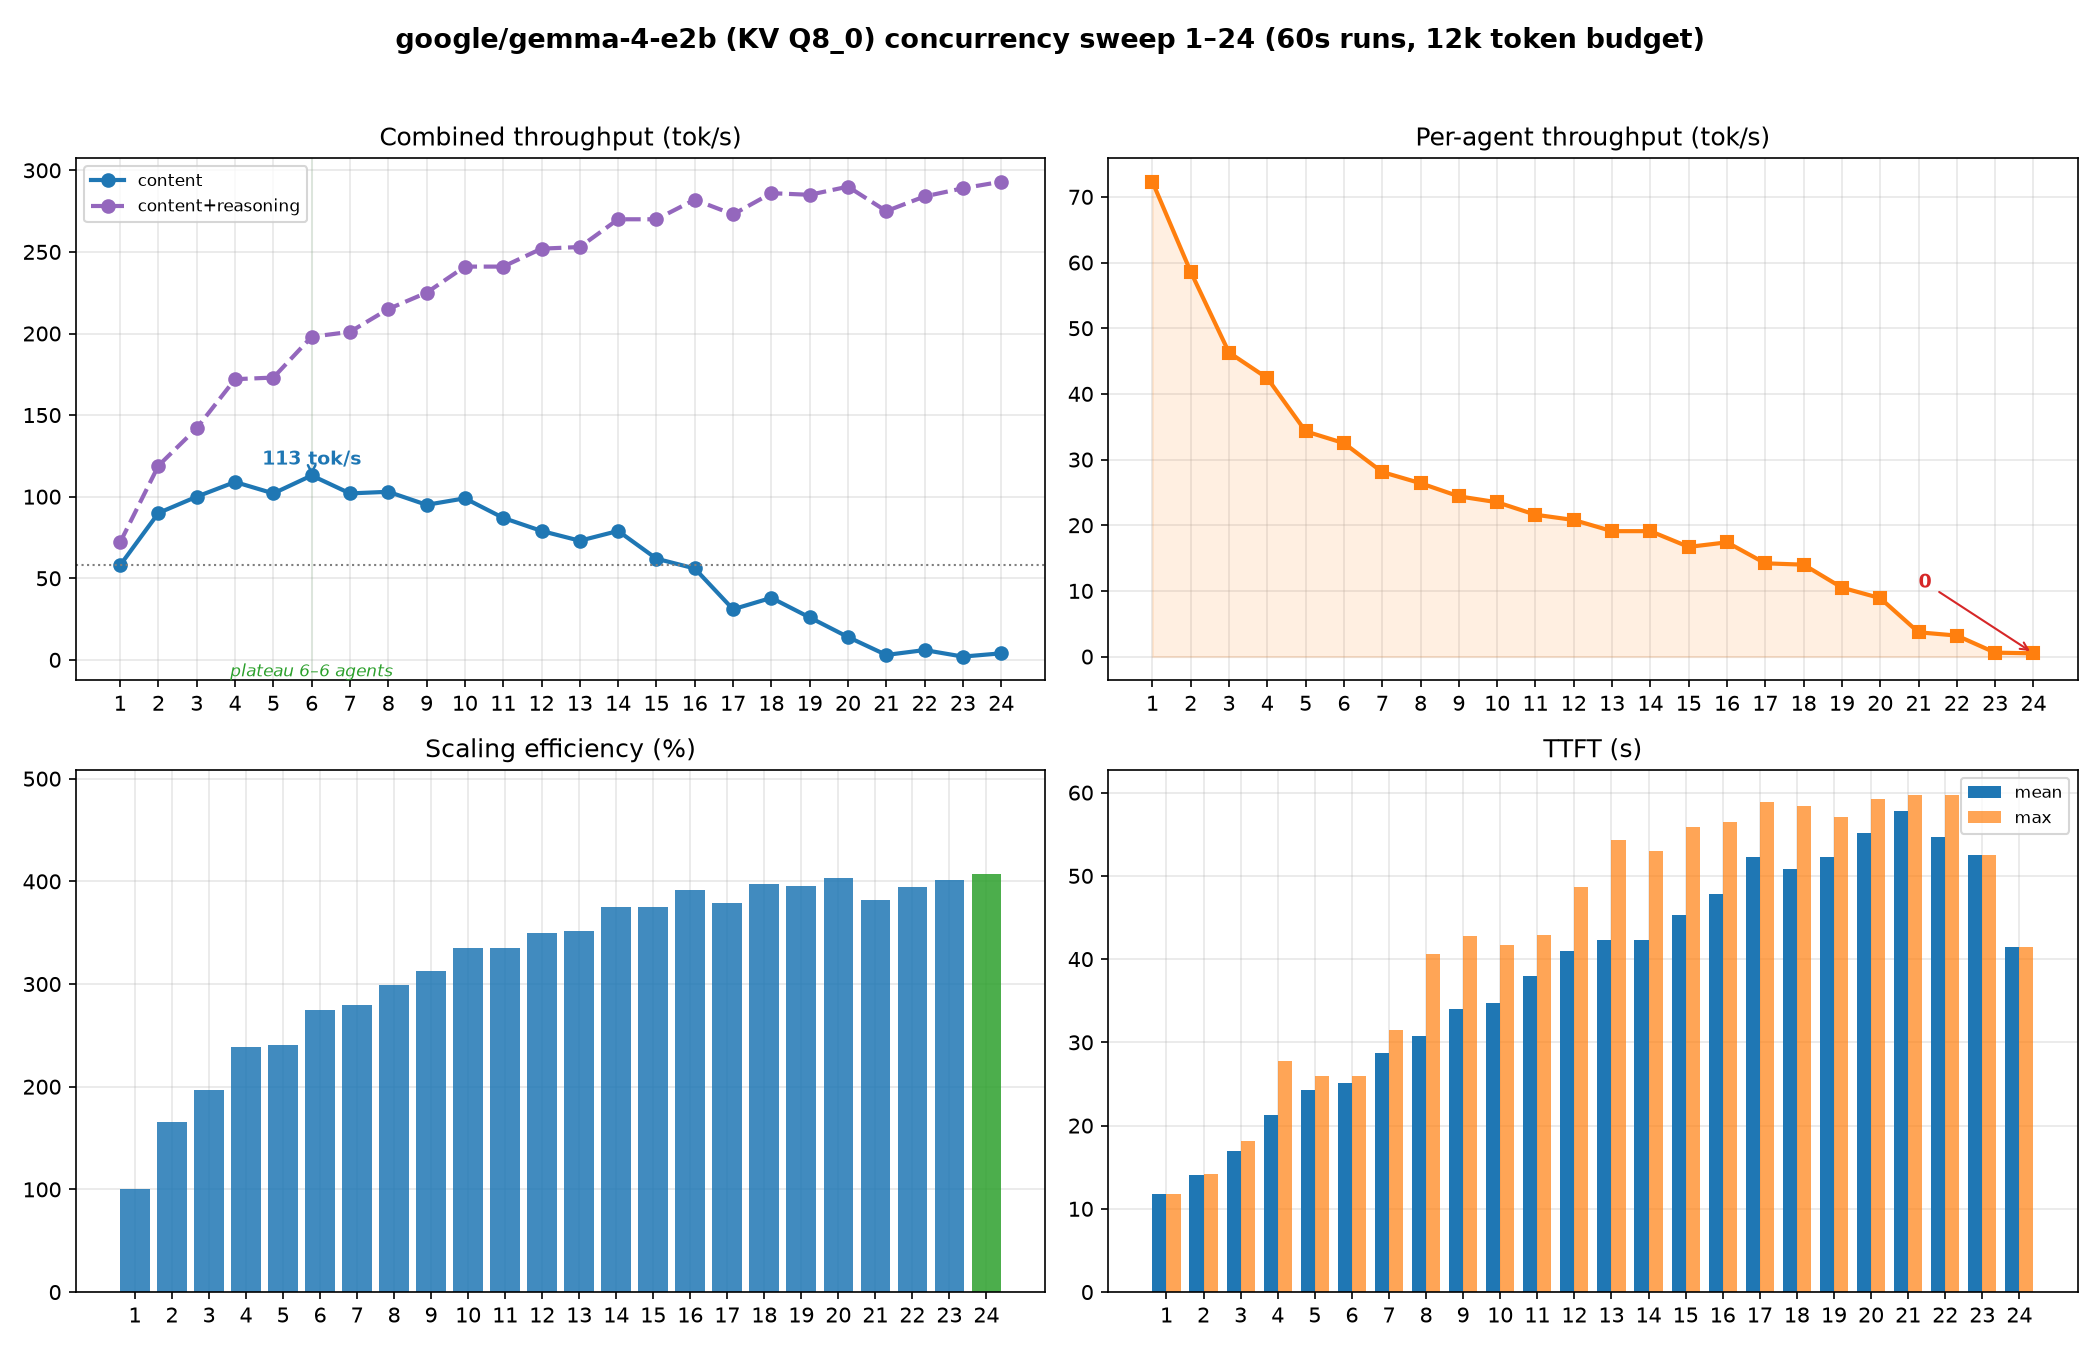
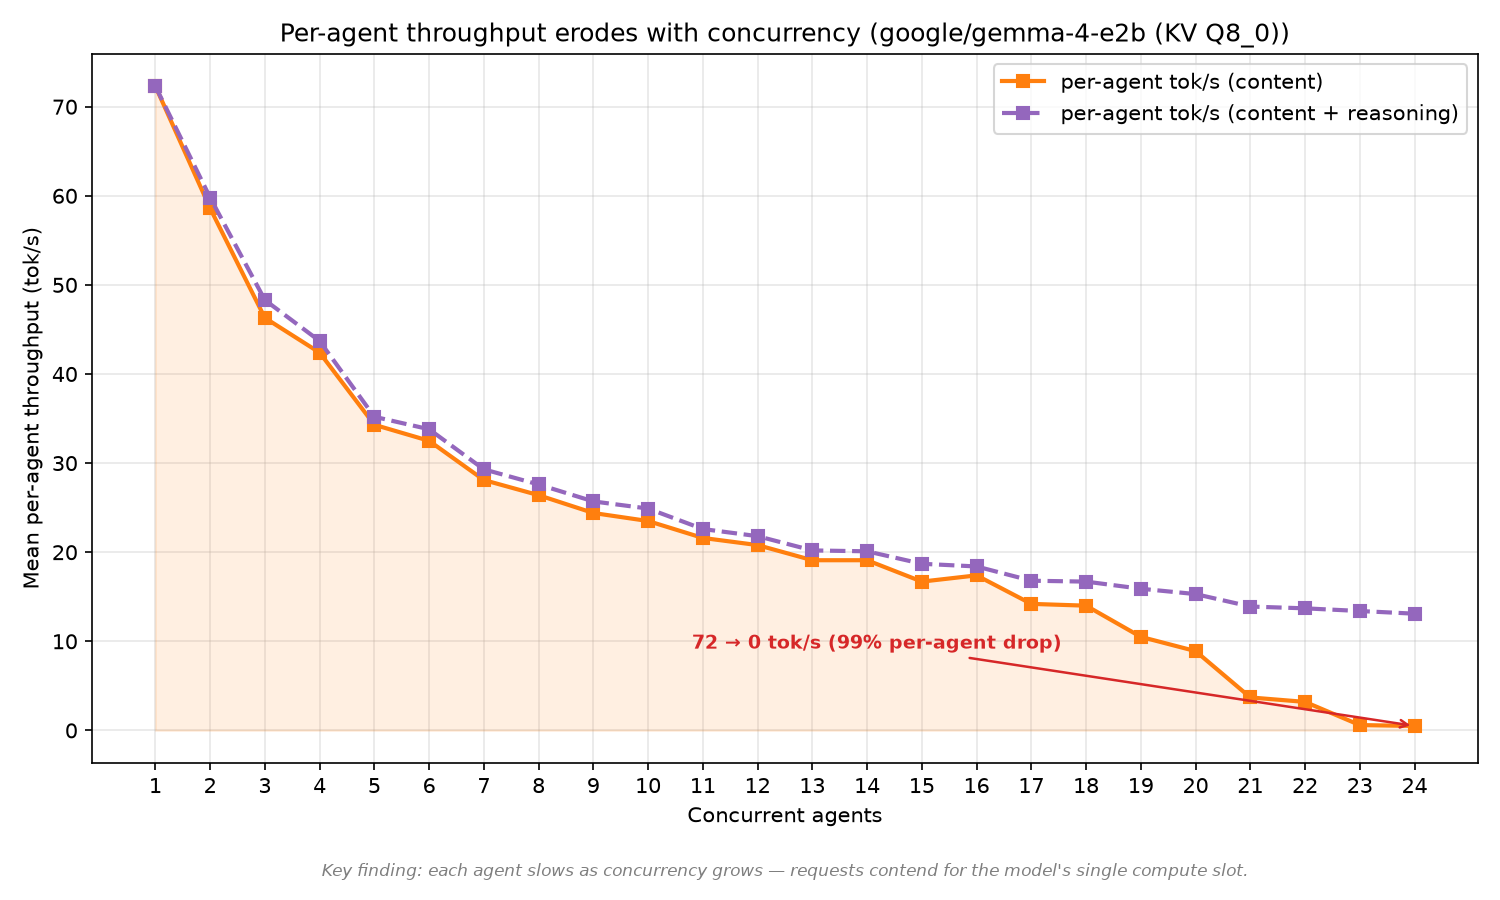
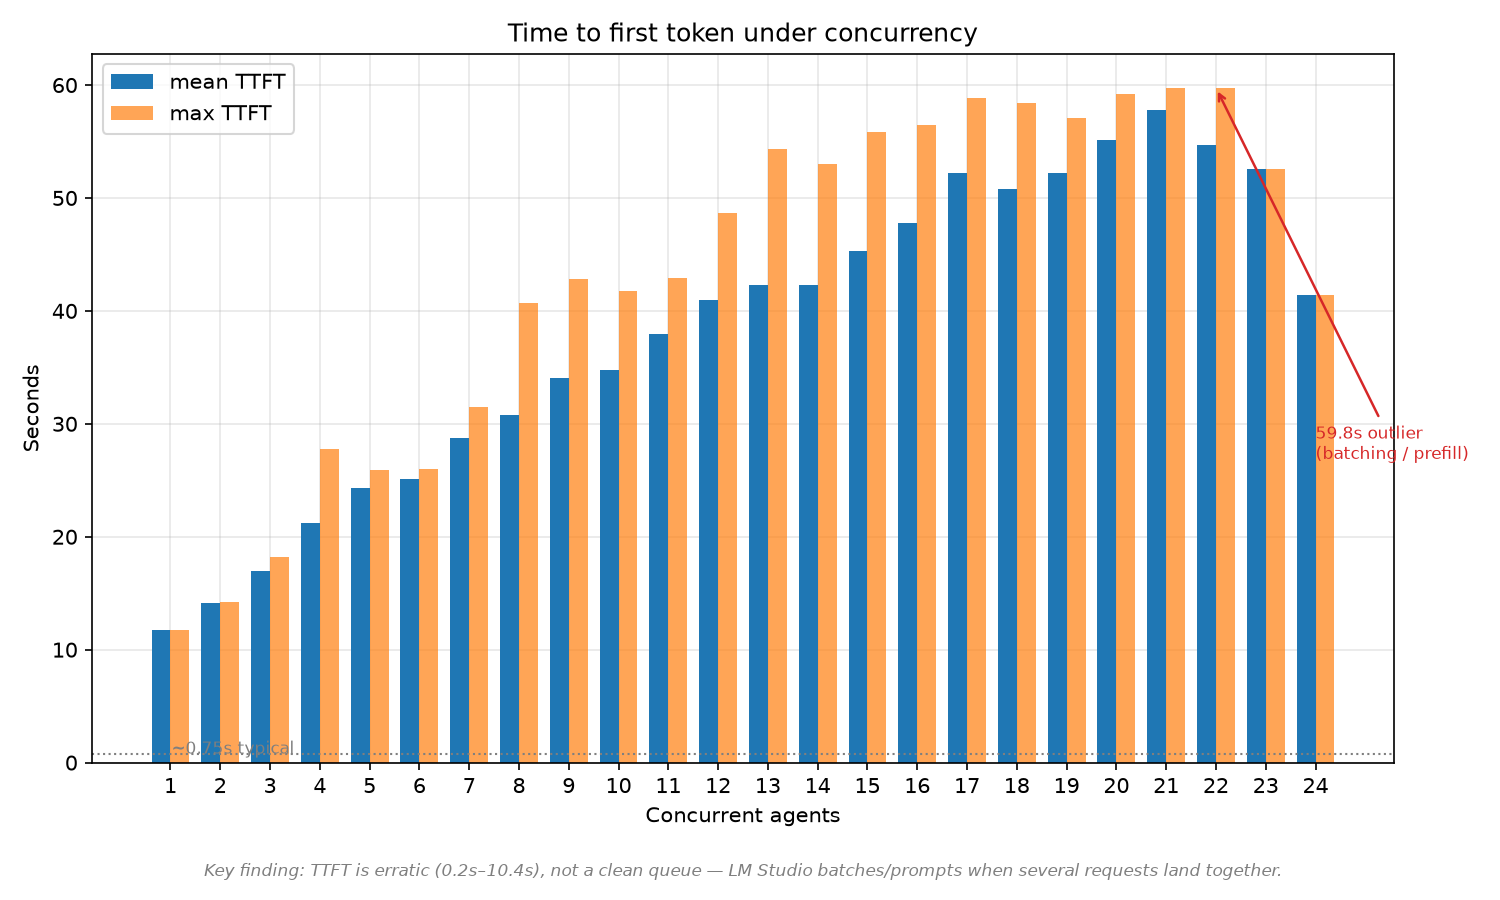
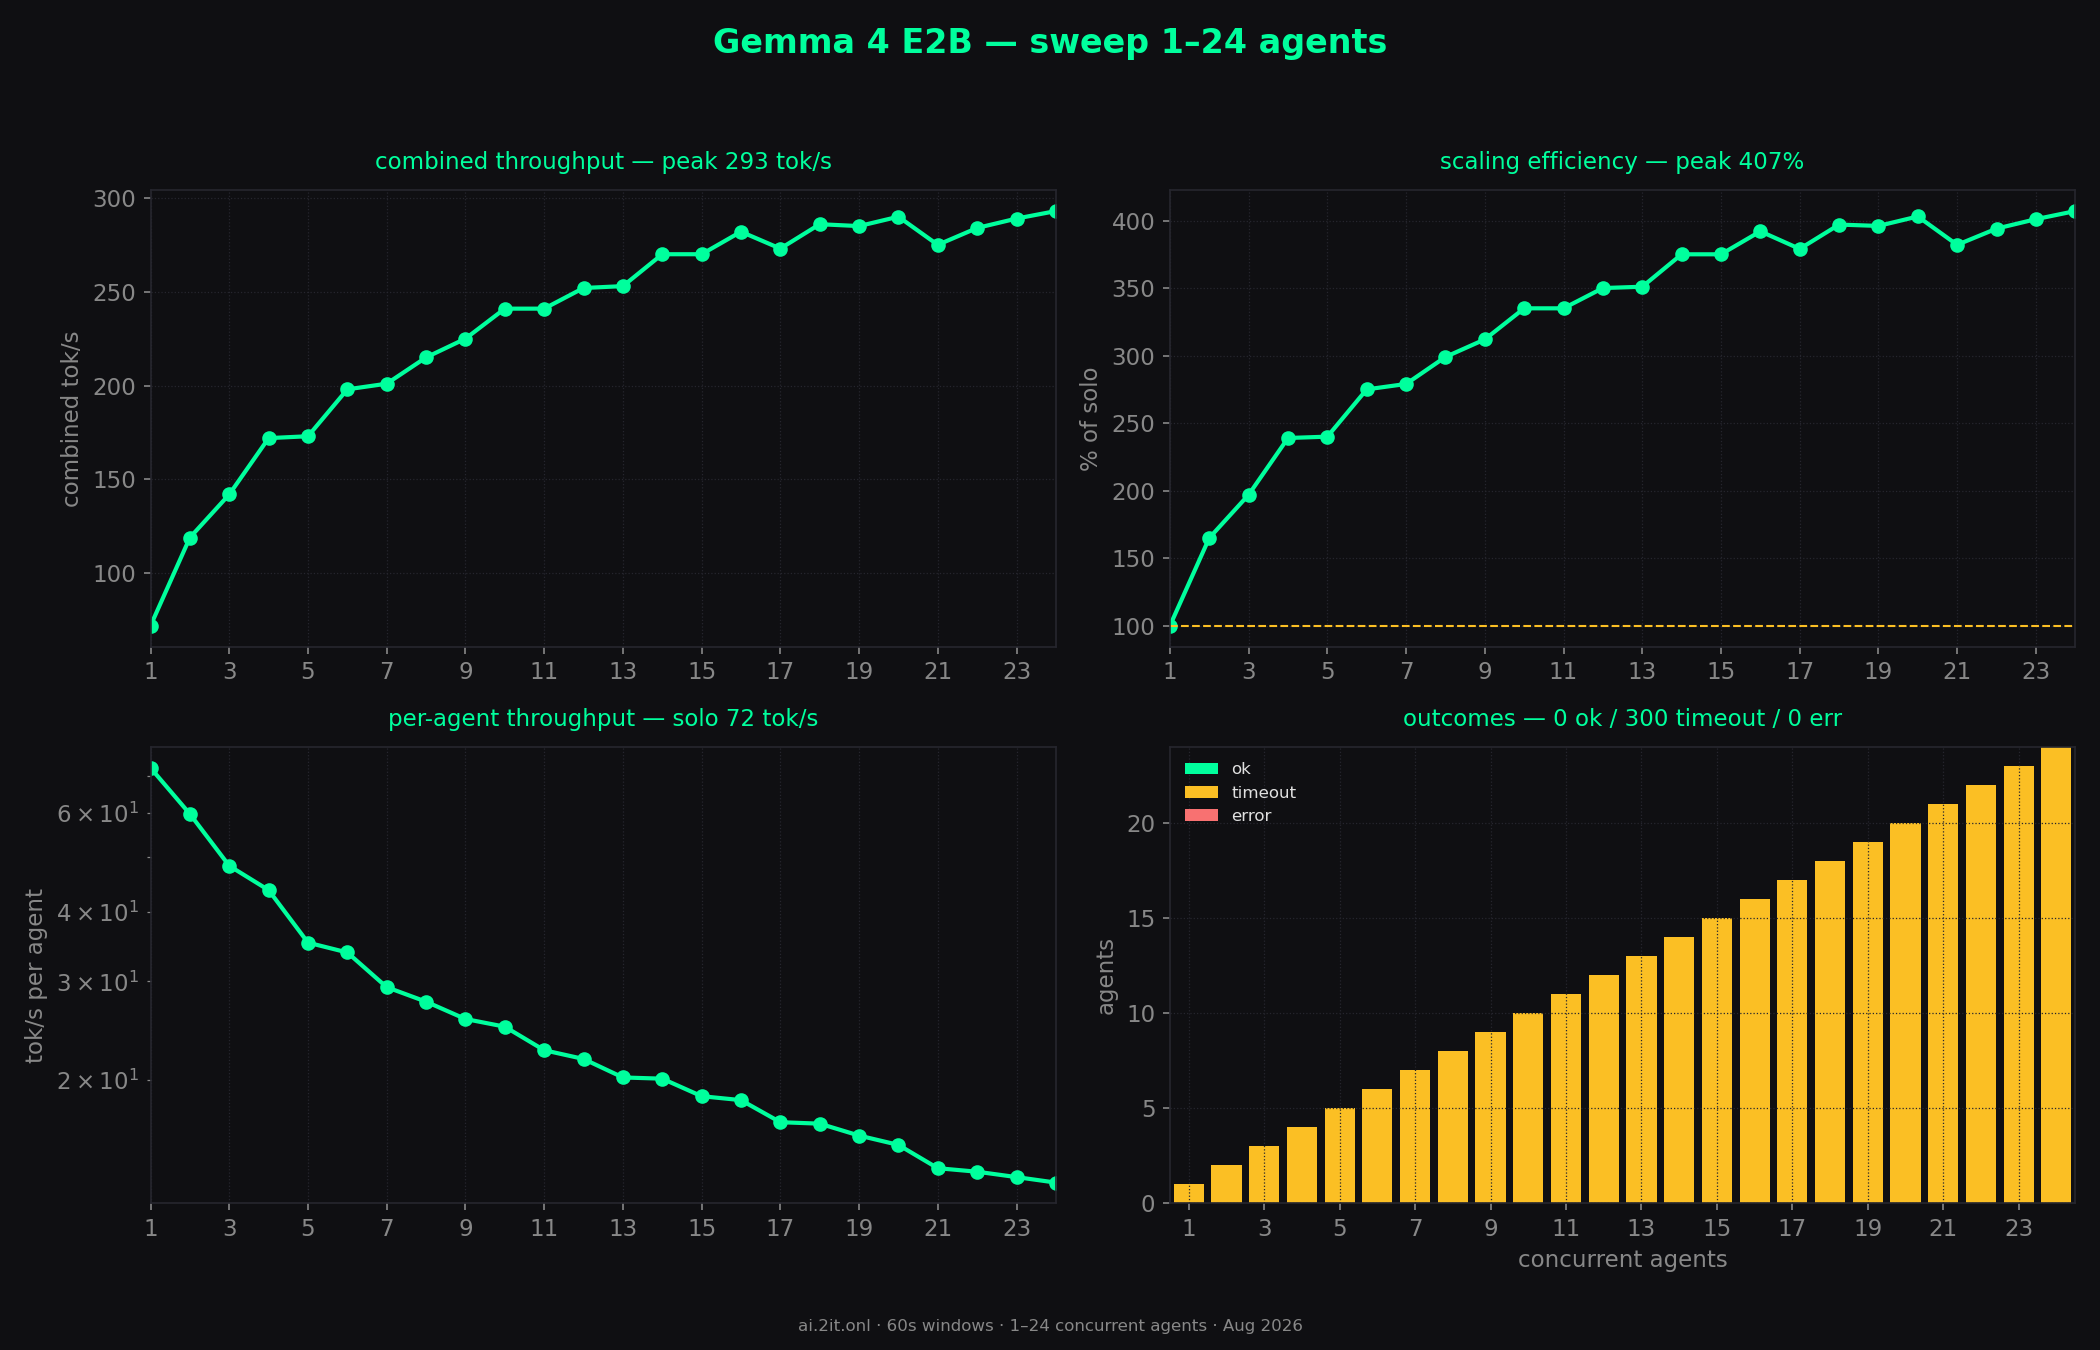
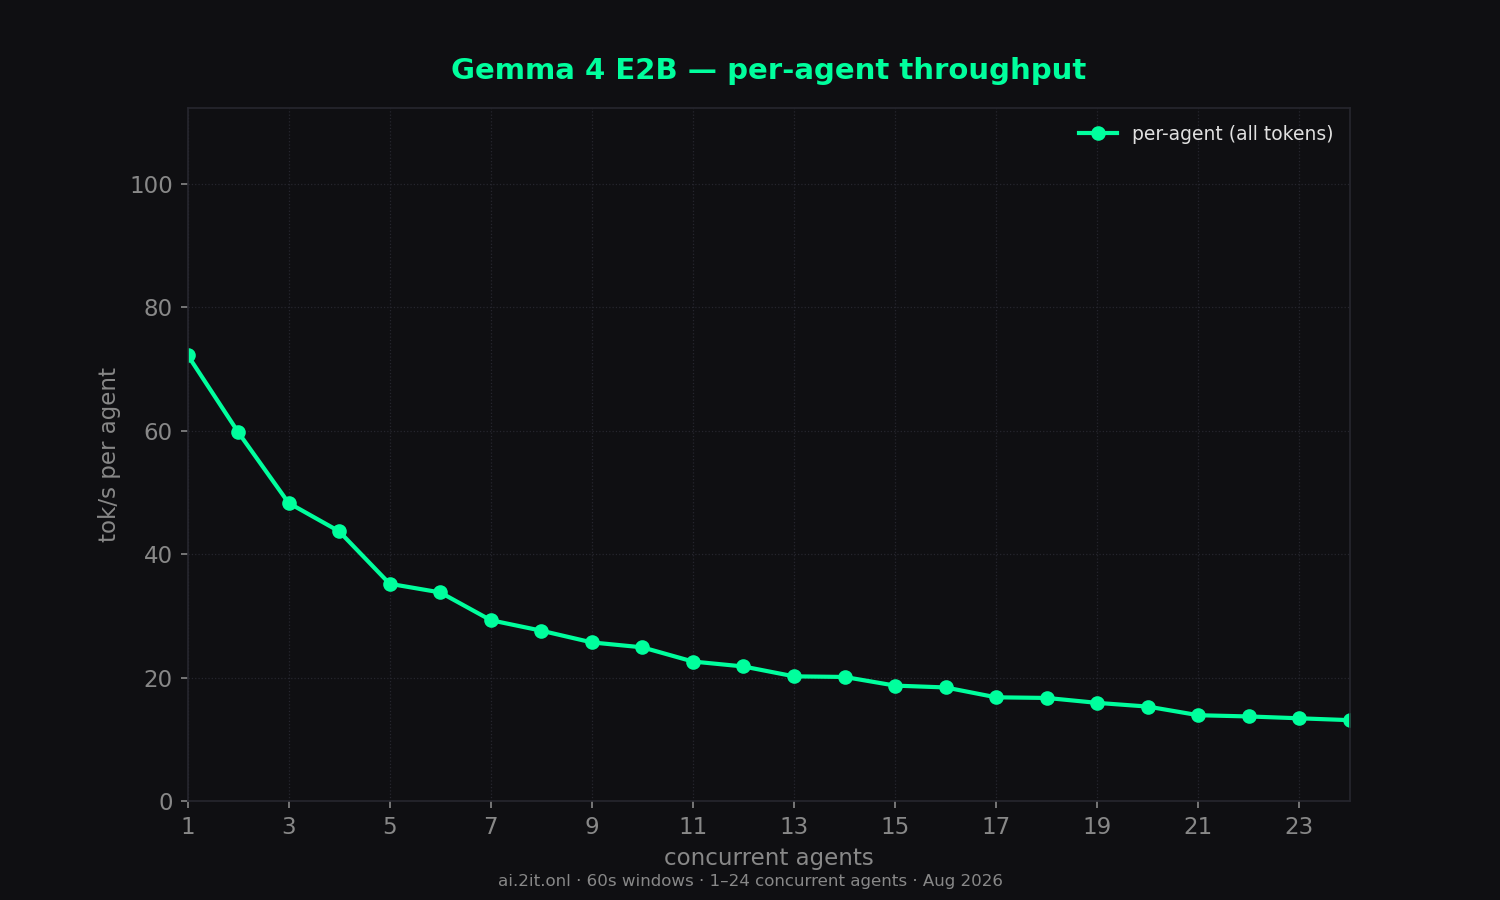
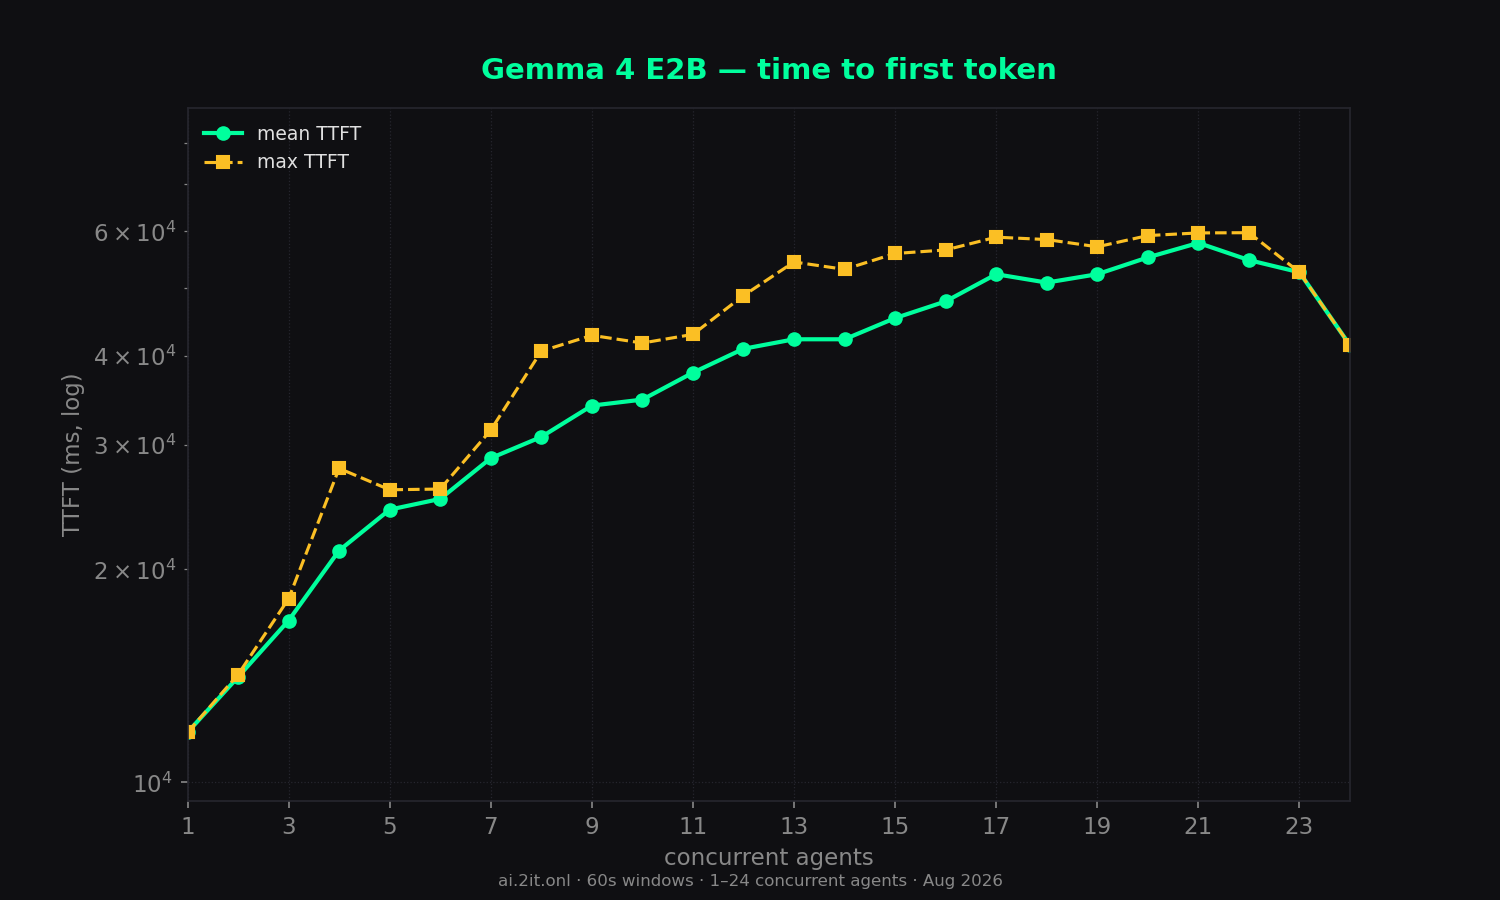
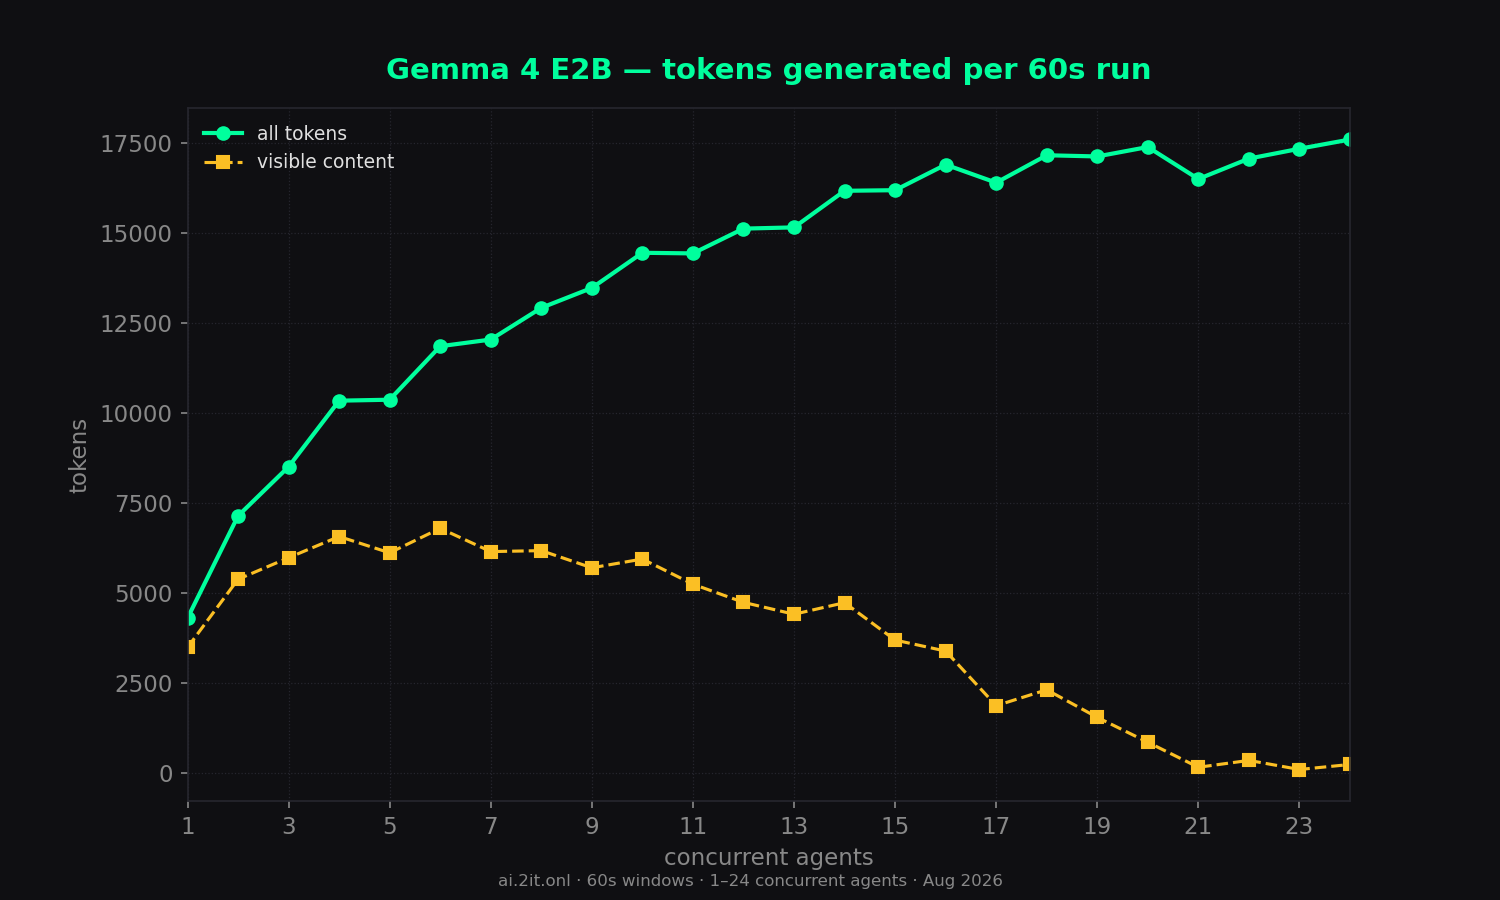
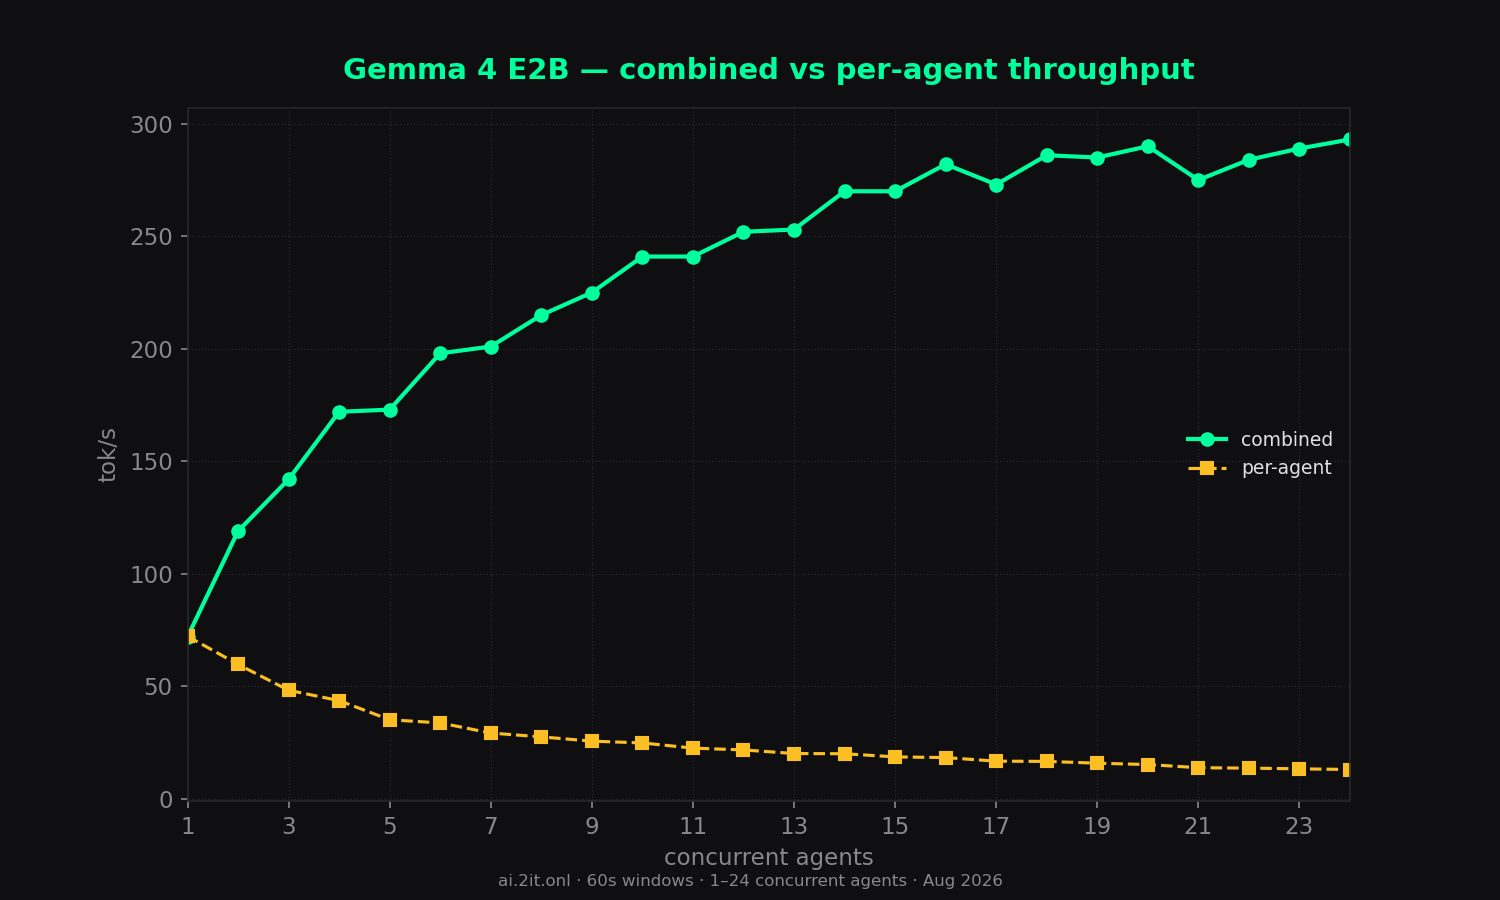
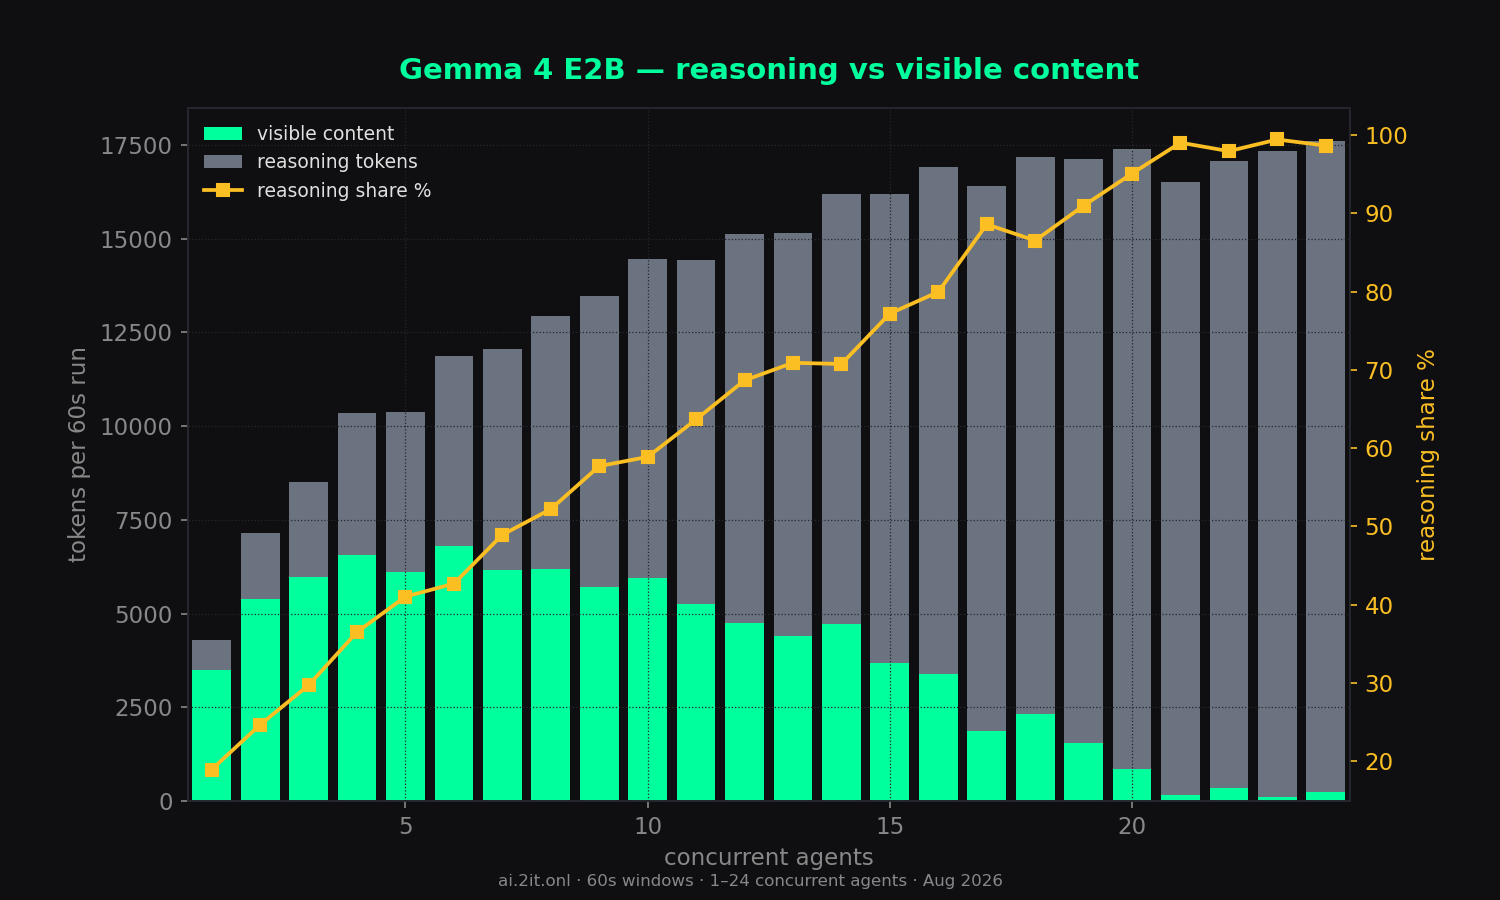
Near the bottom of the field — 72 tok/s solo, 293 tok/s peak, ~99% of output hidden reasoning under load, and the second-worst TTFT after Qwen3 4B (11.8s solo, up to 59.8s).
Key findings
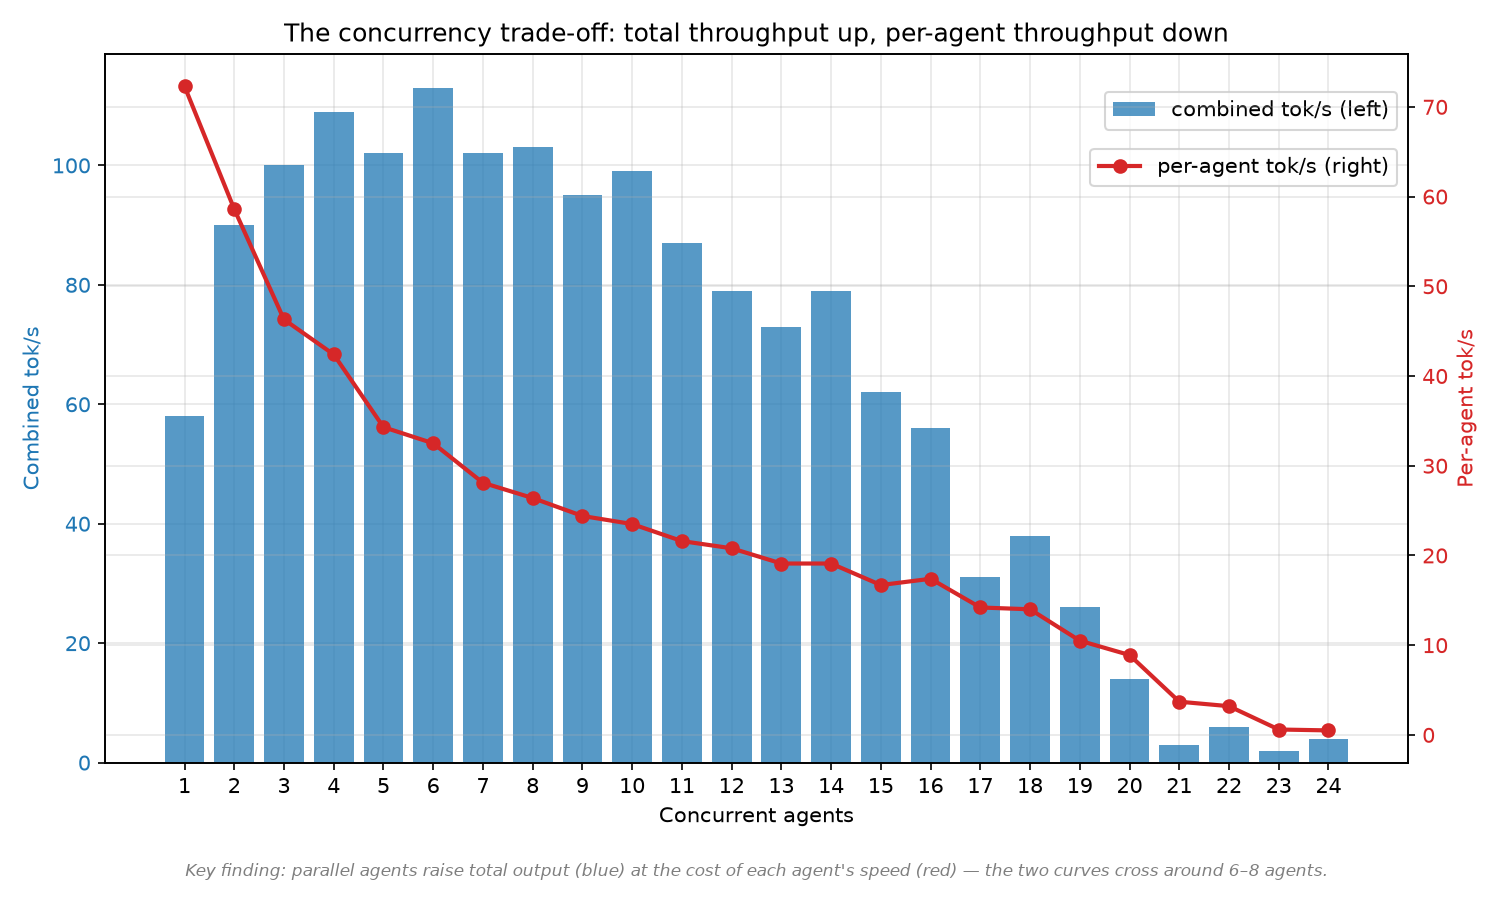
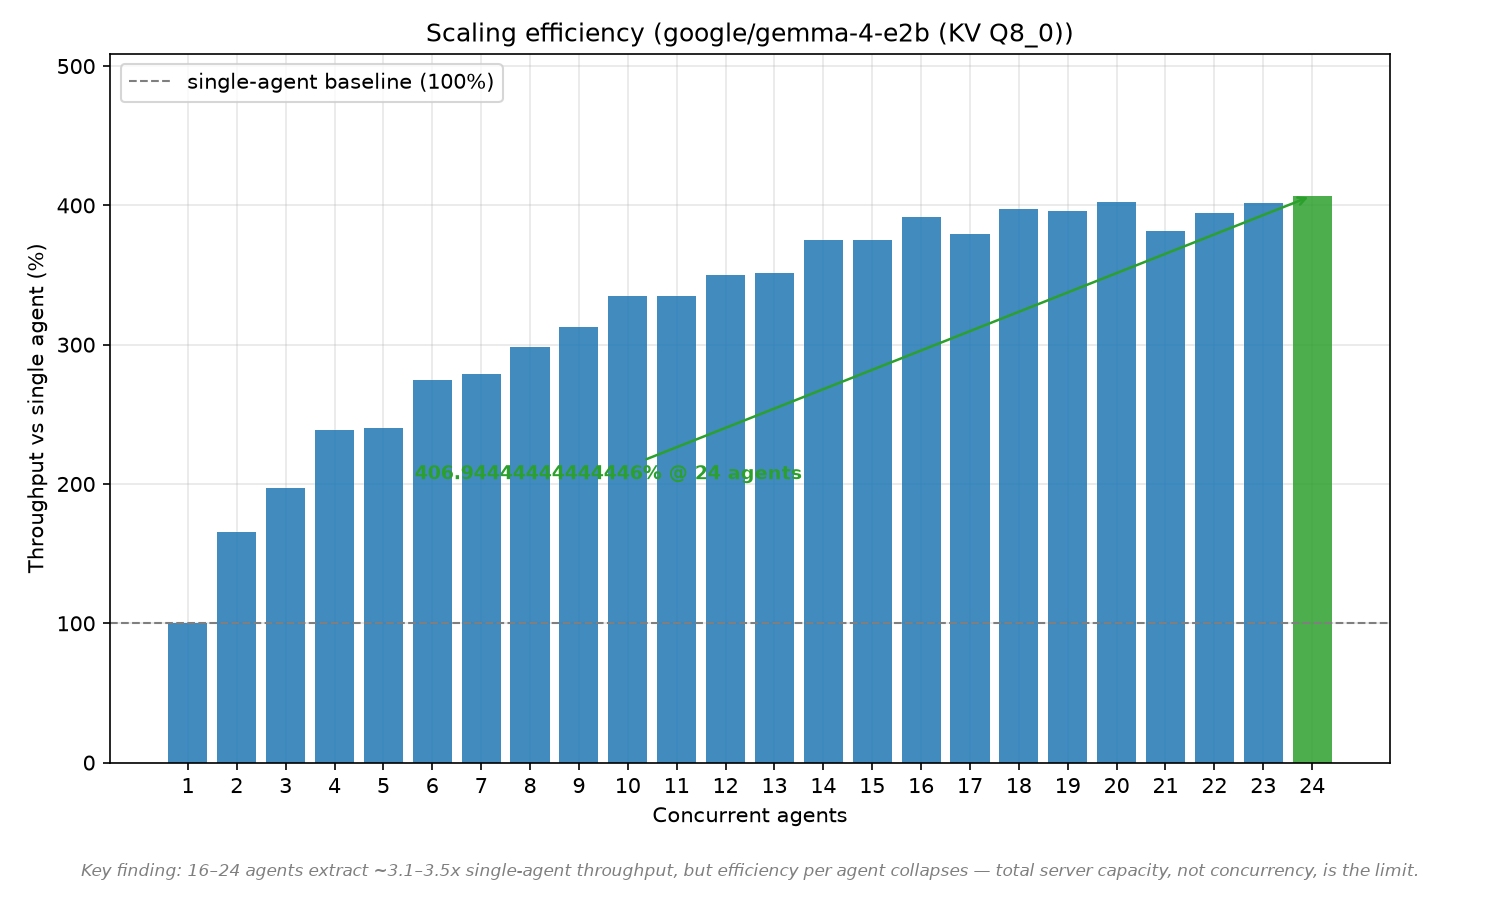
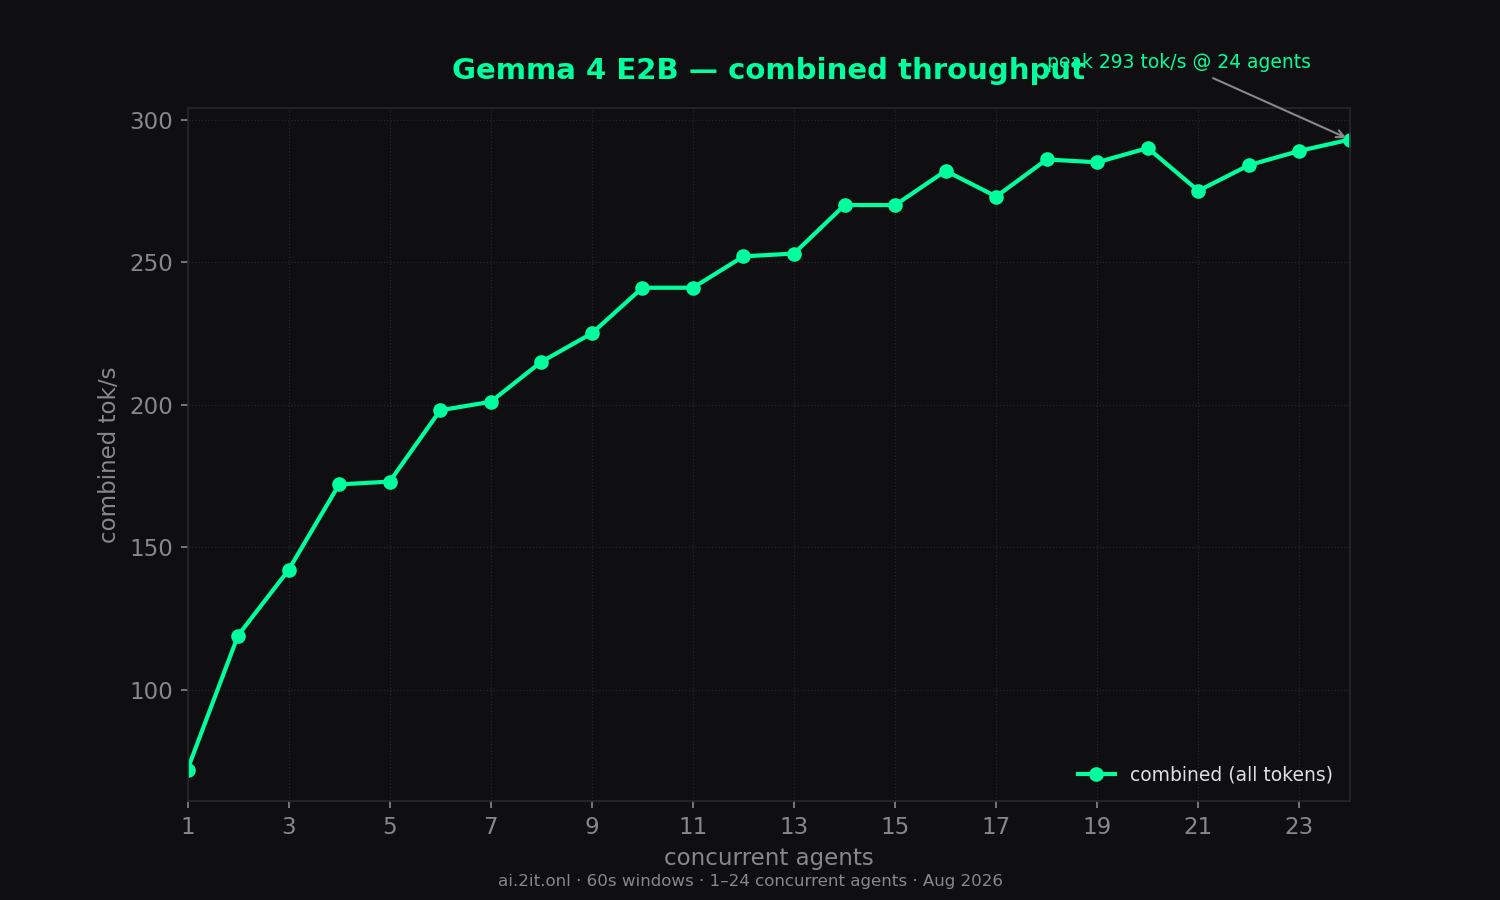
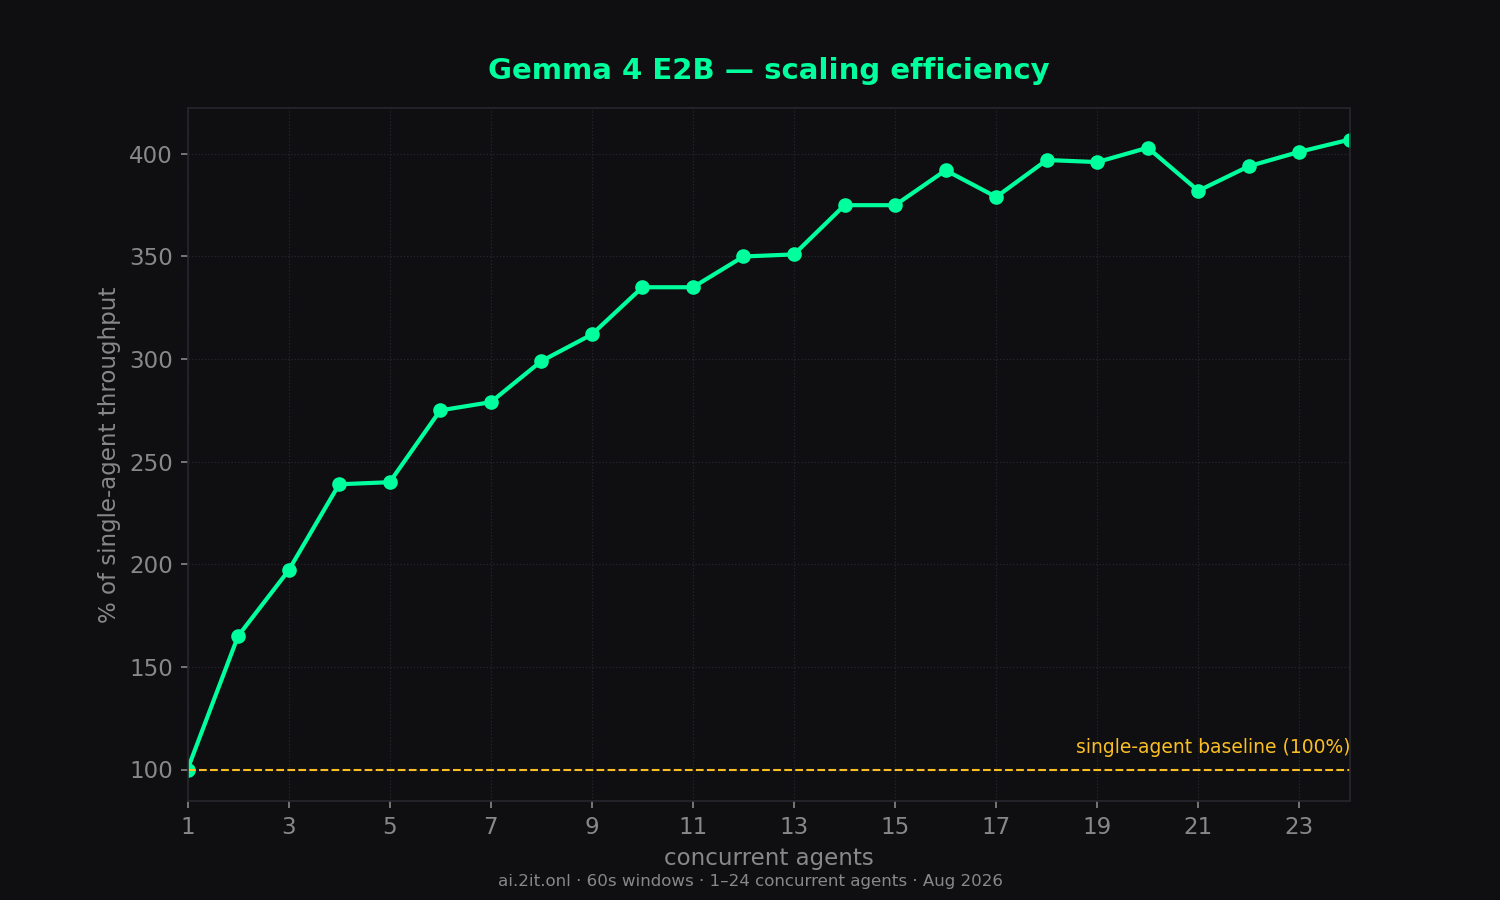
- One of the slowest profiles tested: only 72 tok/s solo (58 visible), and combined all-token throughput peaks at just 293 tok/s at 24 agents (4.1x) — near the bottom of the field alongside qwen3-4b.
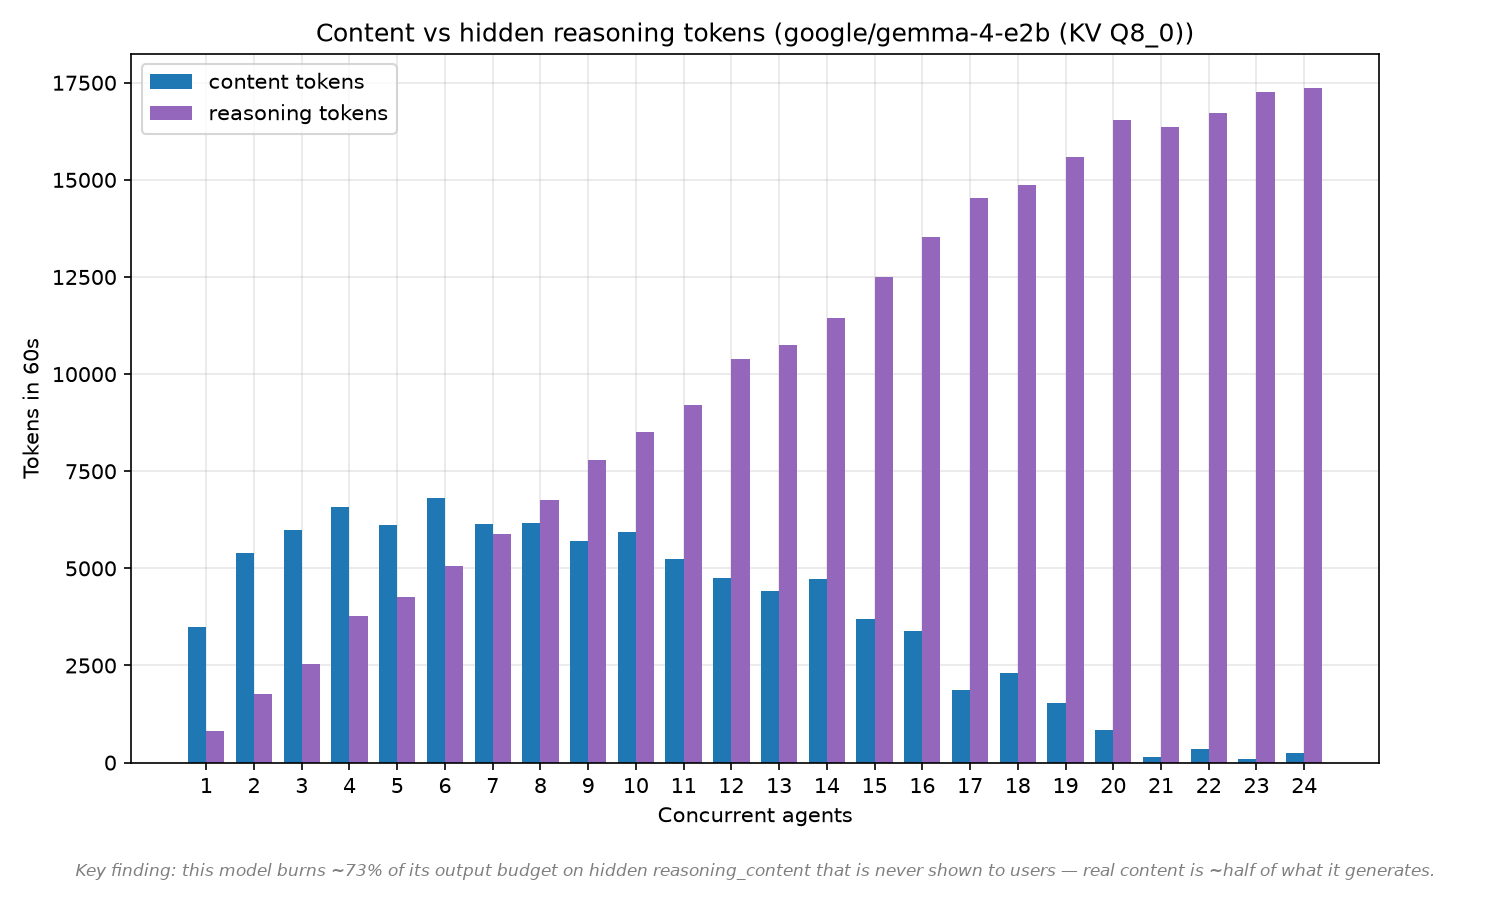
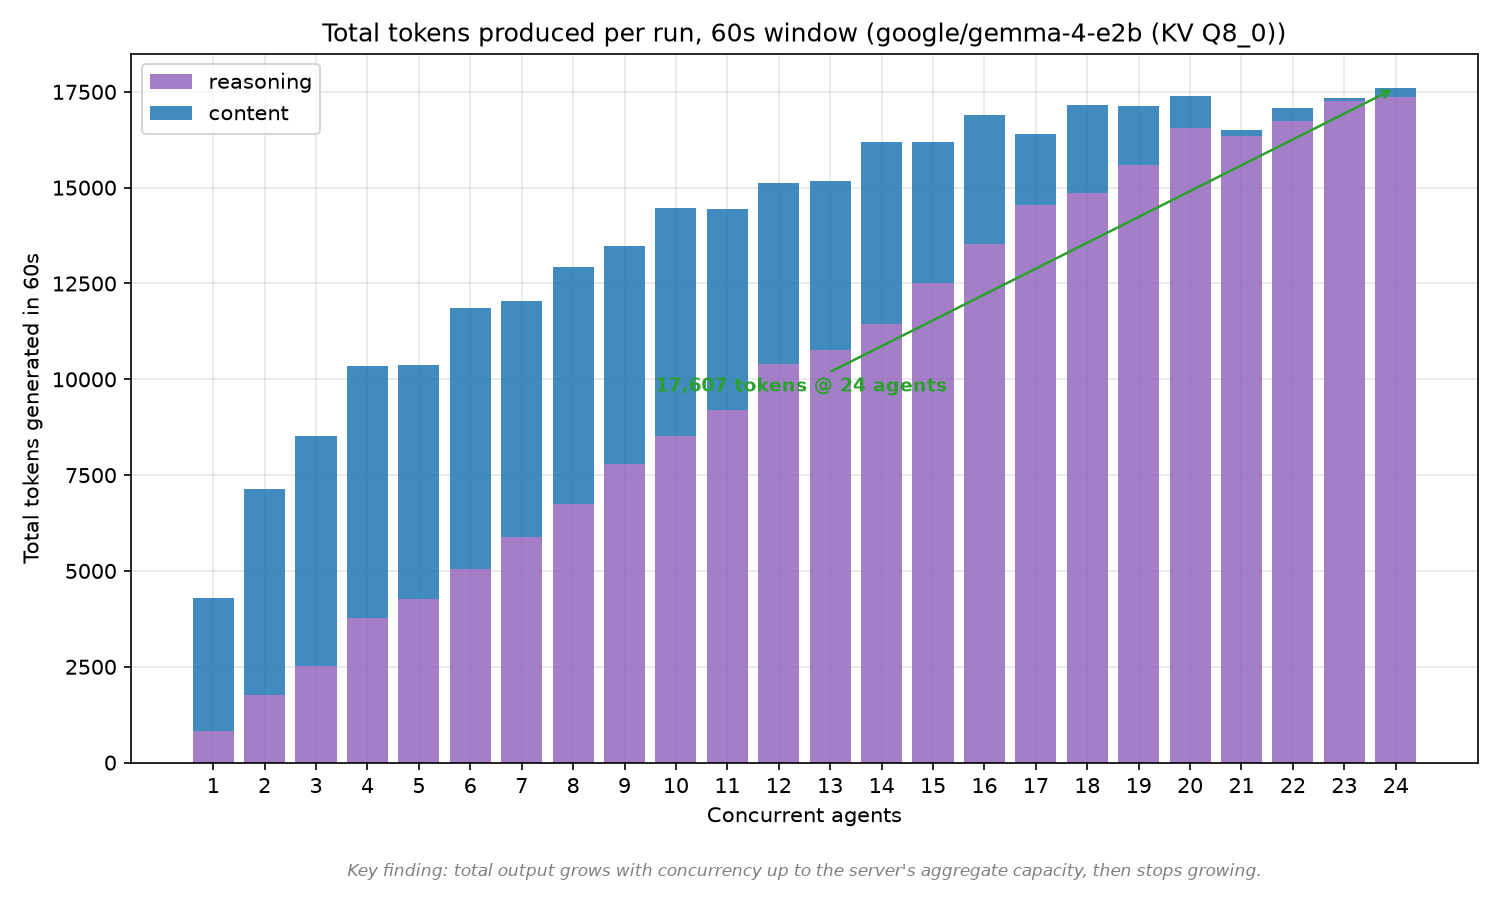
- Near-total reasoning collapse under load: visible content drops to 2–6 tok/s at 20–24 agents (~99% of output is hidden
reasoning_content). At 21–24 agents agents produce essentially zero usable content in the 60s window. - Extreme TTFT — the second-worst after qwen3-4b: 11.8s solo, rising steadily to 41–58s under load, with max values up to 59.8s. Agents routinely wait almost the whole run for their first token.
- Steady but slow scaling: all-token throughput climbs monotonically 72 → 293 without rolloff, but absolute numbers are low.
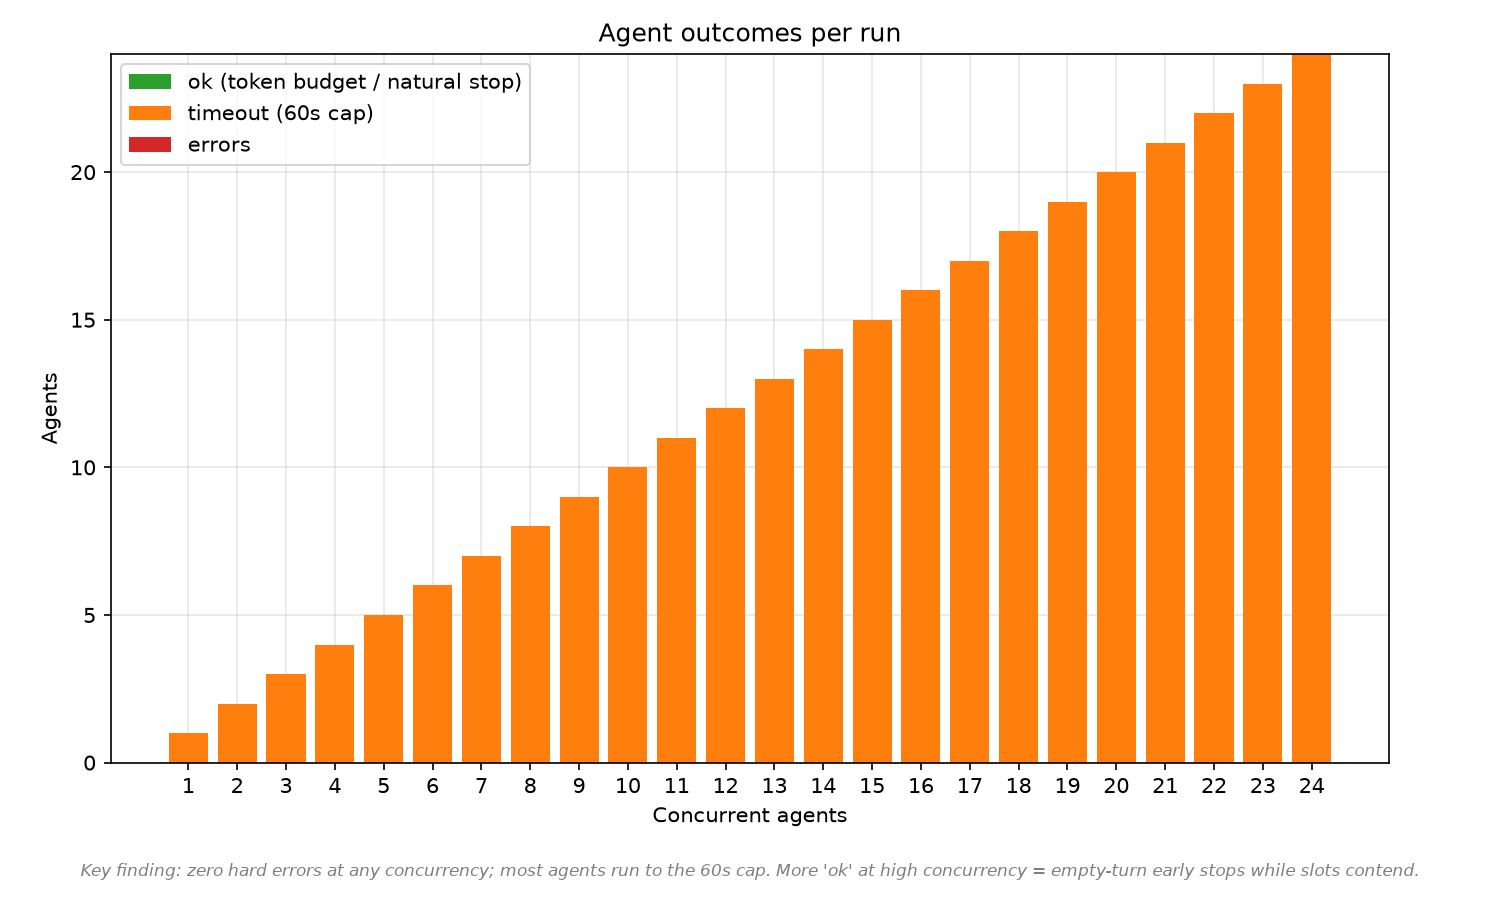
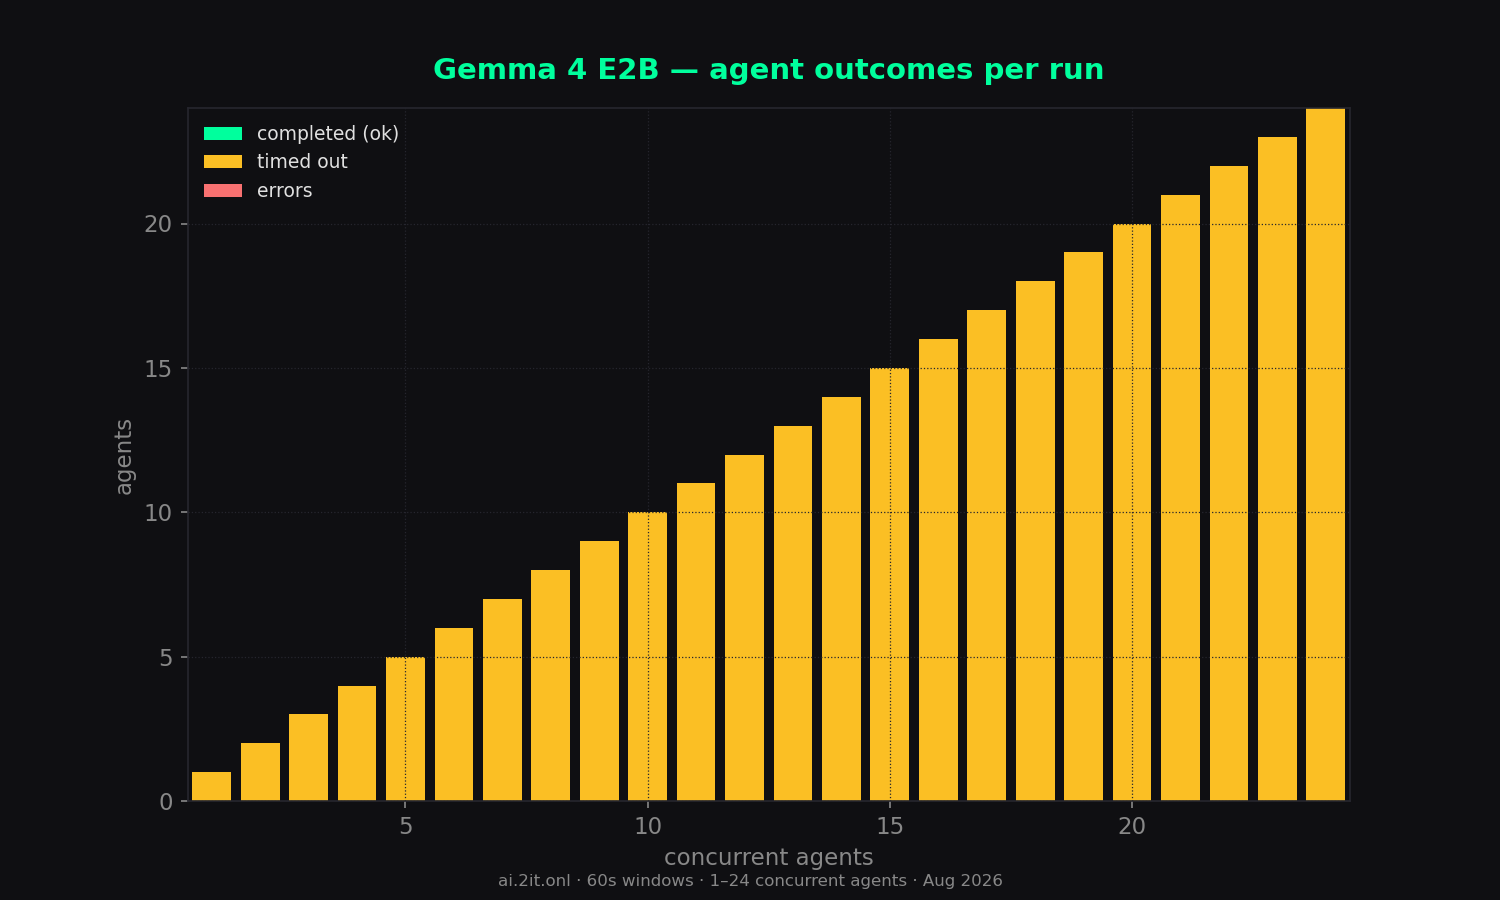
- Errors: 0 across all 24 runs.
Sweep — total concurrency 1–24
| agents | wall (s) | content | reason | total | comb tok/s | comb all | per-agent | per-agent all | scale % | TTFT mean | TTFT max | ok | timeout | err |
|---|---|---|---|---|---|---|---|---|---|---|---|---|---|---|
| 1 | 60.0 | 3,487 | 814 | 4,301 | 58 | 72 | 72.3 | 72.3 | 100% | 11.8s | 11.8s | 0 | 1 | 0 |
| 2 | 60.0 | 5,383 | 1,761 | 7,144 | 90 | 119 | 58.6 | 59.8 | 165% | 14.1s | 14.2s | 0 | 2 | 0 |
| 3 | 60.0 | 5,982 | 2,528 | 8,510 | 100 | 142 | 46.3 | 48.3 | 197% | 16.9s | 18.2s | 0 | 3 | 0 |
| 4 | 60.0 | 6,571 | 3,776 | 10,347 | 109 | 172 | 42.4 | 43.7 | 239% | 21.3s | 27.8s | 0 | 4 | 0 |
| 5 | 60.0 | 6,118 | 4,256 | 10,374 | 102 | 173 | 34.3 | 35.2 | 240% | 24.3s | 25.9s | 0 | 5 | 0 |
| 6 | 60.0 | 6,799 | 5,062 | 11,861 | 113 | 198 | 32.5 | 33.8 | 275% | 25.1s | 26.0s | 0 | 6 | 0 |
| 7 | 60.0 | 6,152 | 5,894 | 12,046 | 102 | 201 | 28.1 | 29.3 | 279% | 28.7s | 31.5s | 0 | 7 | 0 |
| 8 | 60.0 | 6,179 | 6,749 | 12,928 | 103 | 215 | 26.4 | 27.6 | 299% | 30.8s | 40.7s | 0 | 8 | 0 |
| 9 | 60.0 | 5,702 | 7,779 | 13,481 | 95 | 225 | 24.4 | 25.7 | 312% | 34.1s | 42.8s | 0 | 9 | 0 |
| 10 | 60.0 | 5,945 | 8,513 | 14,458 | 99 | 241 | 23.5 | 24.9 | 335% | 34.7s | 41.7s | 0 | 10 | 0 |
| 11 | 60.0 | 5,246 | 9,195 | 14,441 | 87 | 241 | 21.6 | 22.6 | 335% | 37.9s | 42.9s | 0 | 11 | 0 |
| 12 | 60.0 | 4,741 | 10,389 | 15,130 | 79 | 252 | 20.8 | 21.8 | 350% | 41.0s | 48.7s | 0 | 12 | 0 |
| 13 | 60.0 | 4,411 | 10,753 | 15,164 | 73 | 253 | 19.1 | 20.2 | 351% | 42.3s | 54.3s | 0 | 13 | 0 |
| 14 | 60.0 | 4,732 | 11,449 | 16,181 | 79 | 270 | 19.1 | 20.1 | 375% | 42.3s | 53.0s | 0 | 14 | 0 |
| 15 | 60.0 | 3,693 | 12,505 | 16,198 | 62 | 270 | 16.7 | 18.7 | 375% | 45.3s | 55.9s | 0 | 15 | 0 |
| 16 | 60.0 | 3,387 | 13,521 | 16,908 | 56 | 282 | 17.4 | 18.4 | 392% | 47.8s | 56.5s | 0 | 16 | 0 |
| 17 | 60.0 | 1,869 | 14,538 | 16,407 | 31 | 273 | 14.2 | 16.8 | 379% | 52.2s | 58.9s | 0 | 17 | 0 |
| 18 | 60.0 | 2,311 | 14,858 | 17,169 | 38 | 286 | 14.0 | 16.7 | 397% | 50.8s | 58.4s | 0 | 18 | 0 |
| 19 | 60.0 | 1,544 | 15,592 | 17,136 | 26 | 285 | 10.5 | 15.9 | 396% | 52.2s | 57.1s | 0 | 19 | 0 |
| 20 | 60.0 | 852 | 16,546 | 17,398 | 14 | 290 | 8.9 | 15.3 | 403% | 55.1s | 59.2s | 0 | 20 | 0 |
| 21 | 60.0 | 157 | 16,352 | 16,509 | 3 | 275 | 3.7 | 13.9 | 382% | 57.8s | 59.7s | 0 | 21 | 0 |
| 22 | 60.0 | 348 | 16,728 | 17,076 | 6 | 284 | 3.2 | 13.7 | 394% | 54.7s | 59.8s | 0 | 22 | 0 |
| 23 | 60.0 | 95 | 17,255 | 17,350 | 2 | 289 | 0.6 | 13.4 | 401% | 52.5s | 52.5s | 0 | 23 | 0 |
| 24 peak | 60.0 | 235 | 17,372 | 17,607 | 4 | 293 | 0.5 | 13.1 | 407% | 41.4s | 41.4s | 0 | 24 | 0 |
* burst artifact — agents queued ~11–16s then generated in a short burst; the per-agent timer inflates the number. Trust combined throughput and TTFT columns. Peak row = highest combined (all-token) throughput.
Charts
Raw data & downloads
- report.md5 KB
- sweep-summary.csv2 KB
- sweep-summary.json11 KB
- combined_throughput.png126 KB · original matplotlib export
- combined_vs_per_agent.png101 KB · original matplotlib export
- dashboard_1_24.png178 KB · original matplotlib export
- outcome_breakdown.png57 KB · original matplotlib export
- per_agent_throughput.png115 KB · original matplotlib export
- reasoning_vs_content.png66 KB · original matplotlib export
- scaling_efficiency.png81 KB · original matplotlib export
- time_to_first_token.png71 KB · original matplotlib export
- total_tokens_generated.png81 KB · original matplotlib export