Qwen2.5 0.5B
server model id:
qwen2.5-0.5b-instructnon-thinkingKV F16ctx 32k0.5B params
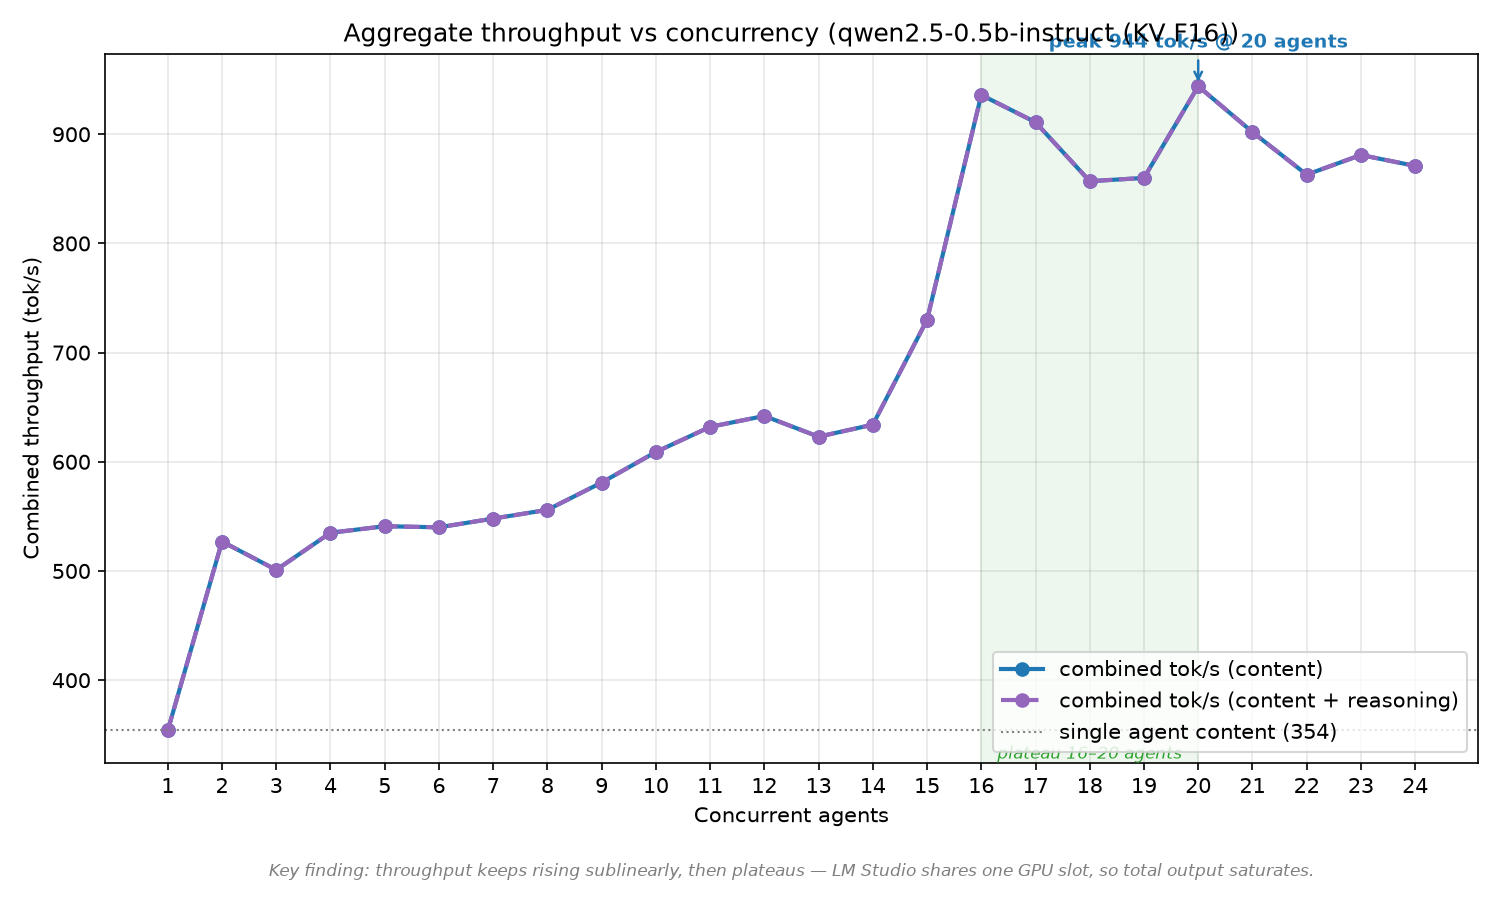
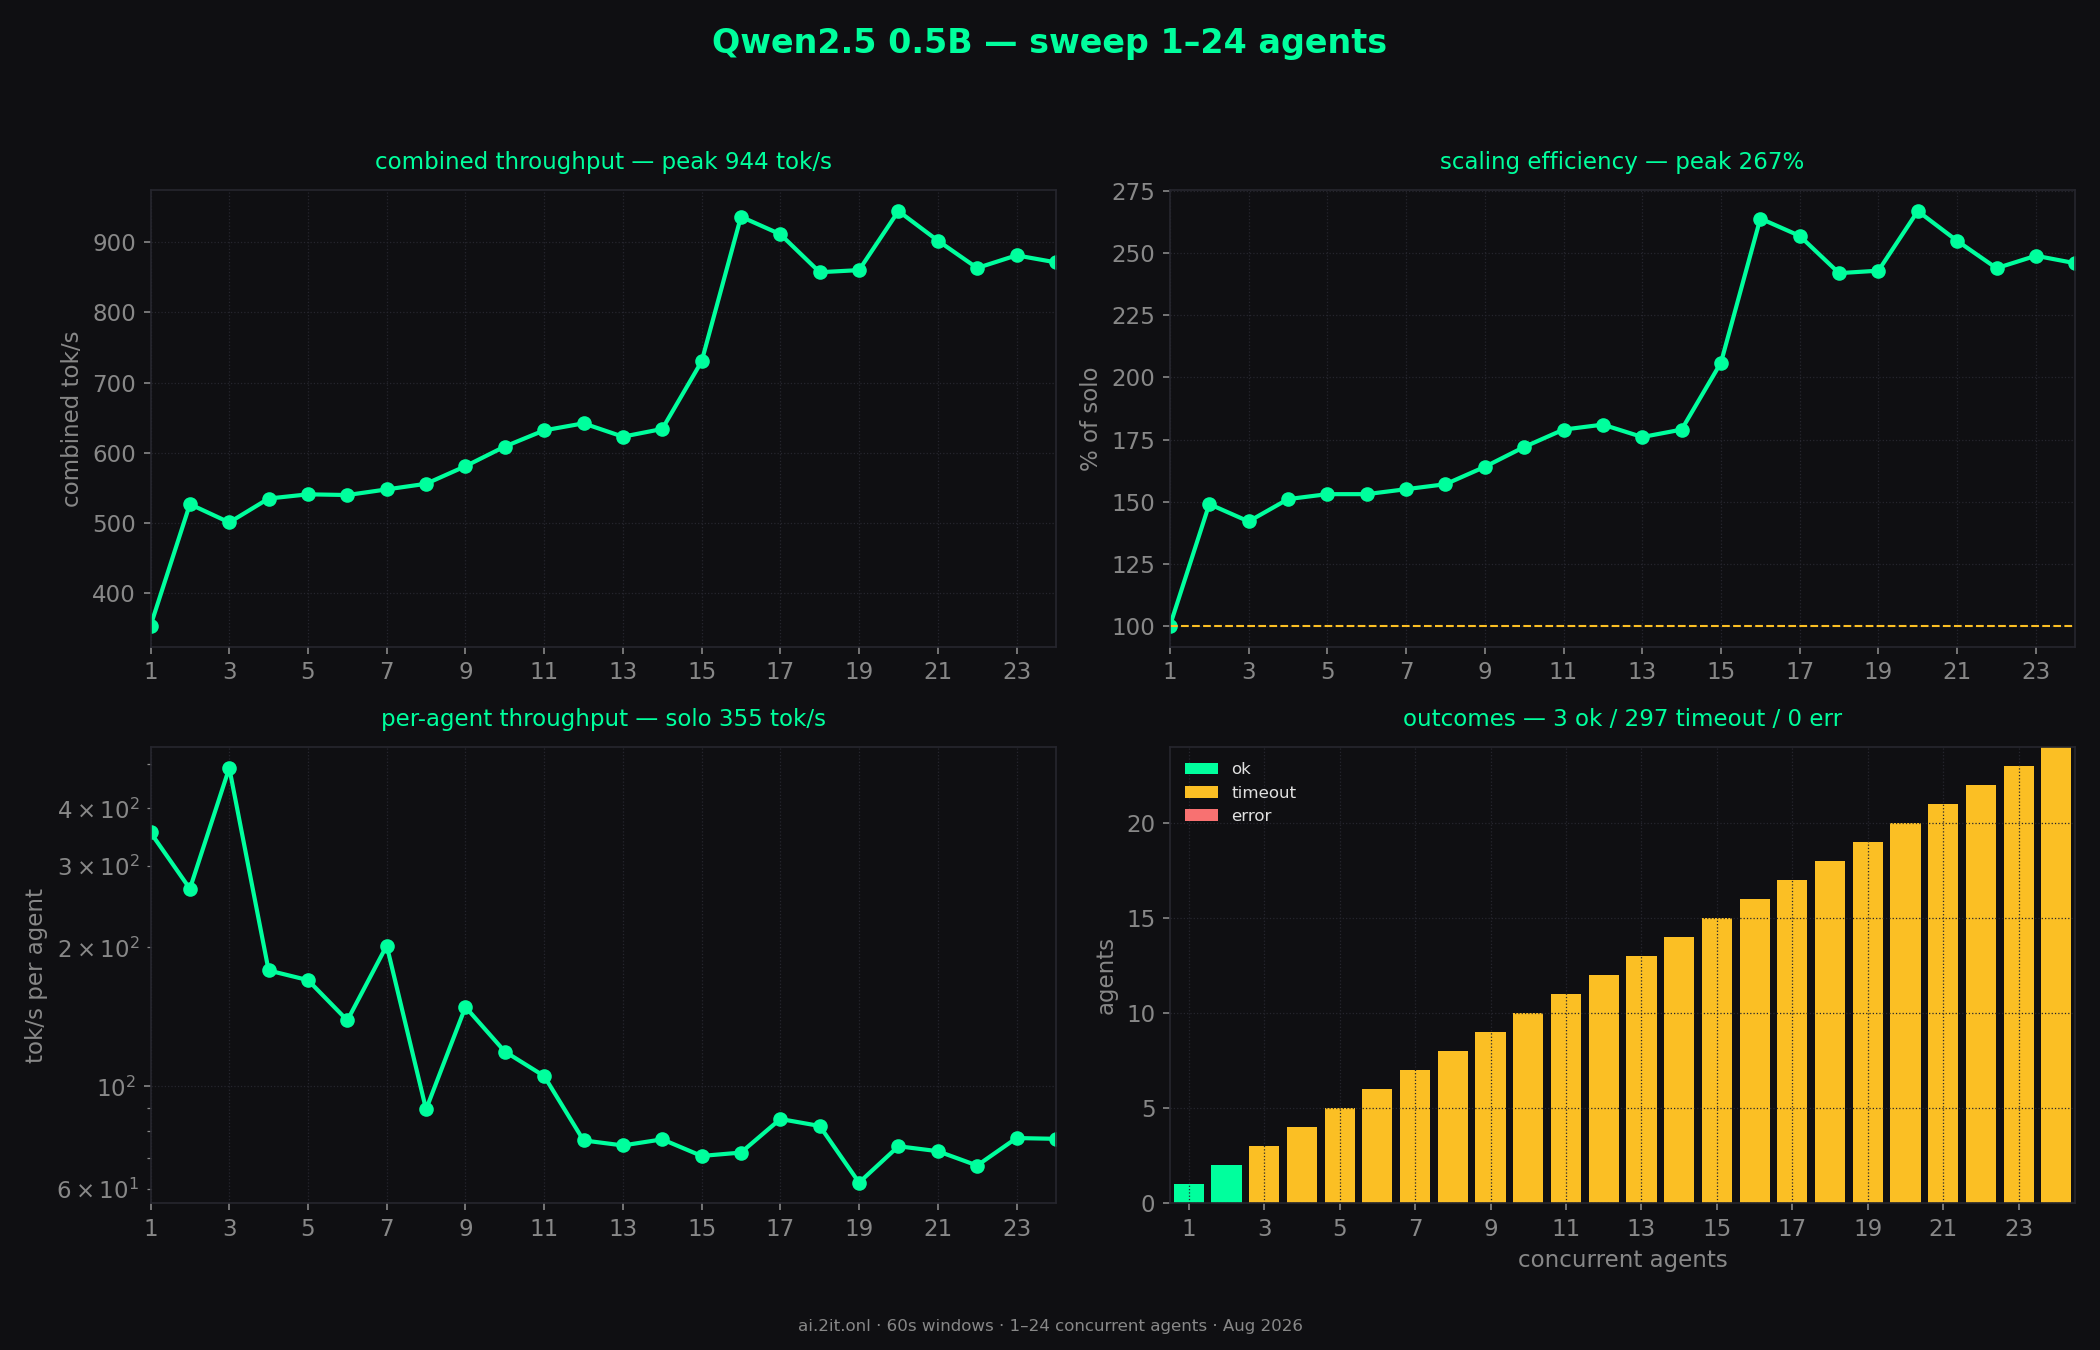
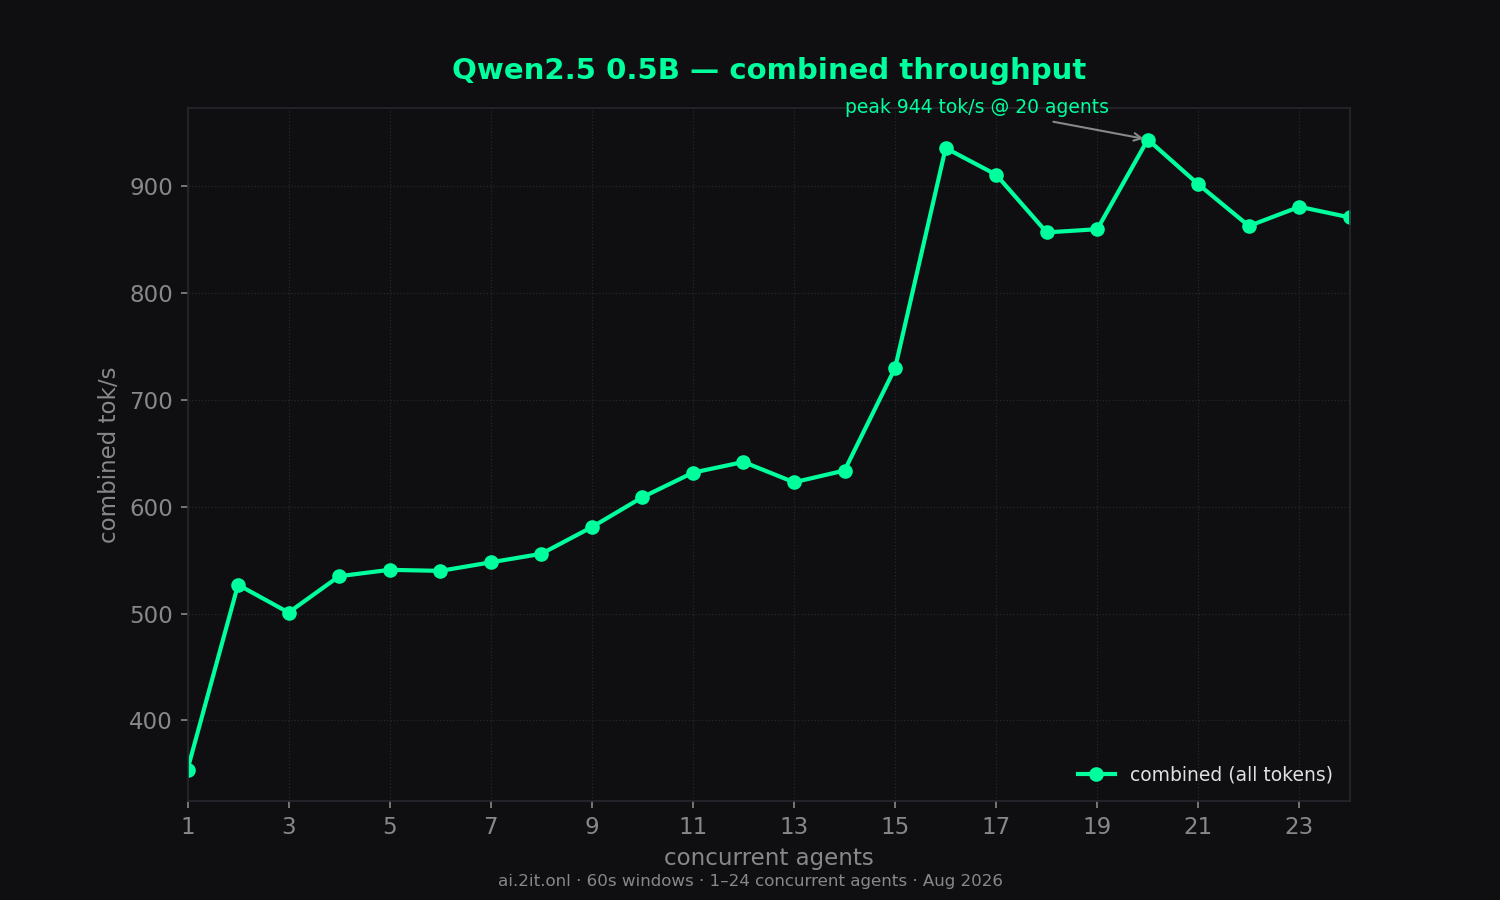
The throughput monster — fastest solo of all (354 tok/s) and fastest visible-content rate on record (944 tok/s at 20 agents) on full-precision F16 KV.
Key findings
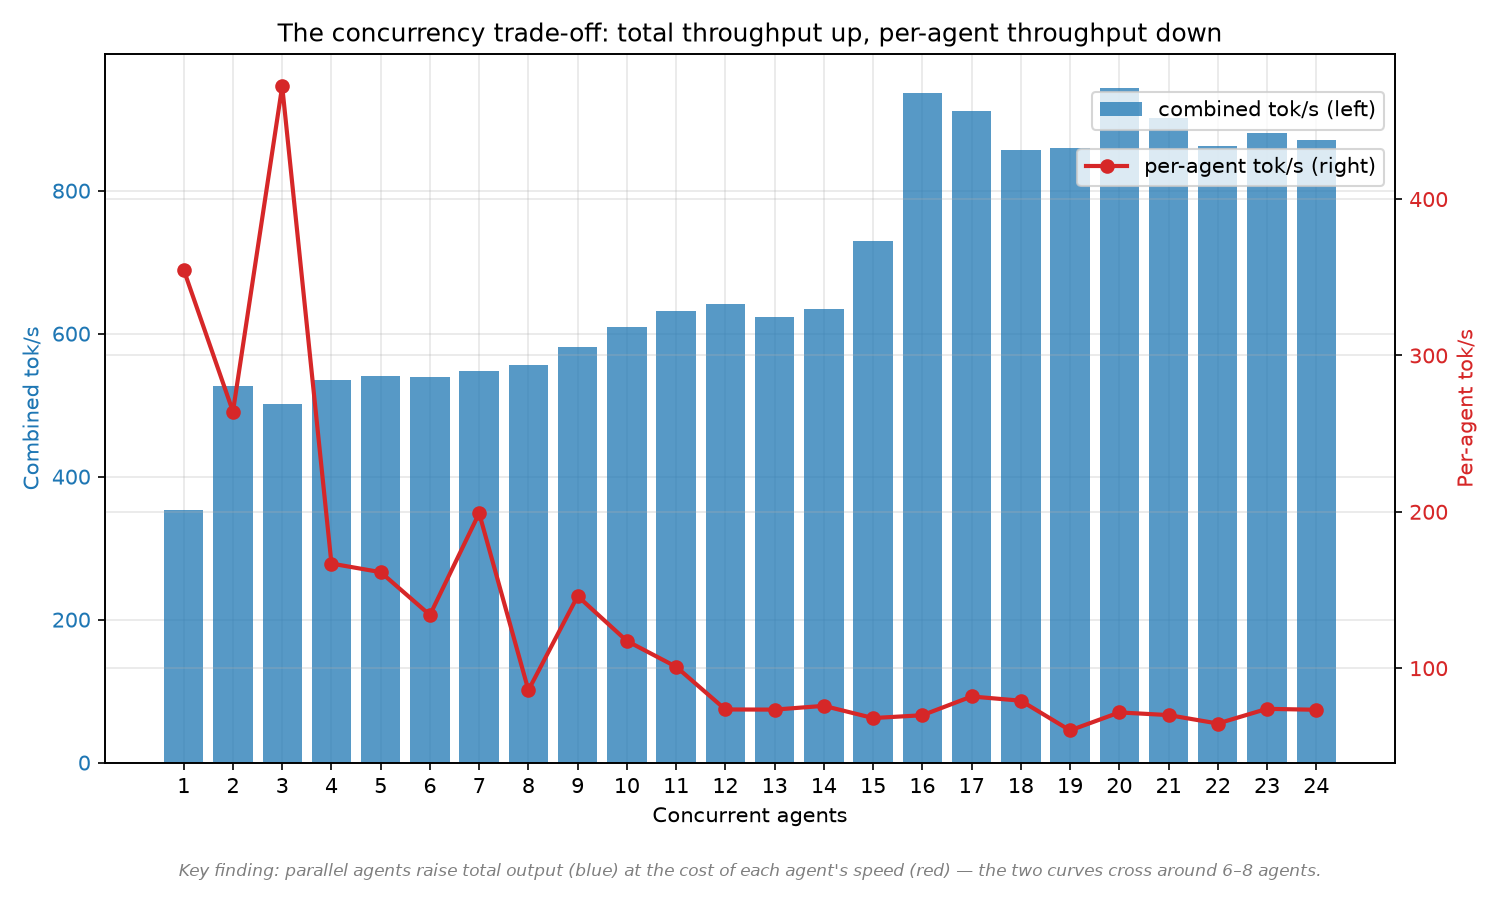
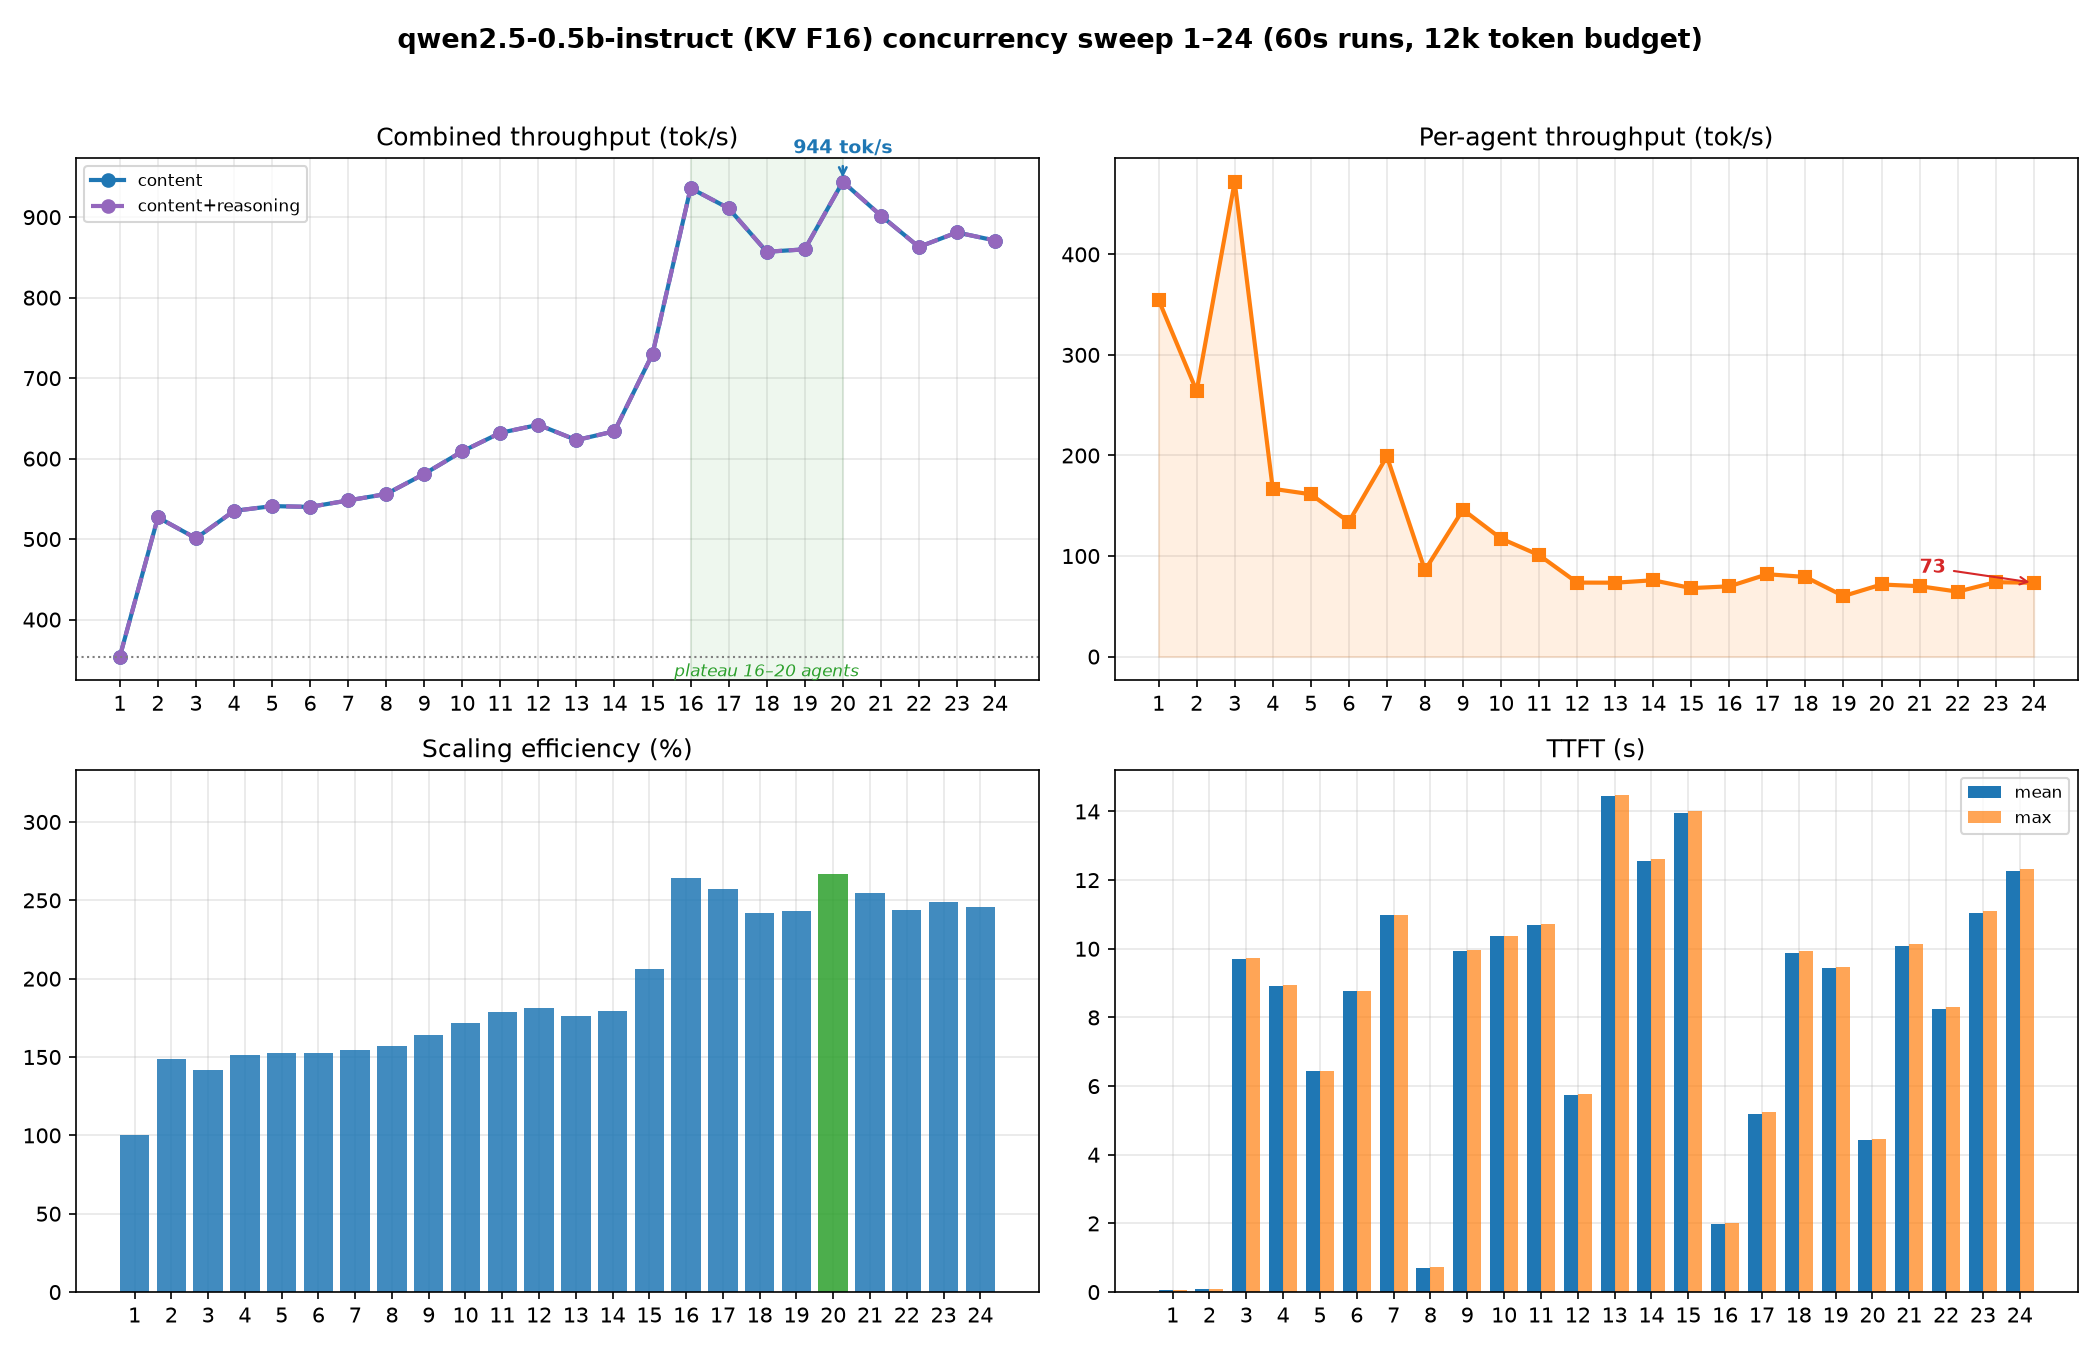
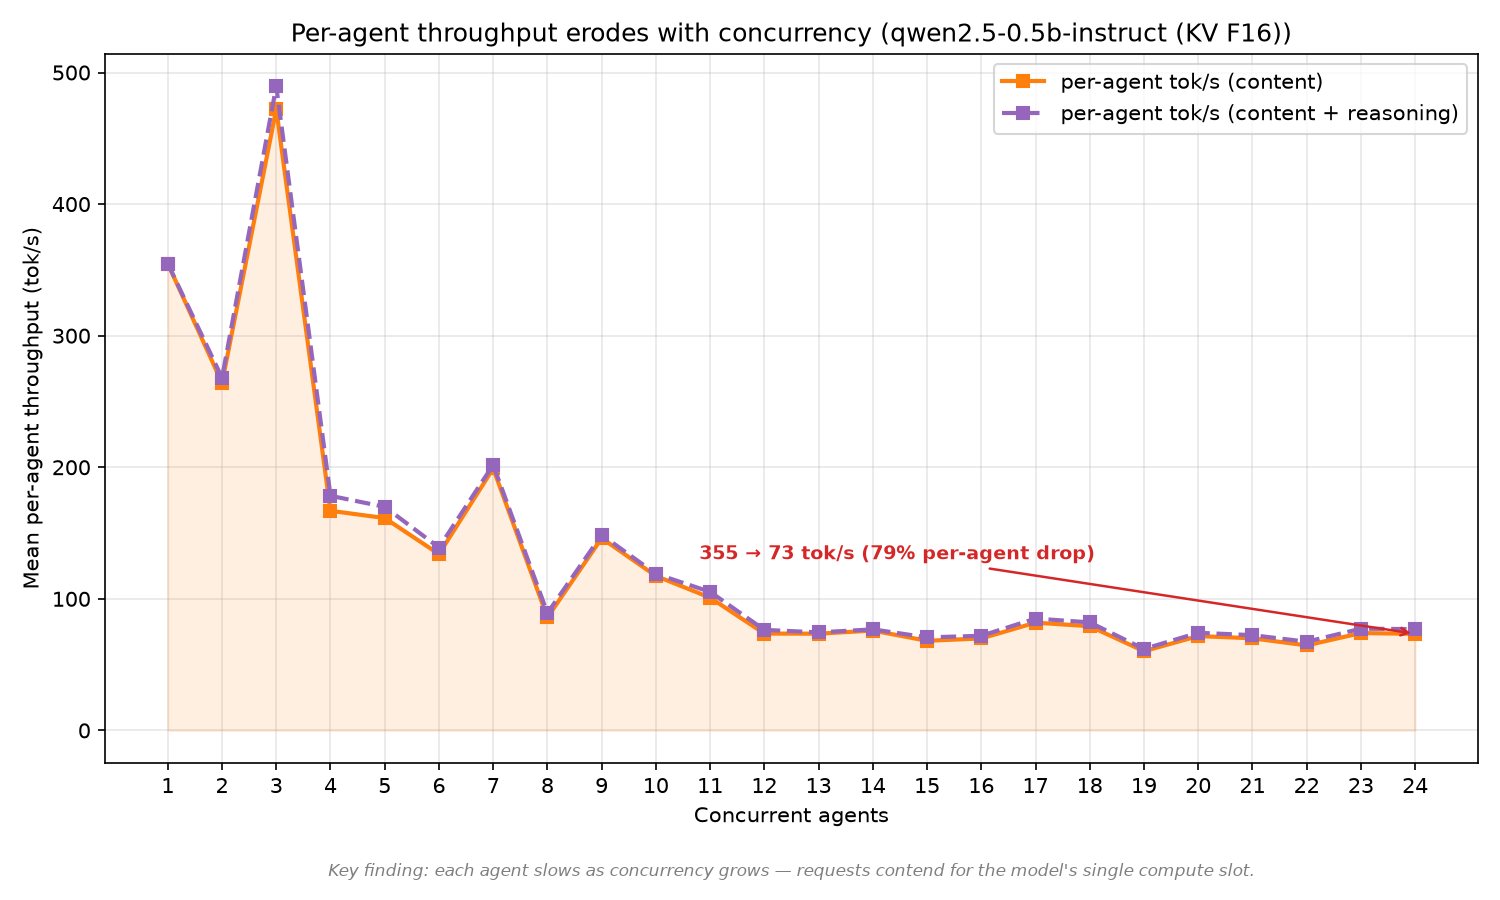
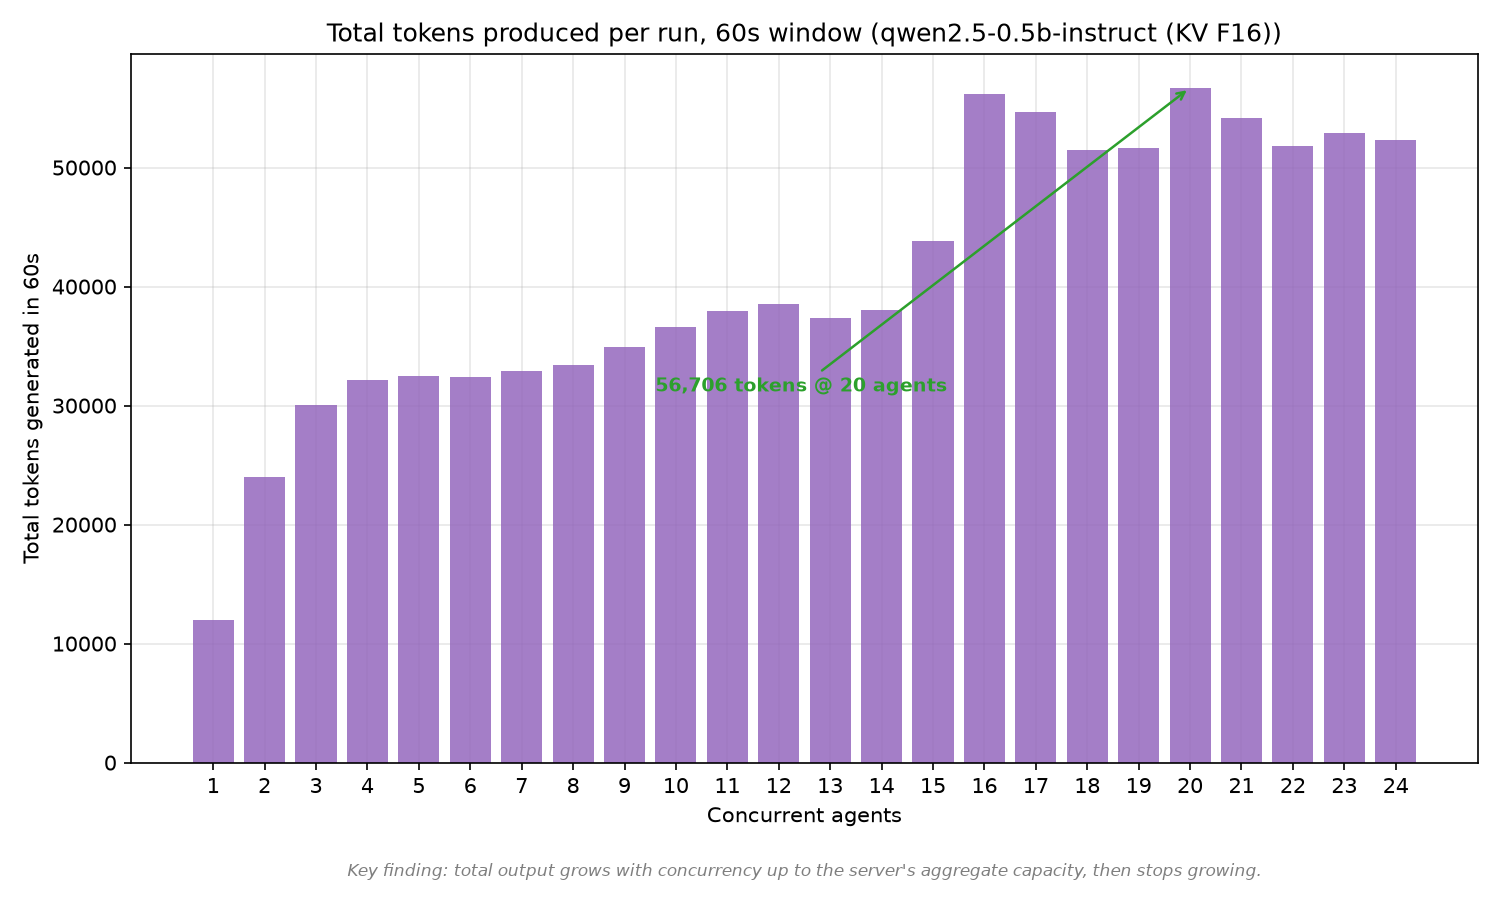
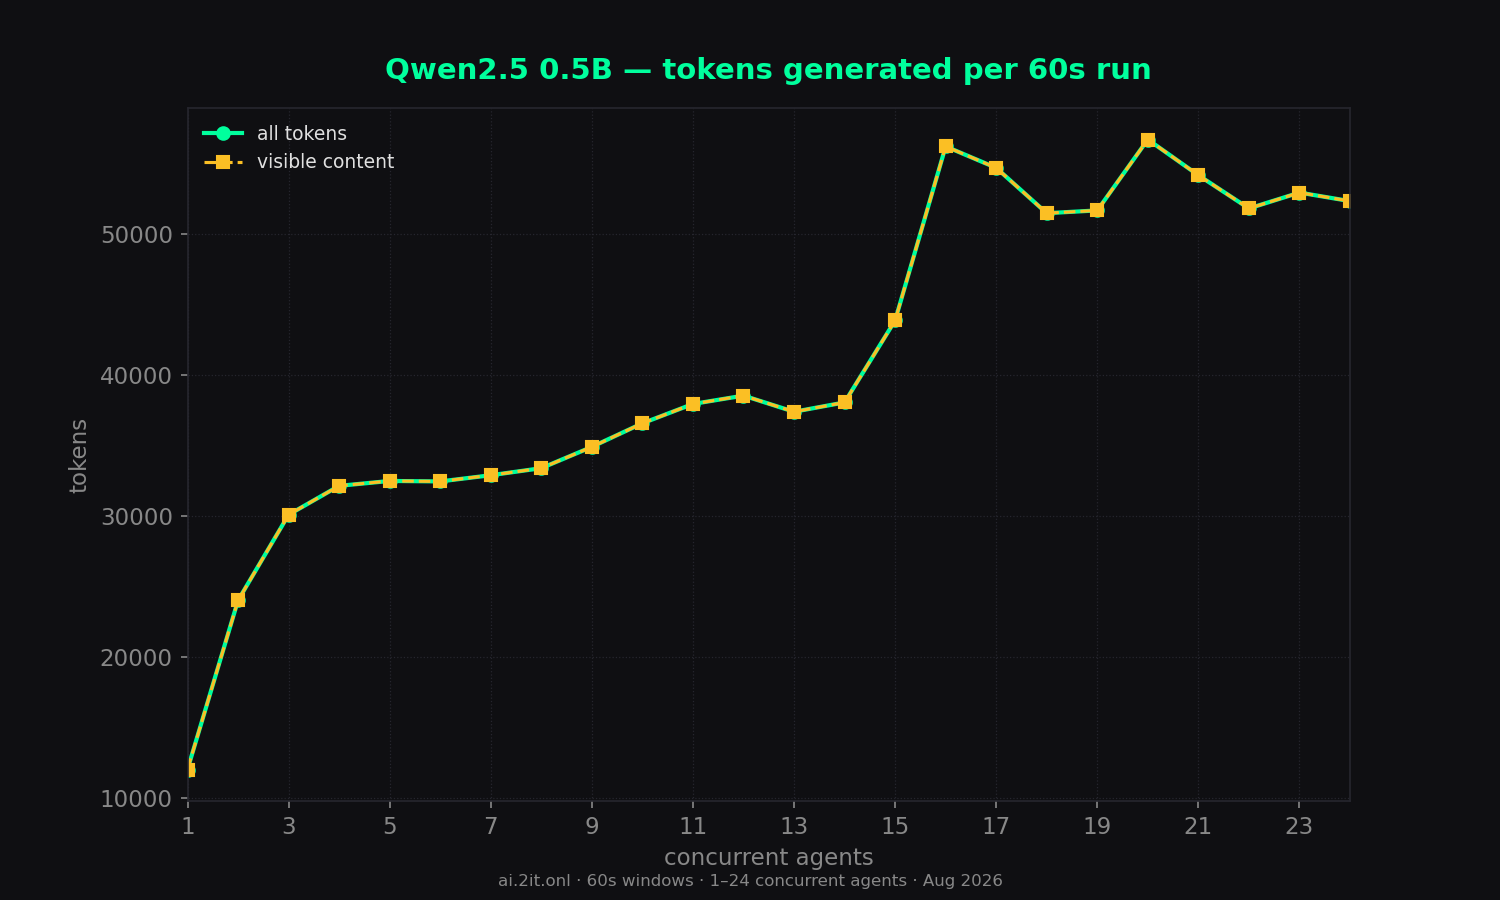
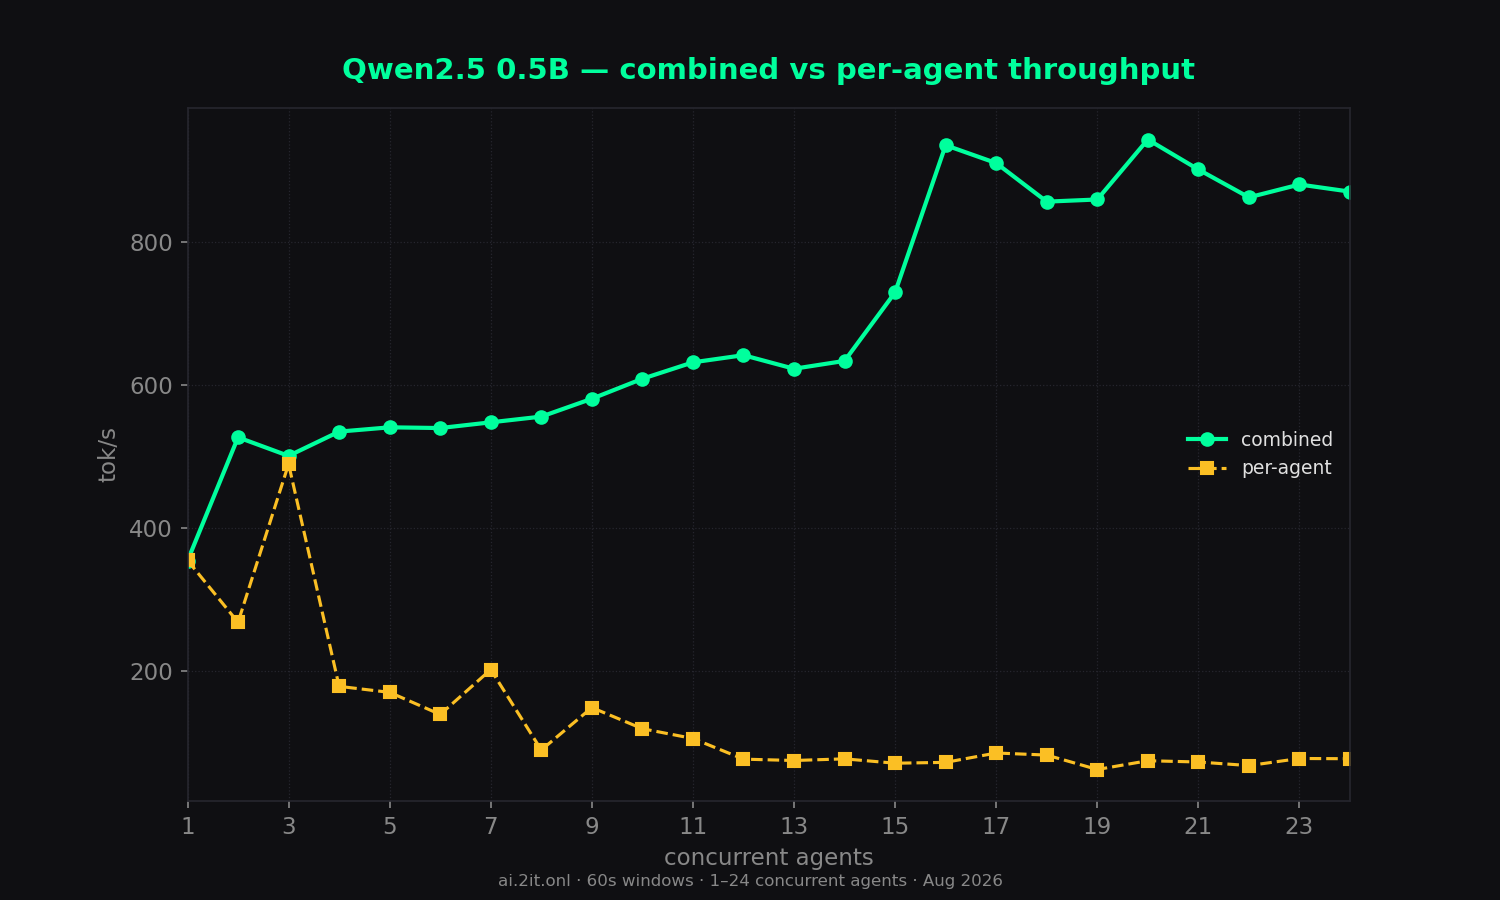
- Fastest absolute throughput of any model tested: 944 tok/s at 20 agents (and 936 at 16, 871 at 24) — well ahead of the previous best (falcon3 839, qwen-deepseek 829, minicpm 983* measured all-token). The tiny 0.5b model plus F16 KV makes it a throughput monster: single-agent is 354 tok/s (also the fastest solo of the whole set).
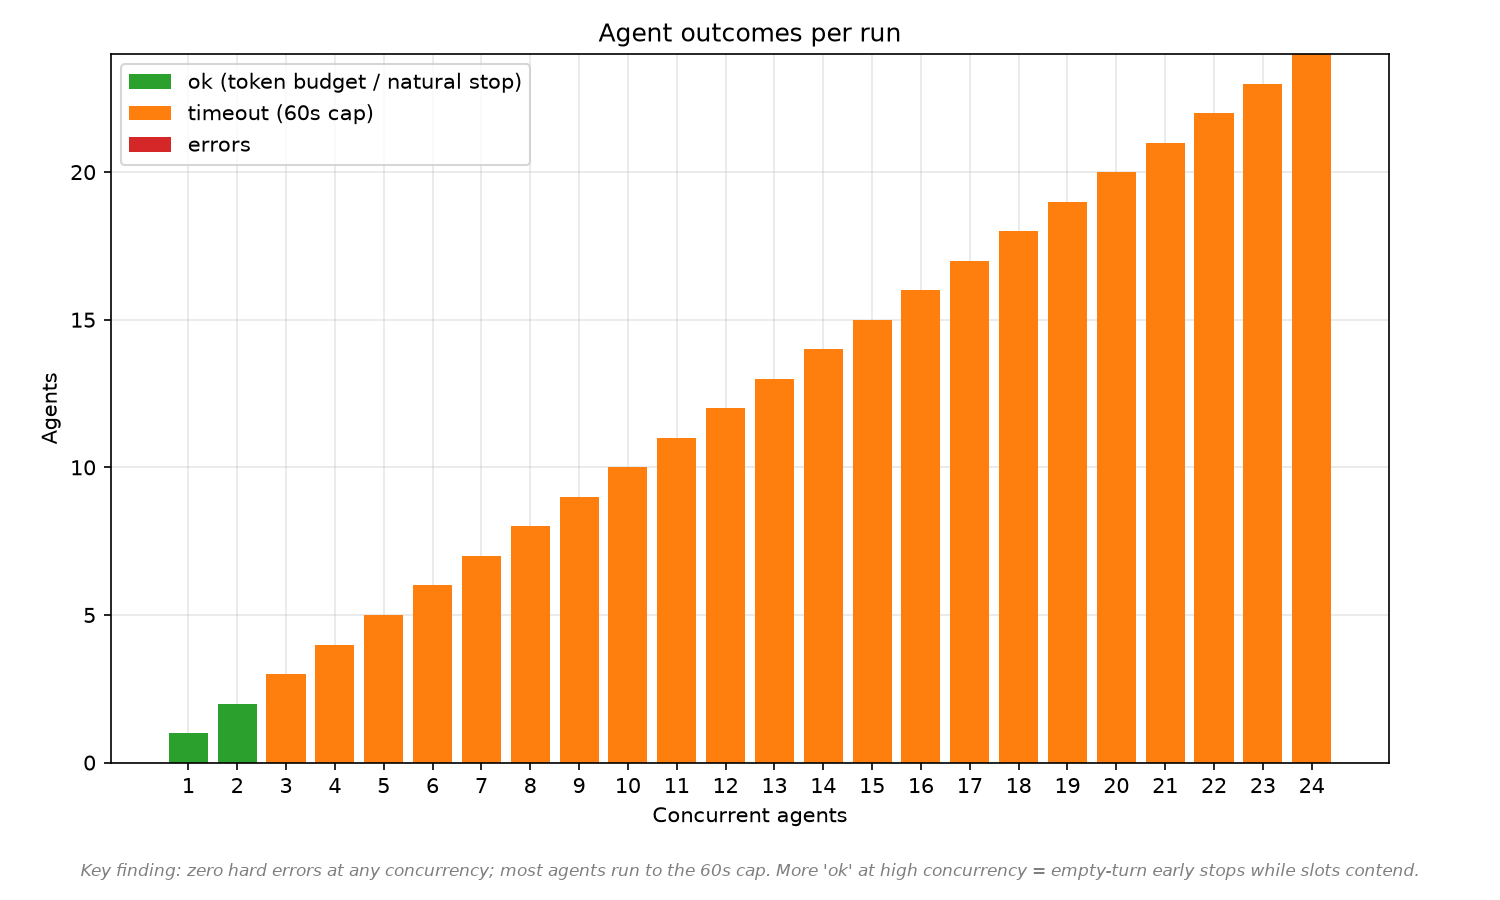
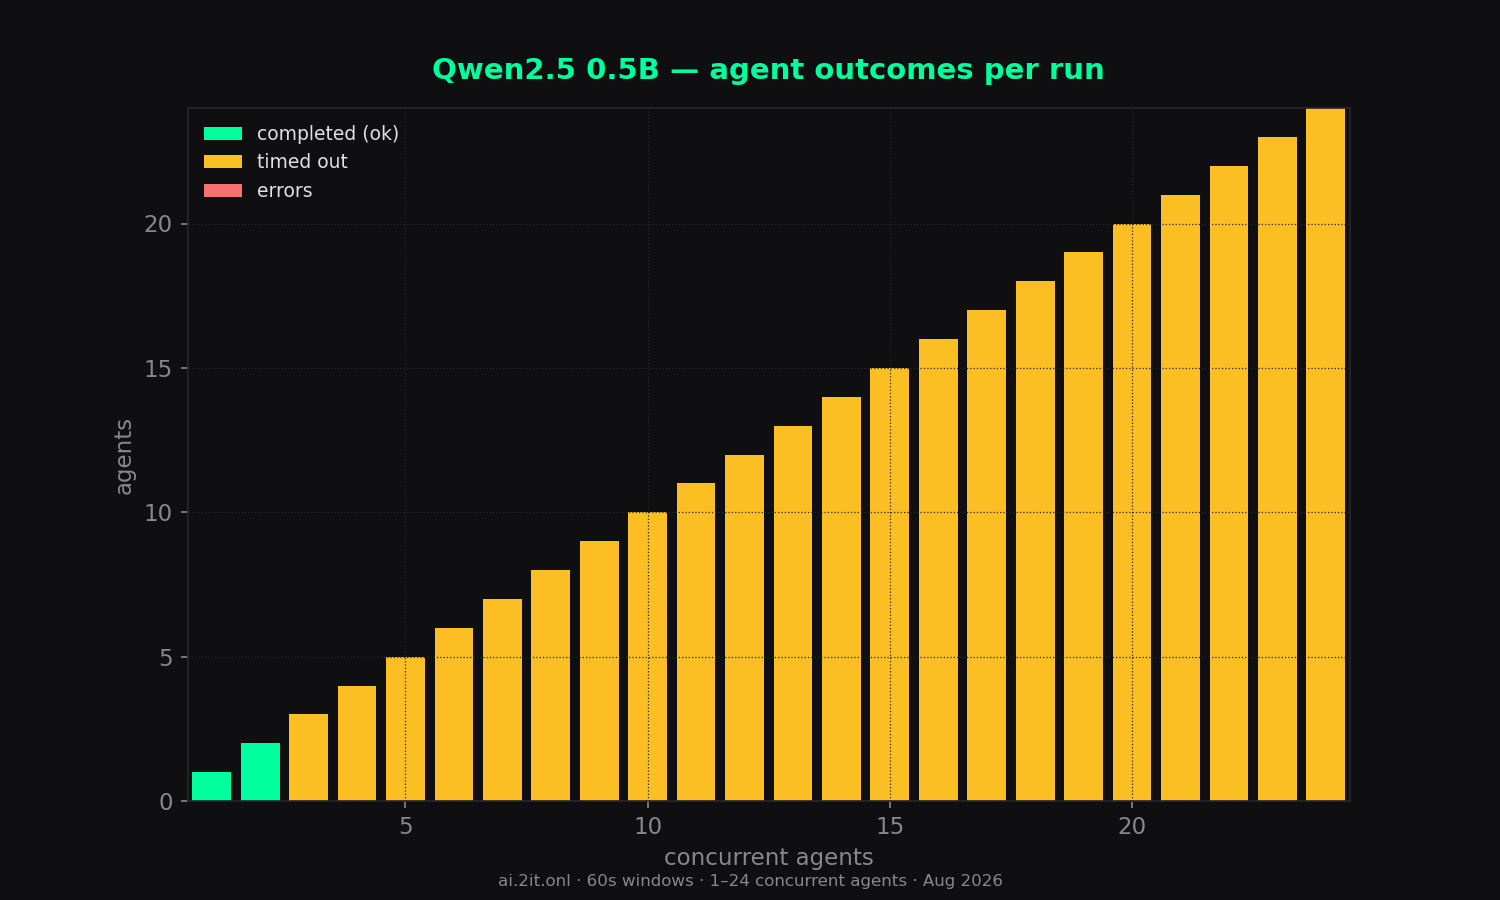
- Solo run finished early on budget: concurrency 1 hit the 12k budget in 33.9s, concurrency 2 in 45.6s — the only runs that didn't use the full 60s, because the model out-runs the budget.
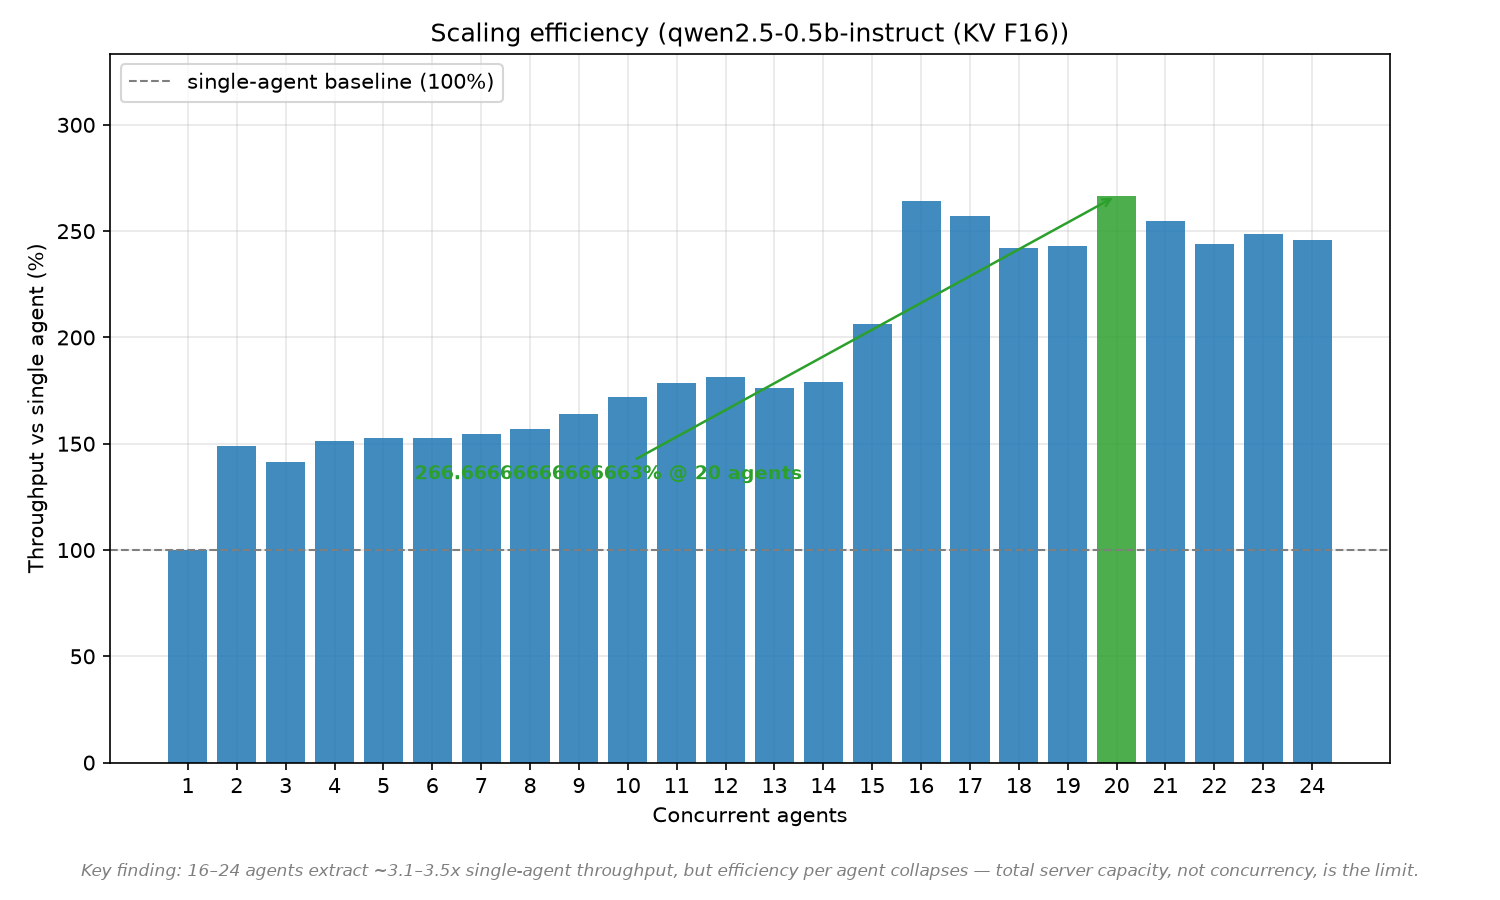
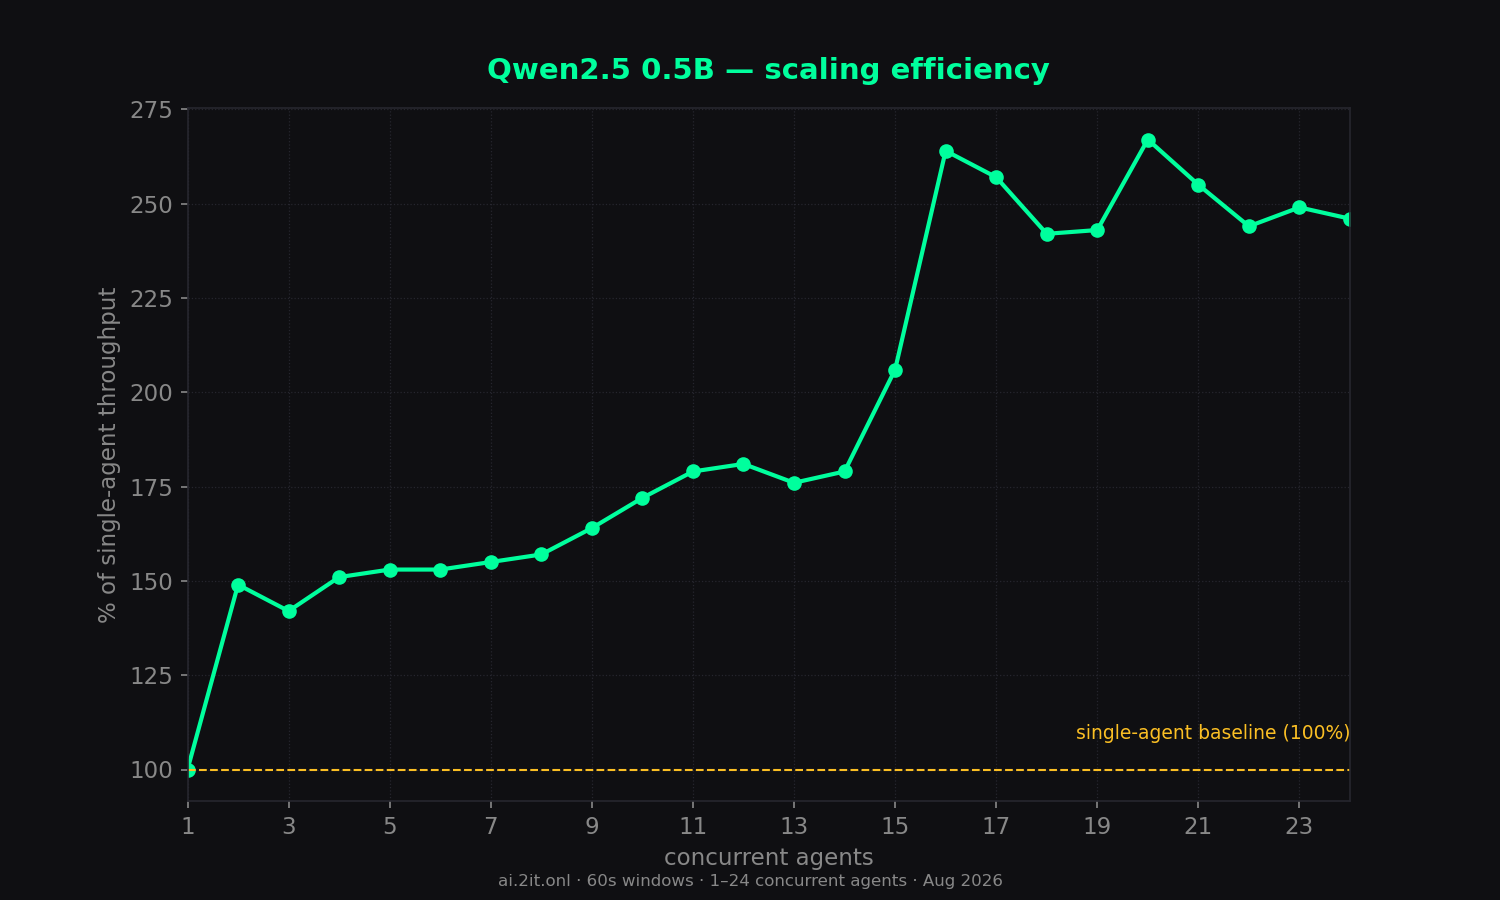
- Low relative scaling (100% → 267%) — but that's a good thing here: the model is already near capacity at 2 agents (527 tok/s), so concurrency adds little relative headroom. The mid-range (3–14) grows slowly, then a jump at 15–20.
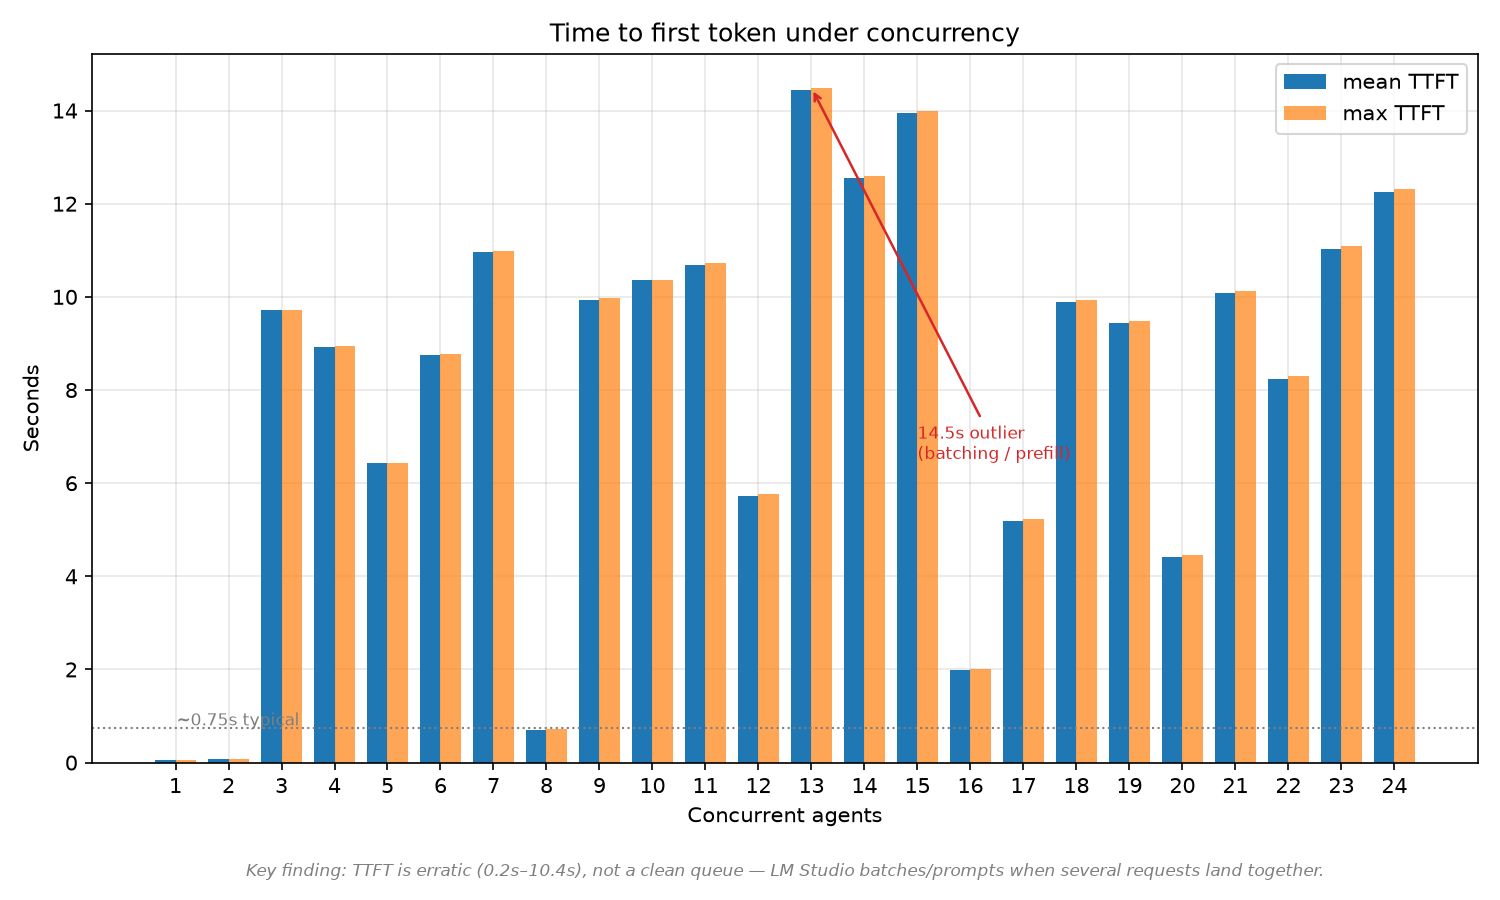
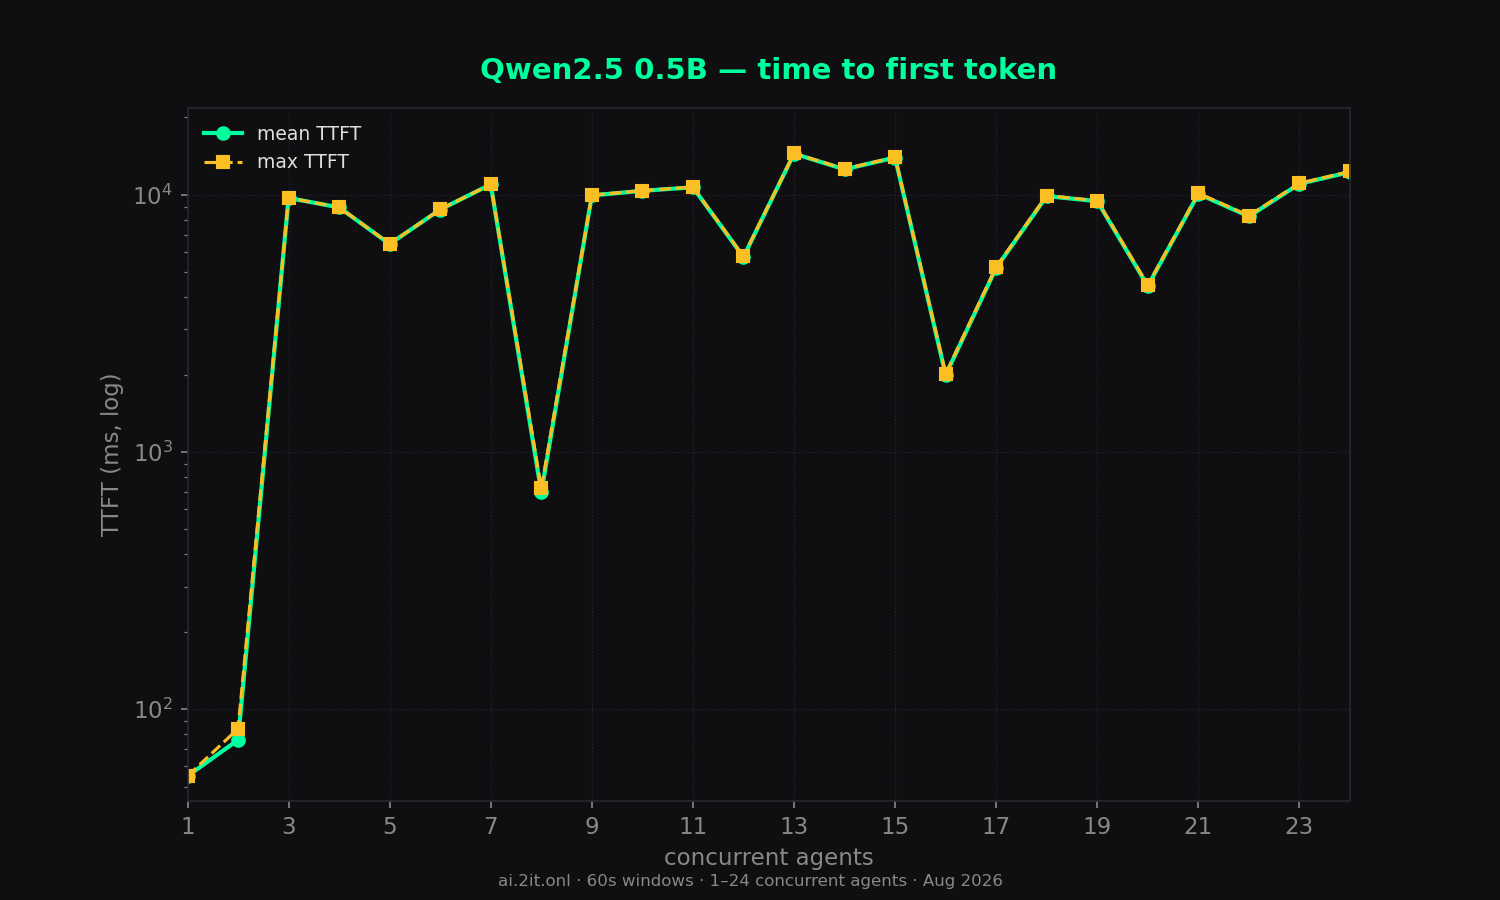
- Excellent latency: TTFT 55ms solo, mostly 2–14s under load with no pathological spikes.
- All visible content, 0 reasoning tokens.
- Errors: 0 across all 24 runs.
Sweep — total concurrency 1–24
| agents | wall (s) | content | reason | total | comb tok/s | comb all | per-agent | per-agent all | scale % | TTFT mean | TTFT max | ok | timeout | err |
|---|---|---|---|---|---|---|---|---|---|---|---|---|---|---|
| 1 | 33.9 | 12,000 | 0 | 12,000 | 354 | 354 | 354.8 | 354.8 | 100% | 55ms | 55ms | 1 | 0 | 0 |
| 2 | 45.6 | 24,000 | 0 | 24,000 | 527 | 527 | 264.1 | 268.0 | 149% | 76ms | 84ms | 2 | 0 | 0 |
| 3 | 60.0 | 30,077 | 0 | 30,077 | 501 | 501 | 472.2 | 489.6 | 142% | 9.7s | 9.7s | 0 | 3 | 0 |
| 4 | 60.0 | 32,129 | 0 | 32,129 | 535 | 535 | 166.9 | 178.3 | 151% | 8.9s | 8.9s | 0 | 4 | 0 |
| 5 | 60.0 | 32,476 | 0 | 32,476 | 541 | 541 | 161.4 | 169.9 | 153% | 6.4s | 6.4s | 0 | 5 | 0 |
| 6 | 60.1 | 32,443 | 0 | 32,443 | 540 | 540 | 134.0 | 139.0 | 153% | 8.8s | 8.8s | 0 | 6 | 0 |
| 7 | 60.0 | 32,882 | 0 | 32,882 | 548 | 548 | 199.1 | 201.8 | 155% | 11.0s | 11.0s | 0 | 7 | 0 |
| 8 | 60.0 | 33,382 | 0 | 33,382 | 556 | 556 | 85.9 | 89.2 | 157% | 696ms | 723ms | 0 | 8 | 0 |
| 9 | 60.1 | 34,893 | 0 | 34,893 | 581 | 581 | 146.1 | 148.6 | 164% | 9.9s | 10.0s | 0 | 9 | 0 |
| 10 | 60.1 | 36,567 | 0 | 36,567 | 609 | 609 | 117.4 | 119.0 | 172% | 10.4s | 10.4s | 0 | 10 | 0 |
| 11 | 60.0 | 37,939 | 0 | 37,939 | 632 | 632 | 100.9 | 105.3 | 179% | 10.7s | 10.7s | 0 | 11 | 0 |
| 12 | 60.1 | 38,531 | 0 | 38,531 | 642 | 642 | 73.6 | 76.4 | 181% | 5.7s | 5.8s | 0 | 12 | 0 |
| 13 | 60.1 | 37,386 | 0 | 37,386 | 623 | 623 | 73.5 | 74.5 | 176% | 14.4s | 14.5s | 0 | 13 | 0 |
| 14 | 60.1 | 38,049 | 0 | 38,049 | 634 | 634 | 75.9 | 76.8 | 179% | 12.6s | 12.6s | 0 | 14 | 0 |
| 15 | 60.1 | 43,862 | 0 | 43,862 | 730 | 730 | 68.1 | 70.7 | 206% | 13.9s | 14.0s | 0 | 15 | 0 |
| 16 | 60.1 | 56,214 | 0 | 56,214 | 936 | 936 | 69.9 | 71.9 | 264% | 2.0s | 2.0s | 0 | 16 | 0 |
| 17 | 60.1 | 54,694 | 0 | 54,694 | 911 | 911 | 81.9 | 85.0 | 257% | 5.2s | 5.2s | 0 | 17 | 0 |
| 18 | 60.1 | 51,477 | 0 | 51,477 | 857 | 857 | 79.2 | 82.1 | 242% | 9.9s | 9.9s | 0 | 18 | 0 |
| 19 | 60.1 | 51,674 | 0 | 51,674 | 860 | 860 | 60.2 | 61.9 | 243% | 9.4s | 9.5s | 0 | 19 | 0 |
| 20 peak | 60.1 | 56,706 | 0 | 56,706 | 944 | 944 | 71.7 | 74.2 | 267% | 4.4s | 4.5s | 0 | 20 | 0 |
| 21 | 60.1 | 54,171 | 0 | 54,171 | 902 | 902 | 70.0 | 72.4 | 255% | 10.1s | 10.1s | 0 | 21 | 0 |
| 22 | 60.1 | 51,814 | 0 | 51,814 | 863 | 863 | 64.6 | 67.4 | 244% | 8.2s | 8.3s | 0 | 22 | 0 |
| 23 | 60.1 | 52,938 | 0 | 52,938 | 881 | 881 | 74.0 | 77.3 | 249% | 11.0s | 11.1s | 0 | 23 | 0 |
| 24 | 60.1 | 52,334 | 0 | 52,334 | 871 | 871 | 73.4 | 77.0 | 246% | 12.3s | 12.3s | 0 | 24 | 0 |
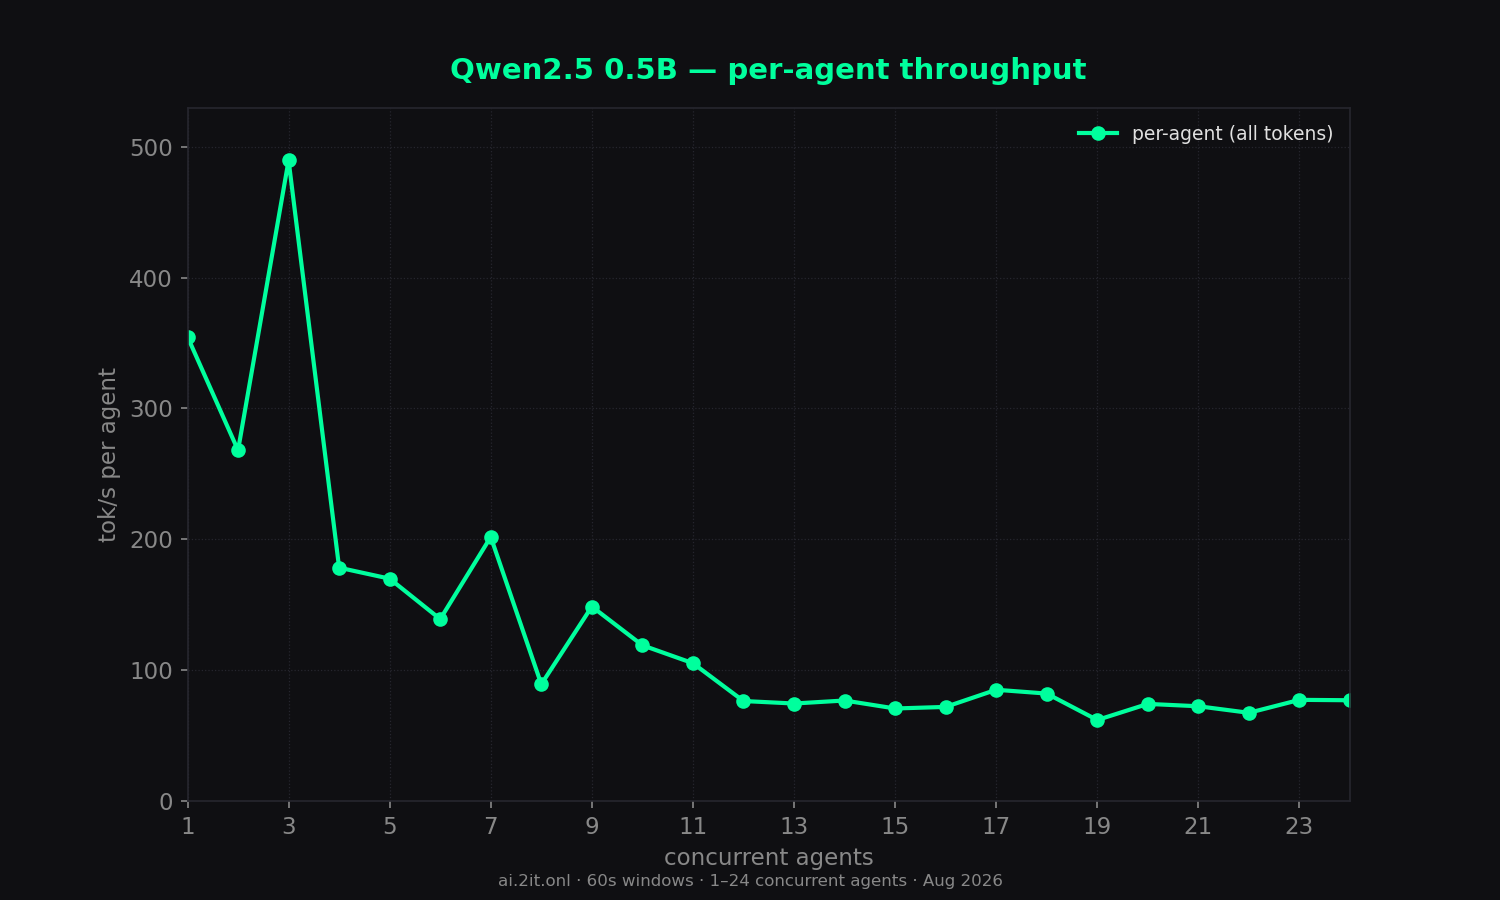
* burst artifact — agents queued ~11–16s then generated in a short burst; the per-agent timer inflates the number. Trust combined throughput and TTFT columns. Peak row = highest combined (all-token) throughput.
Charts
Raw data & downloads
- report.md5 KB
- sweep-summary.csv2 KB
- sweep-summary.json11 KB
- combined_throughput.png122 KB · original matplotlib export
- combined_vs_per_agent.png103 KB · original matplotlib export
- dashboard_1_24.png166 KB · original matplotlib export
- outcome_breakdown.png57 KB · original matplotlib export
- per_agent_throughput.png118 KB · original matplotlib export
- scaling_efficiency.png82 KB · original matplotlib export
- time_to_first_token.png66 KB · original matplotlib export
- total_tokens_generated.png71 KB · original matplotlib export