Qwen2.5 1.5B
server model id:
qwen2.5-1.5bnon-thinkingKV F16ctx 32k1.5B params
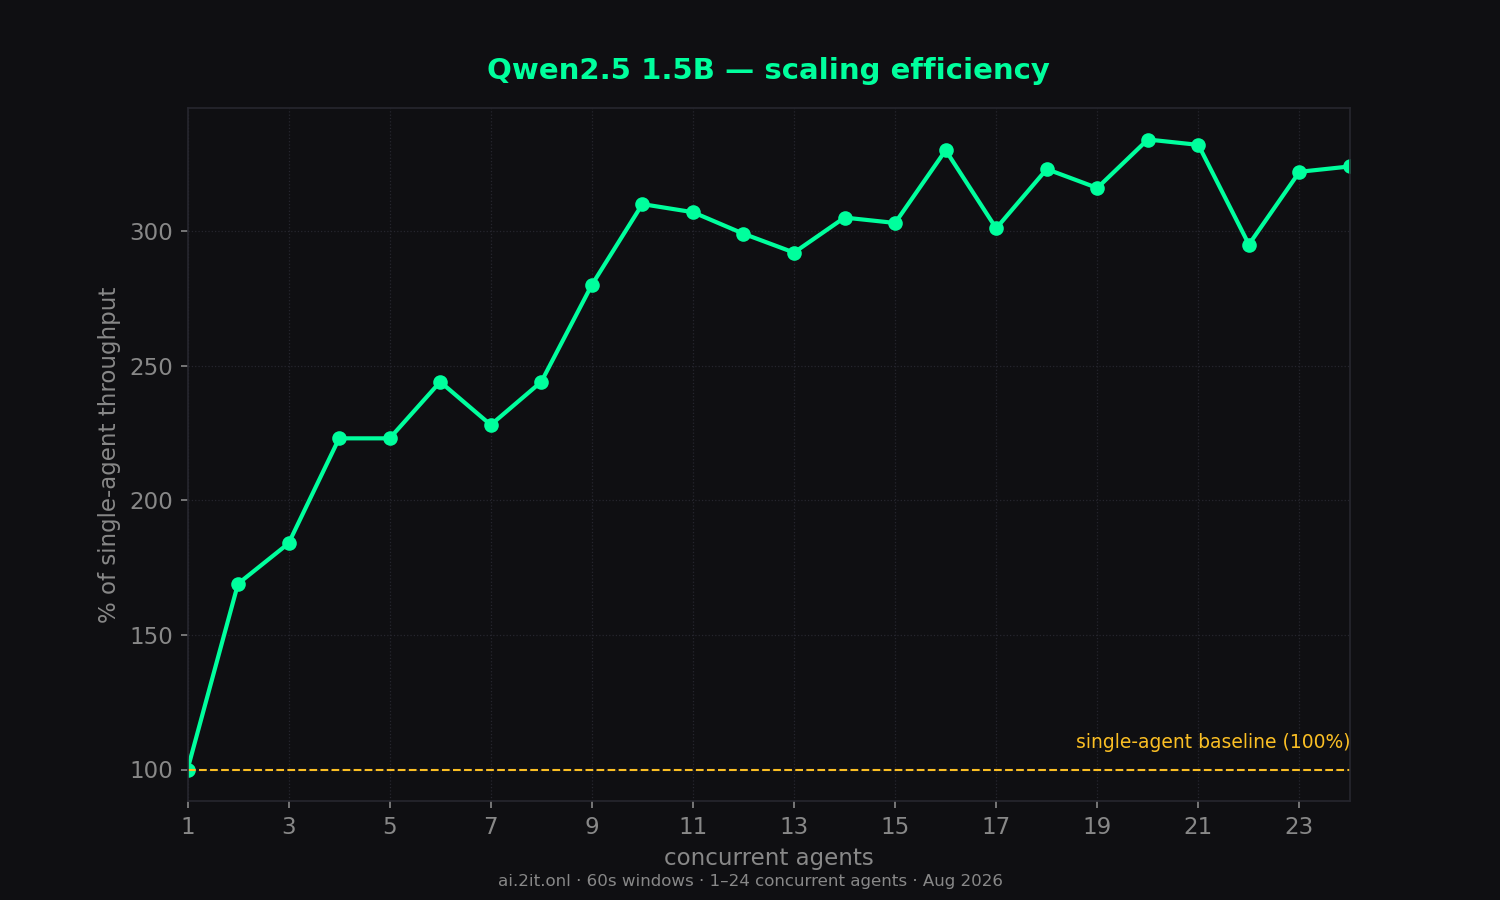
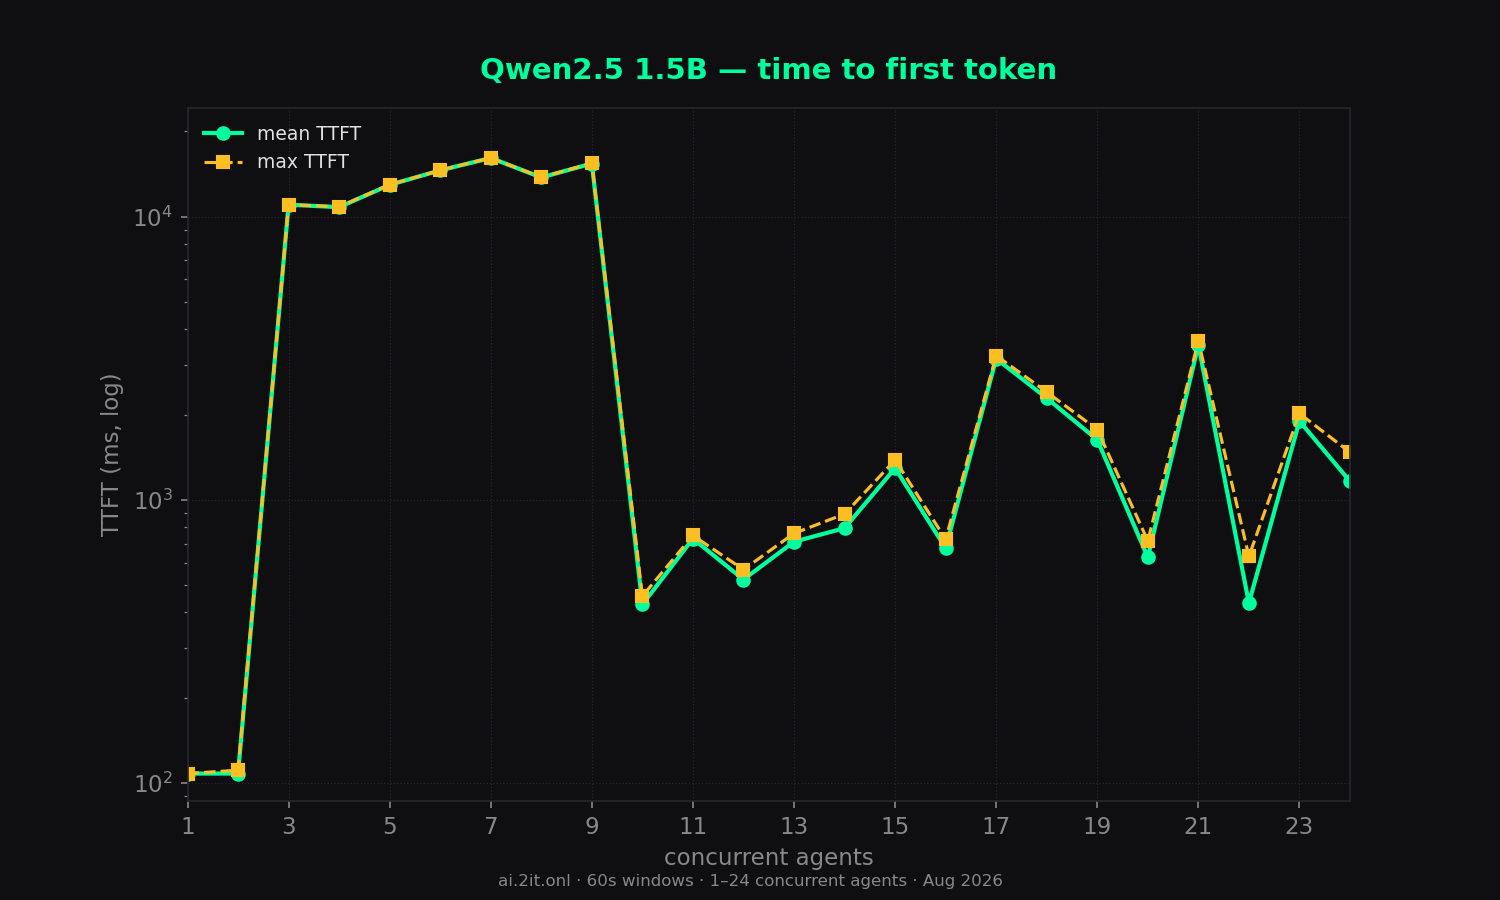
Best latency at low concurrency (108ms TTFT) and 3.3x scaling — but an erratic mid-range TTFT curve.
Key findings
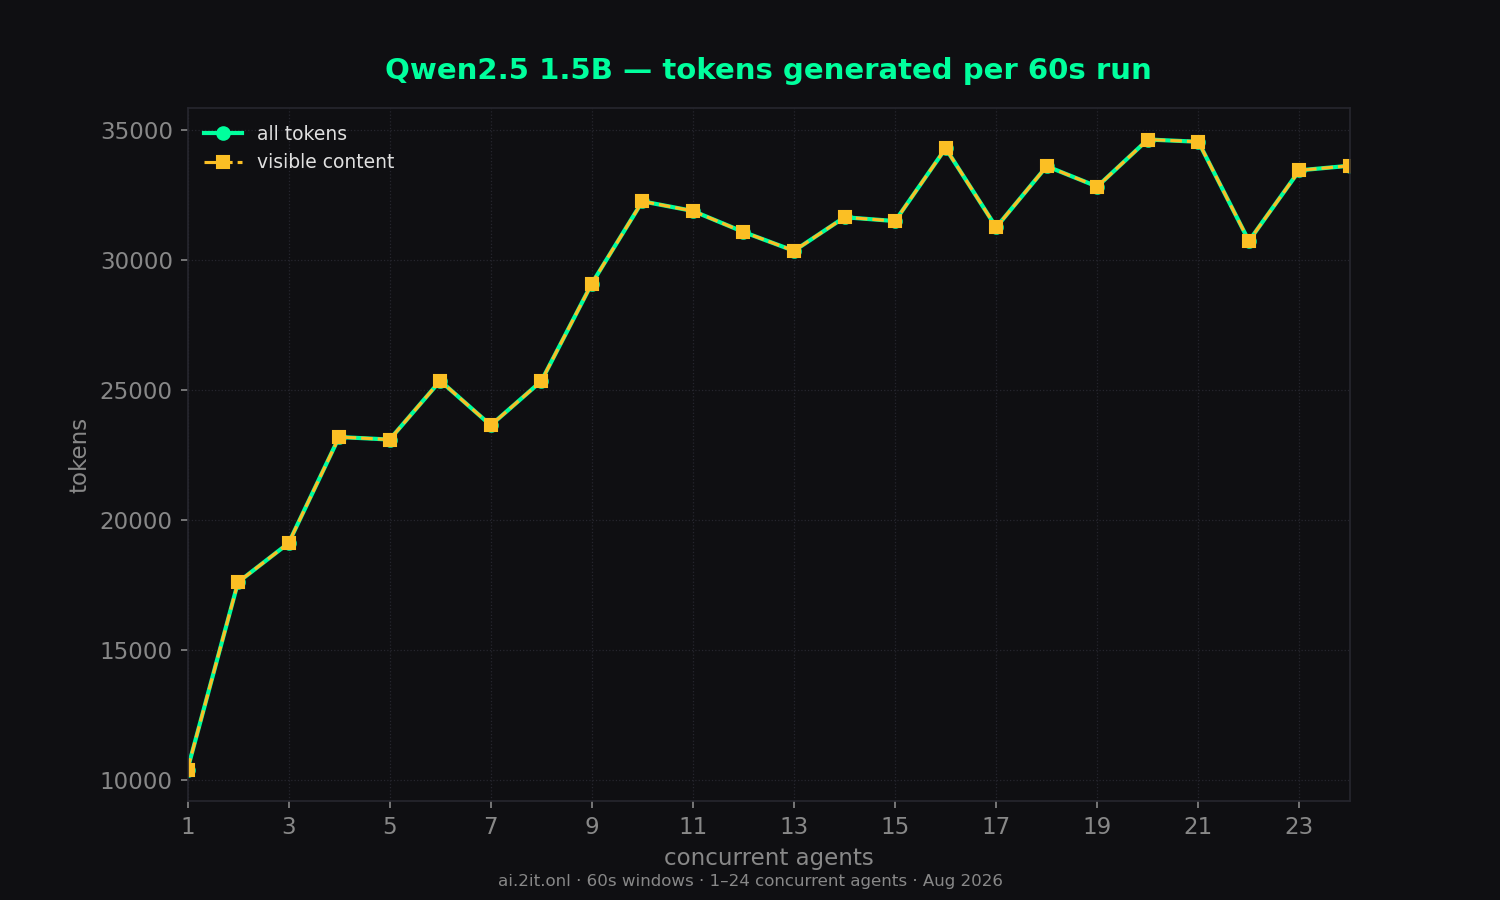
- Clean, all-content output: 0 reasoning tokens everywhere — every token is visible content.
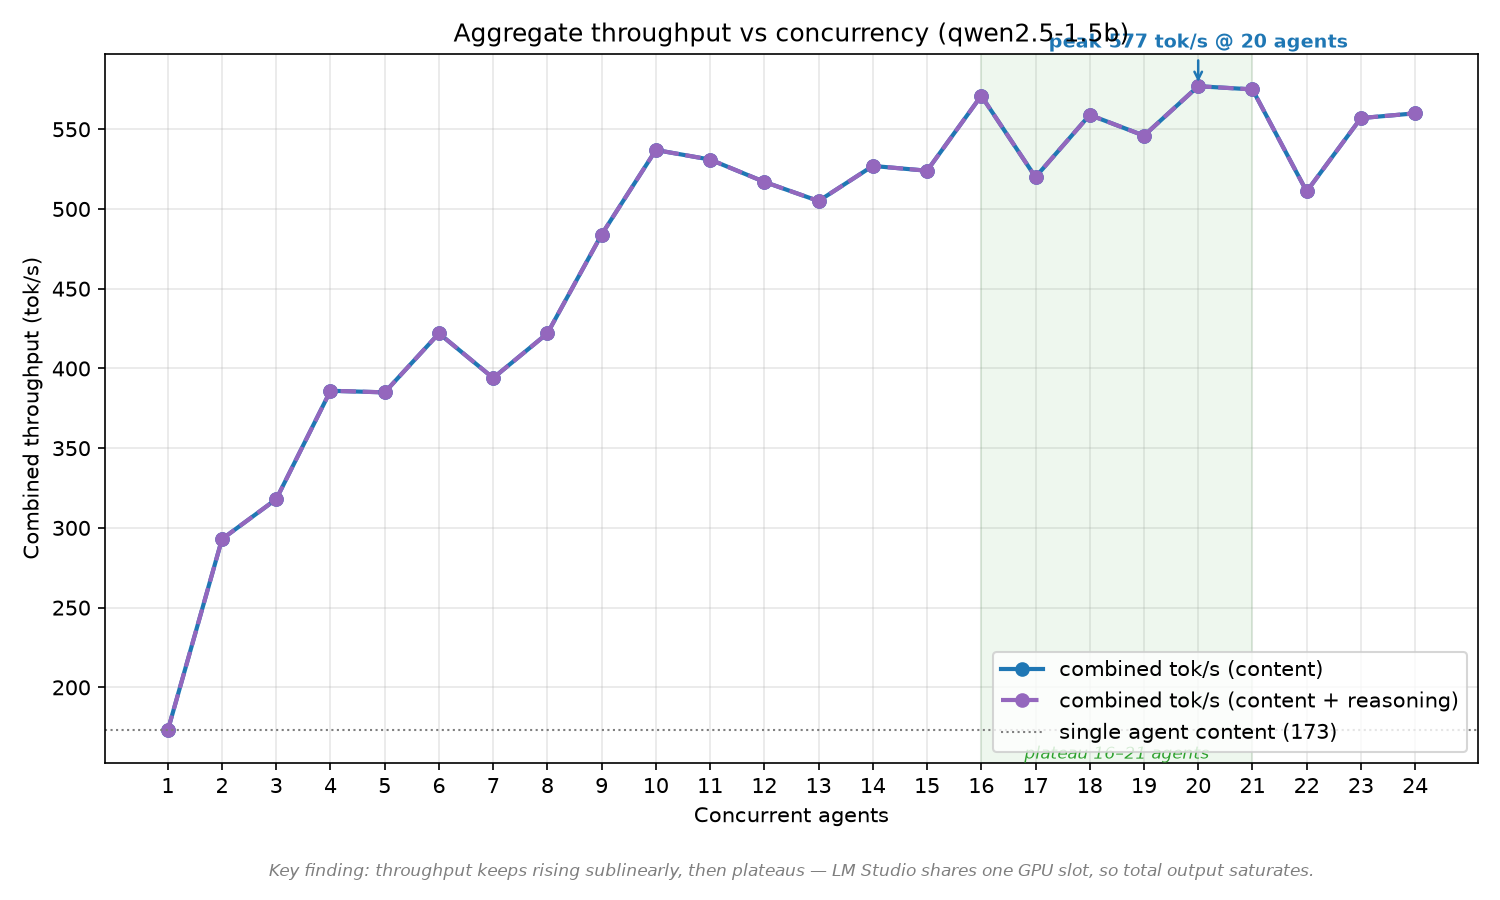
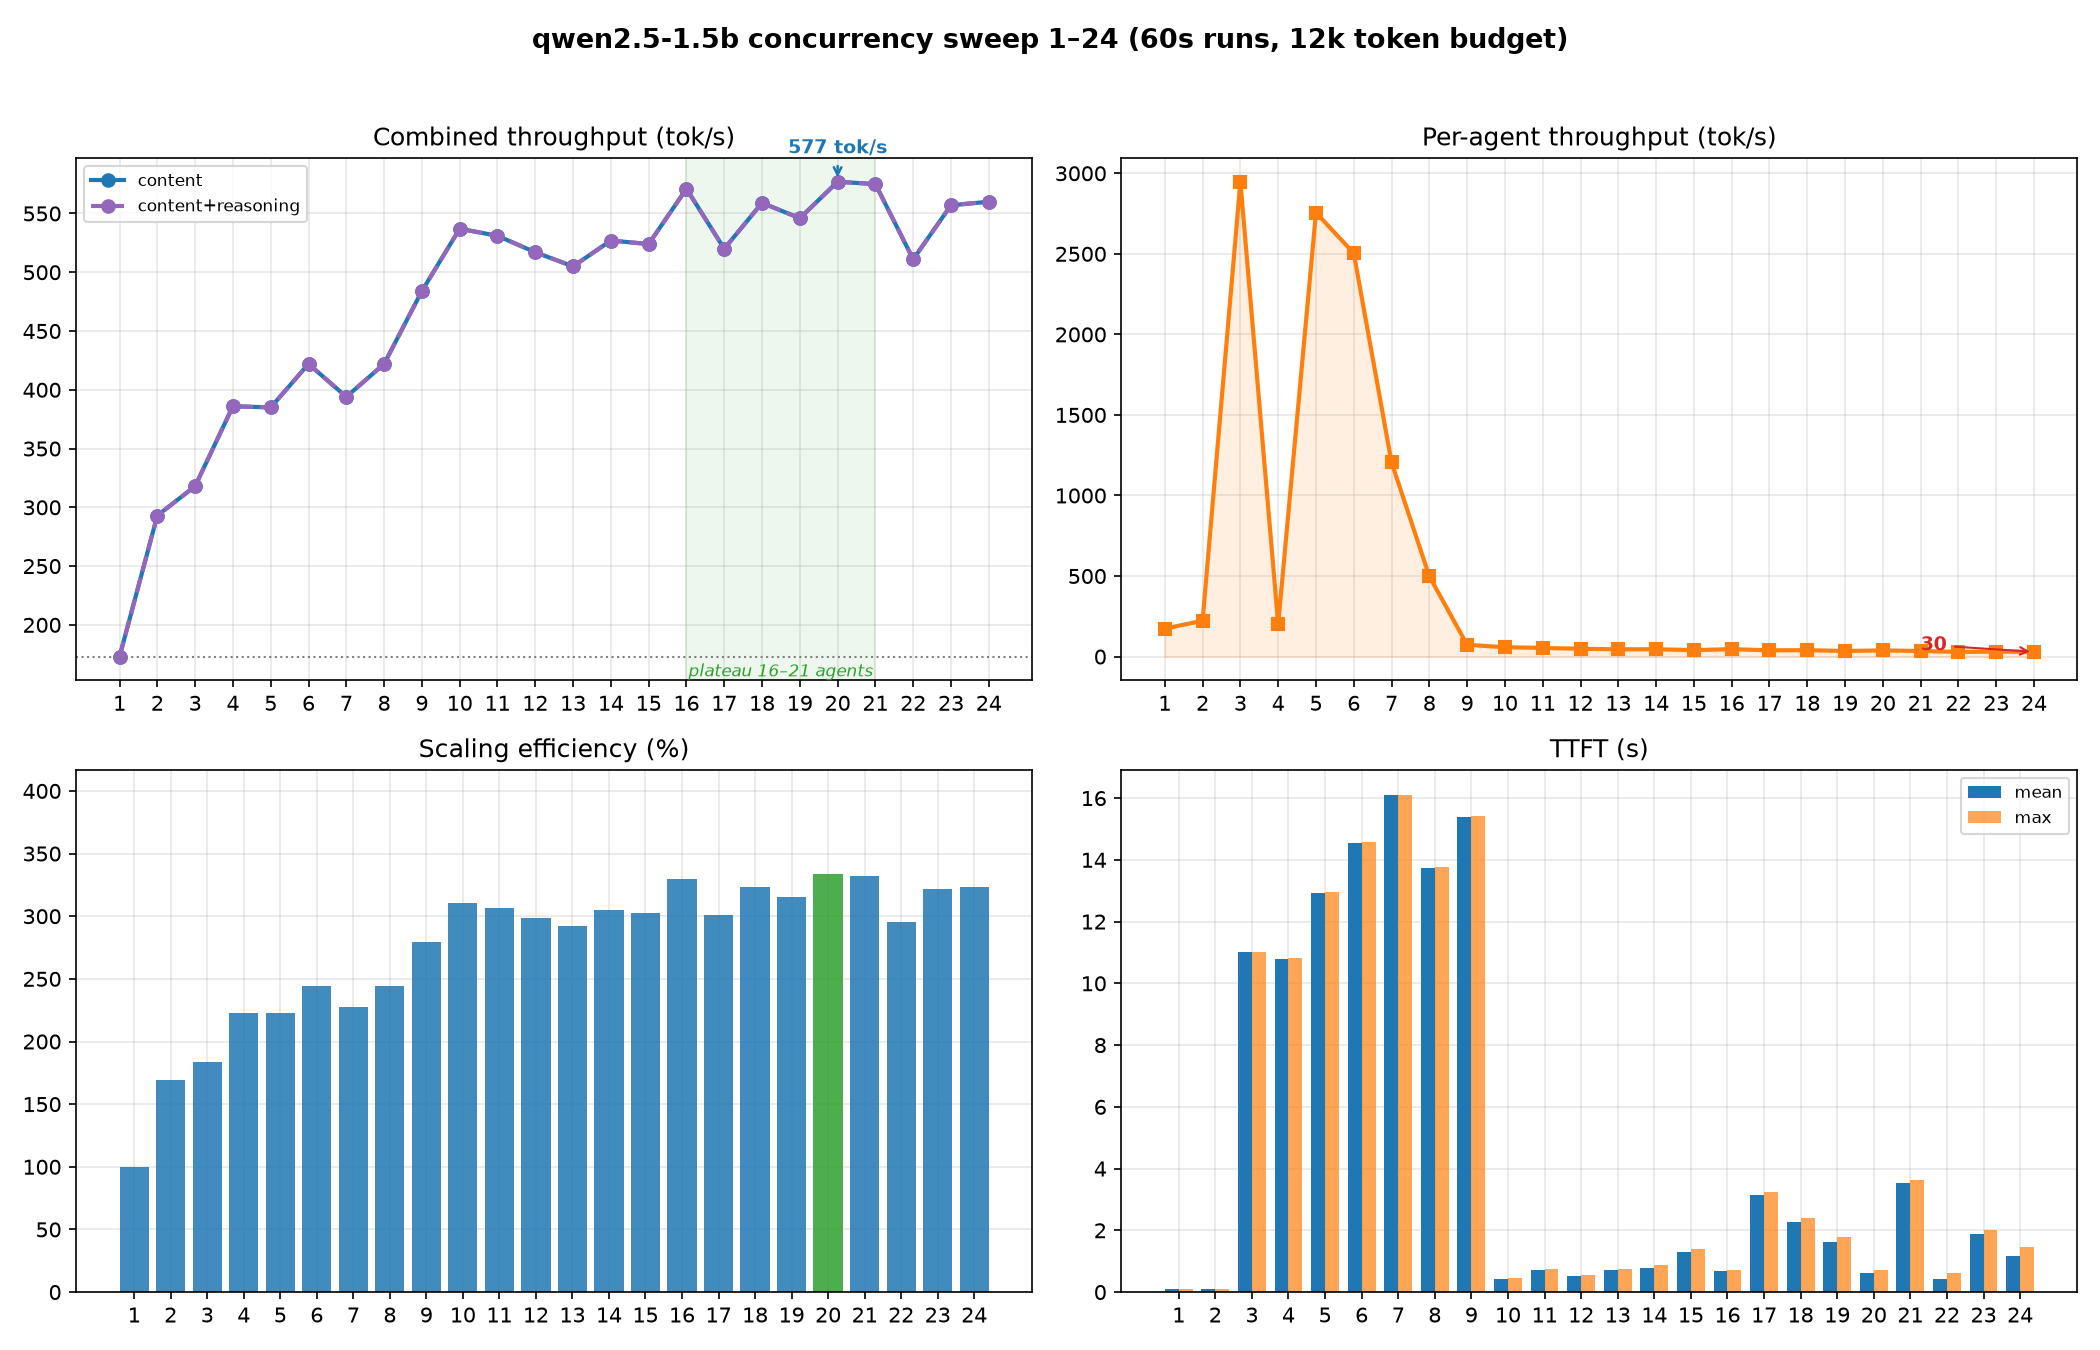
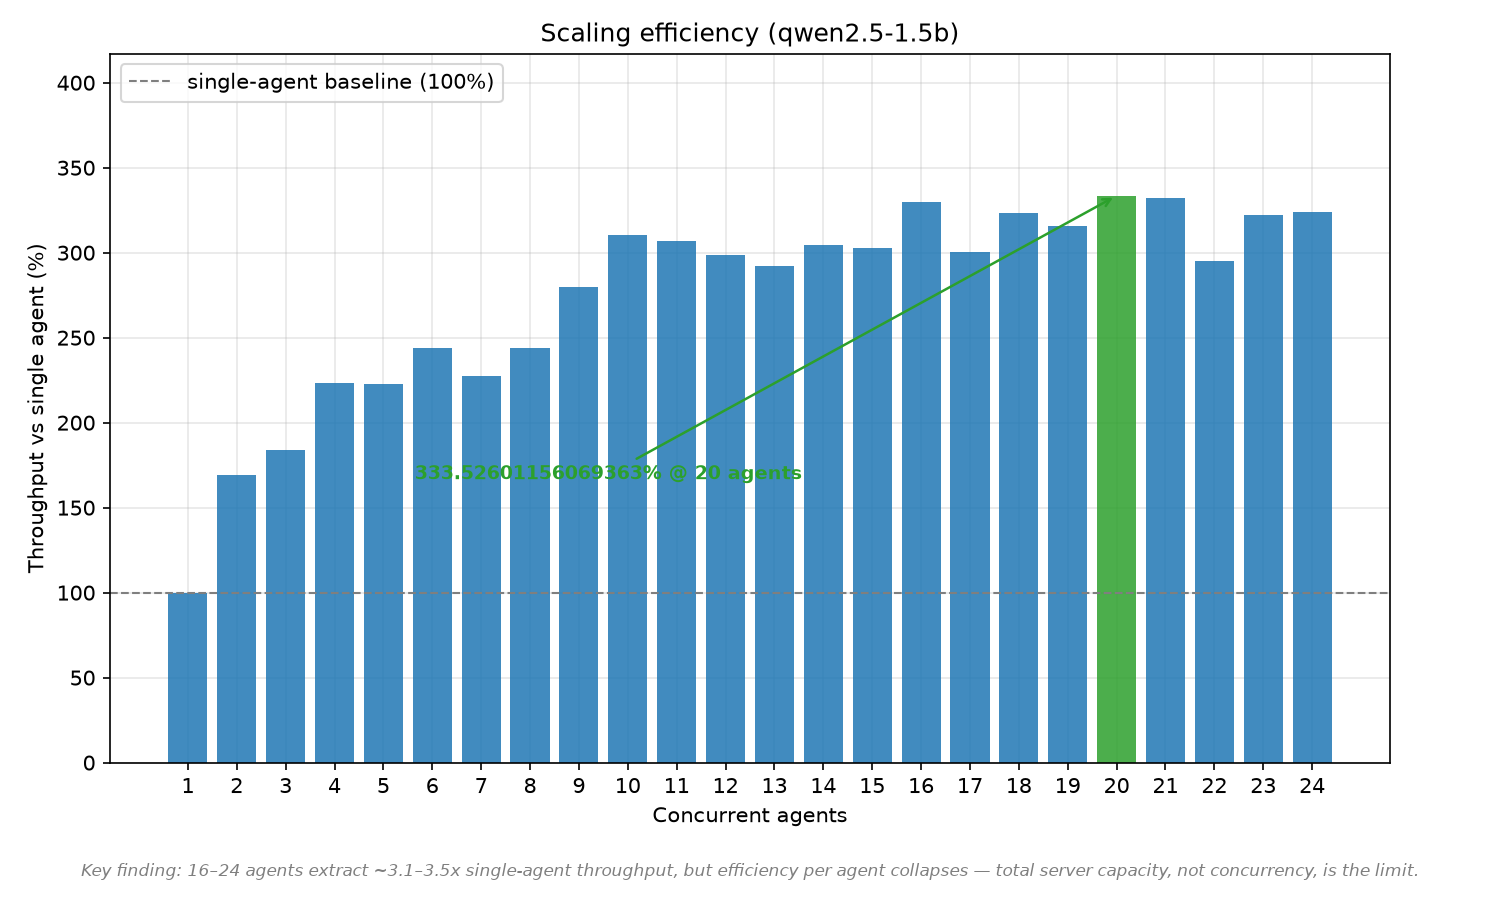
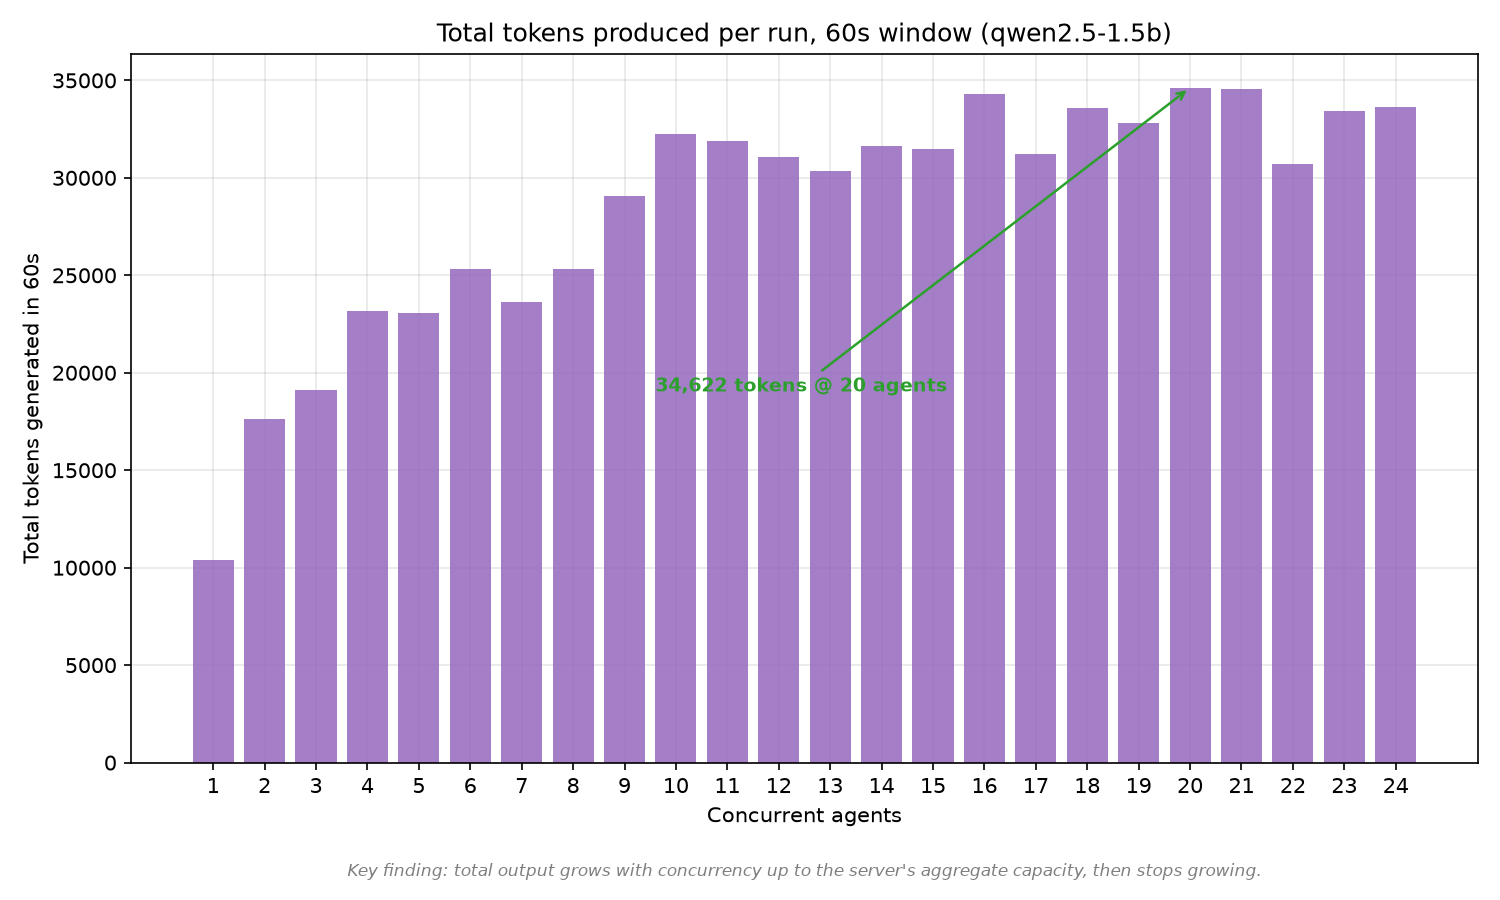
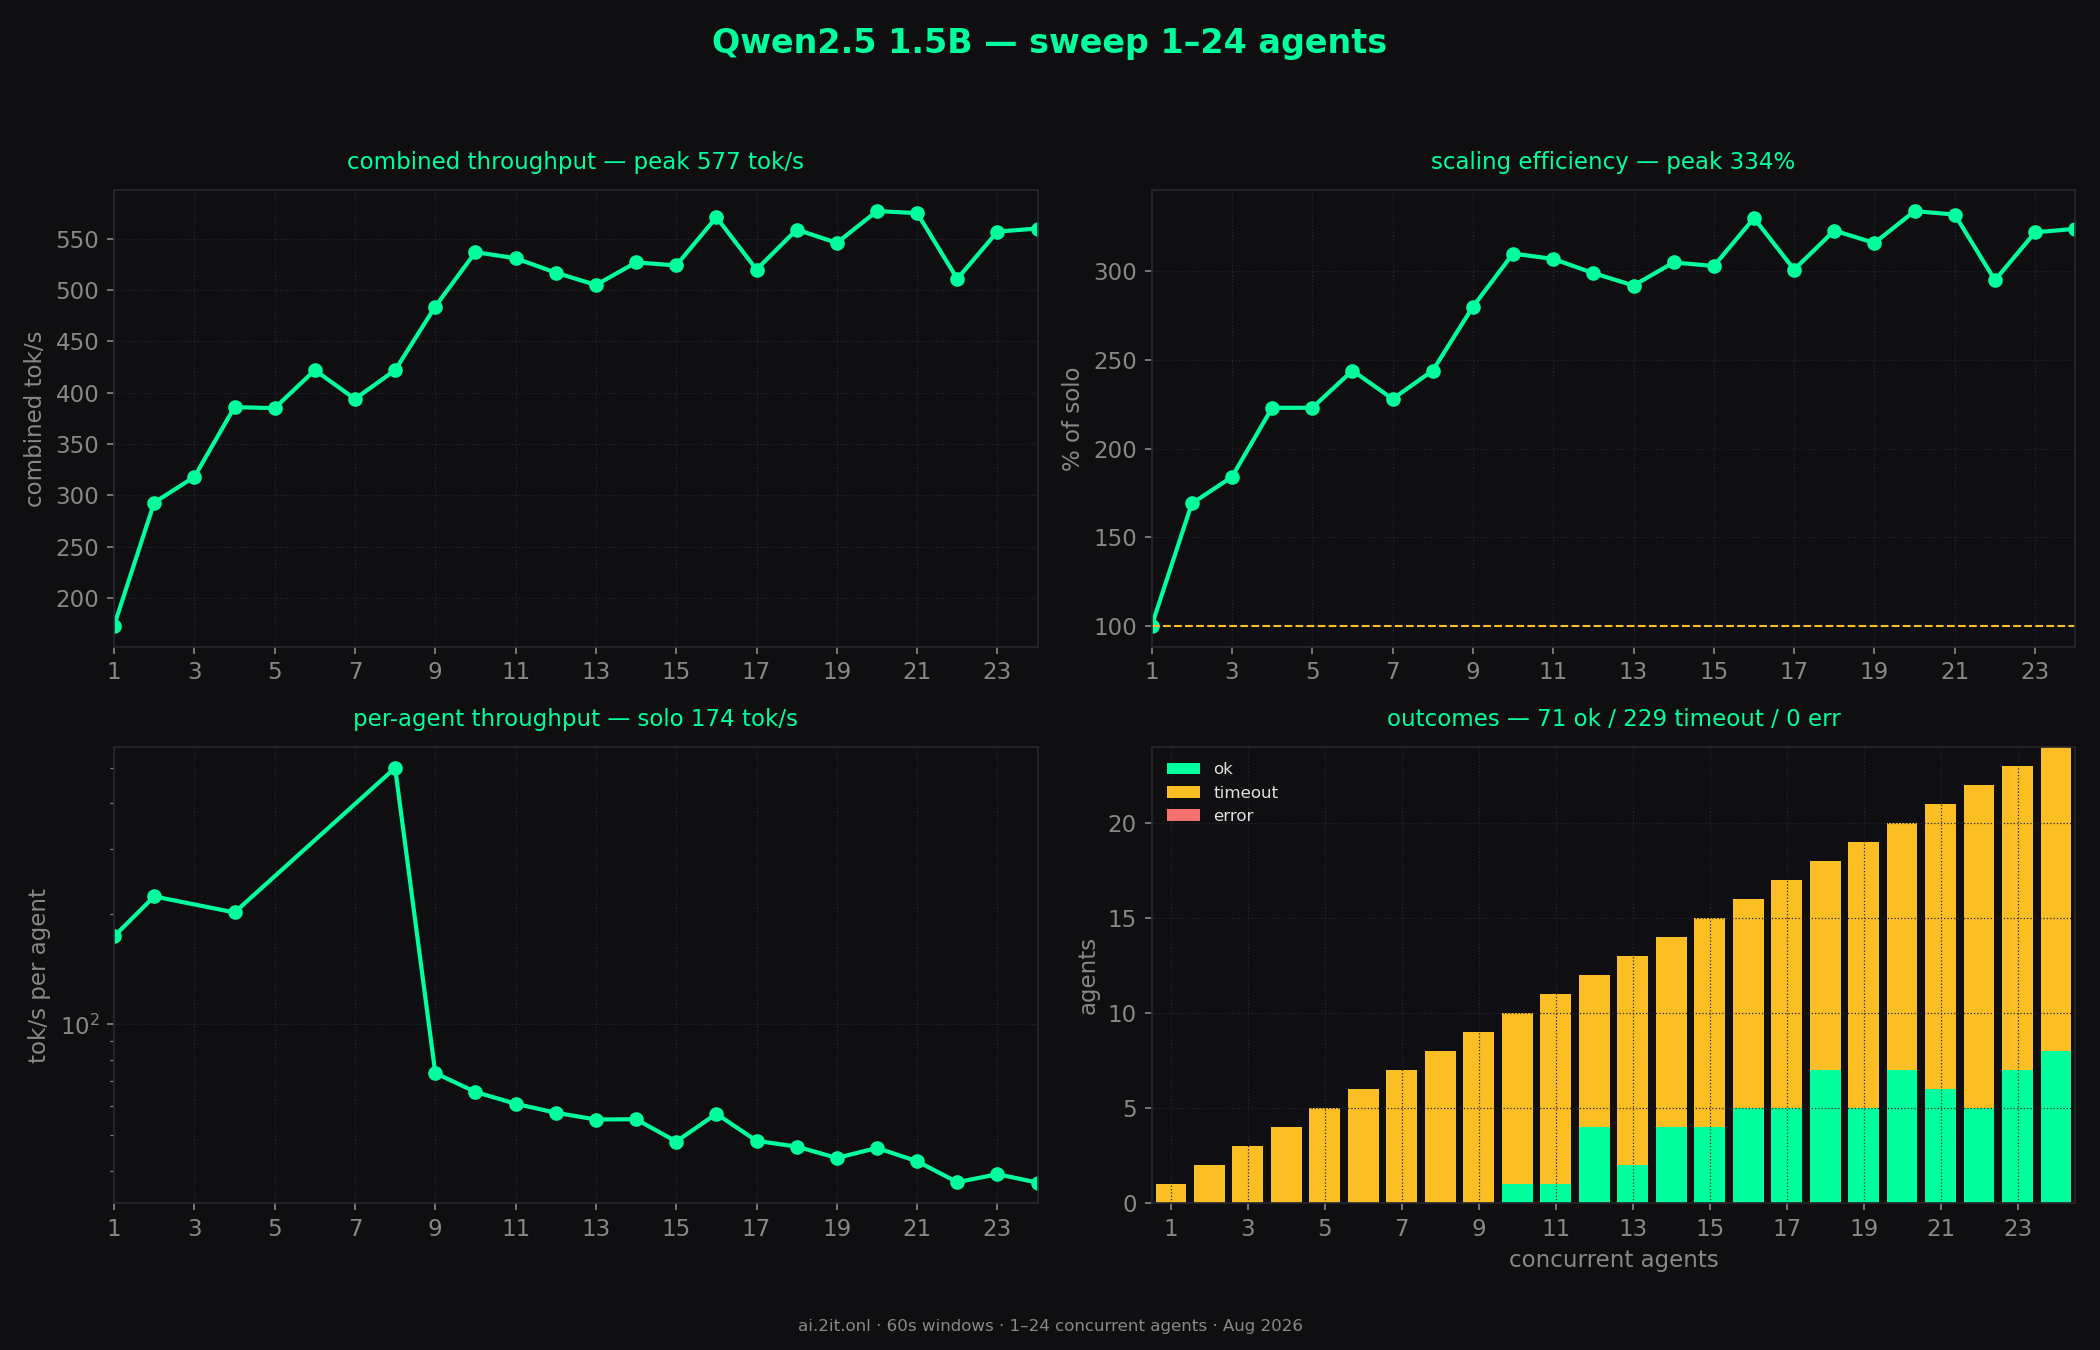
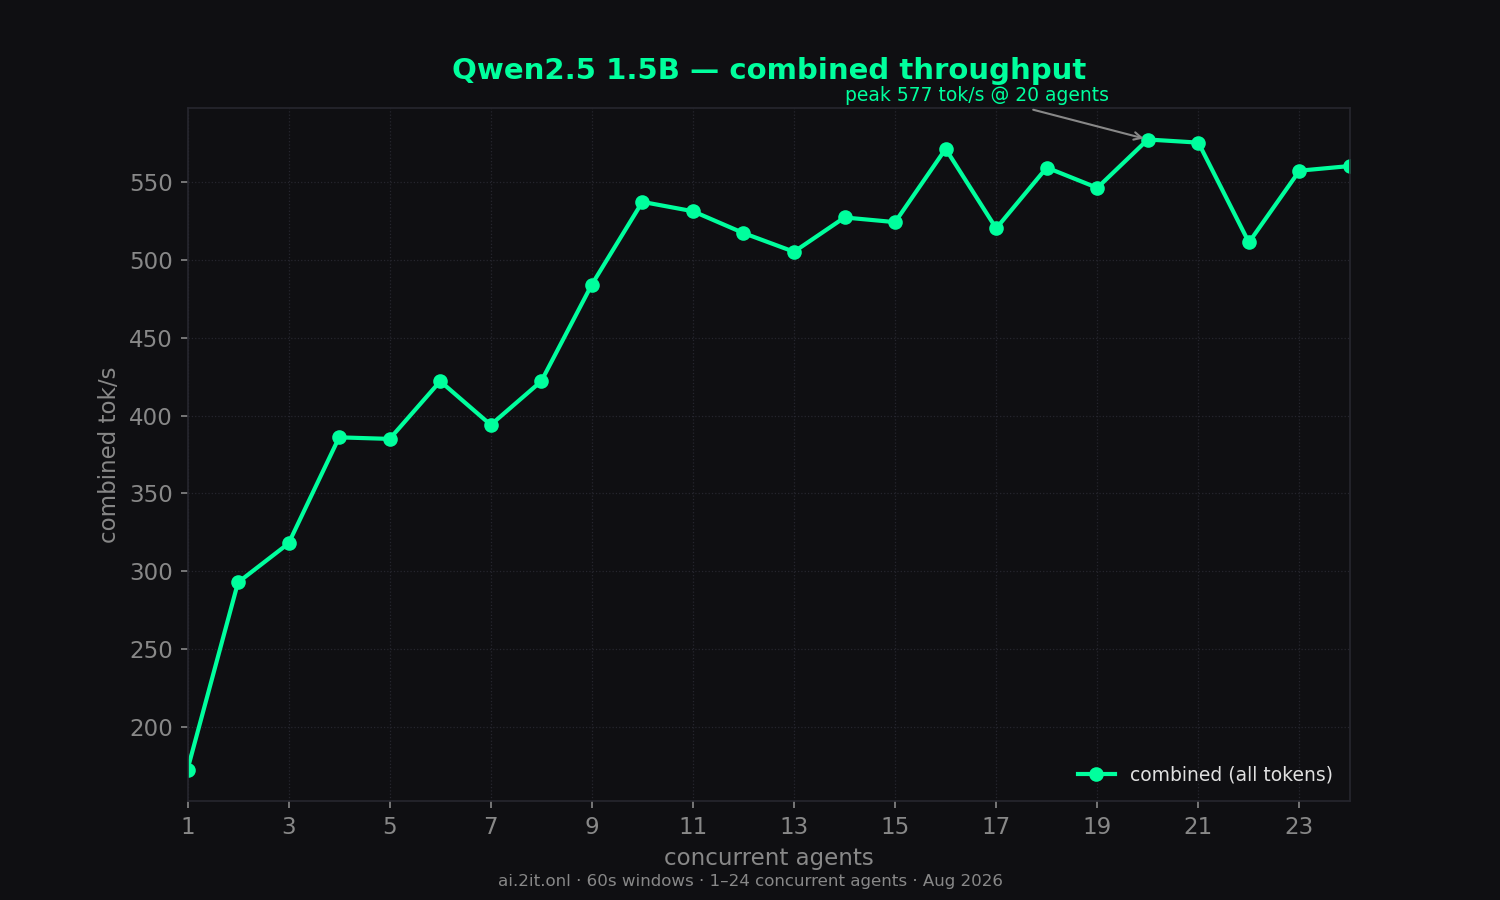
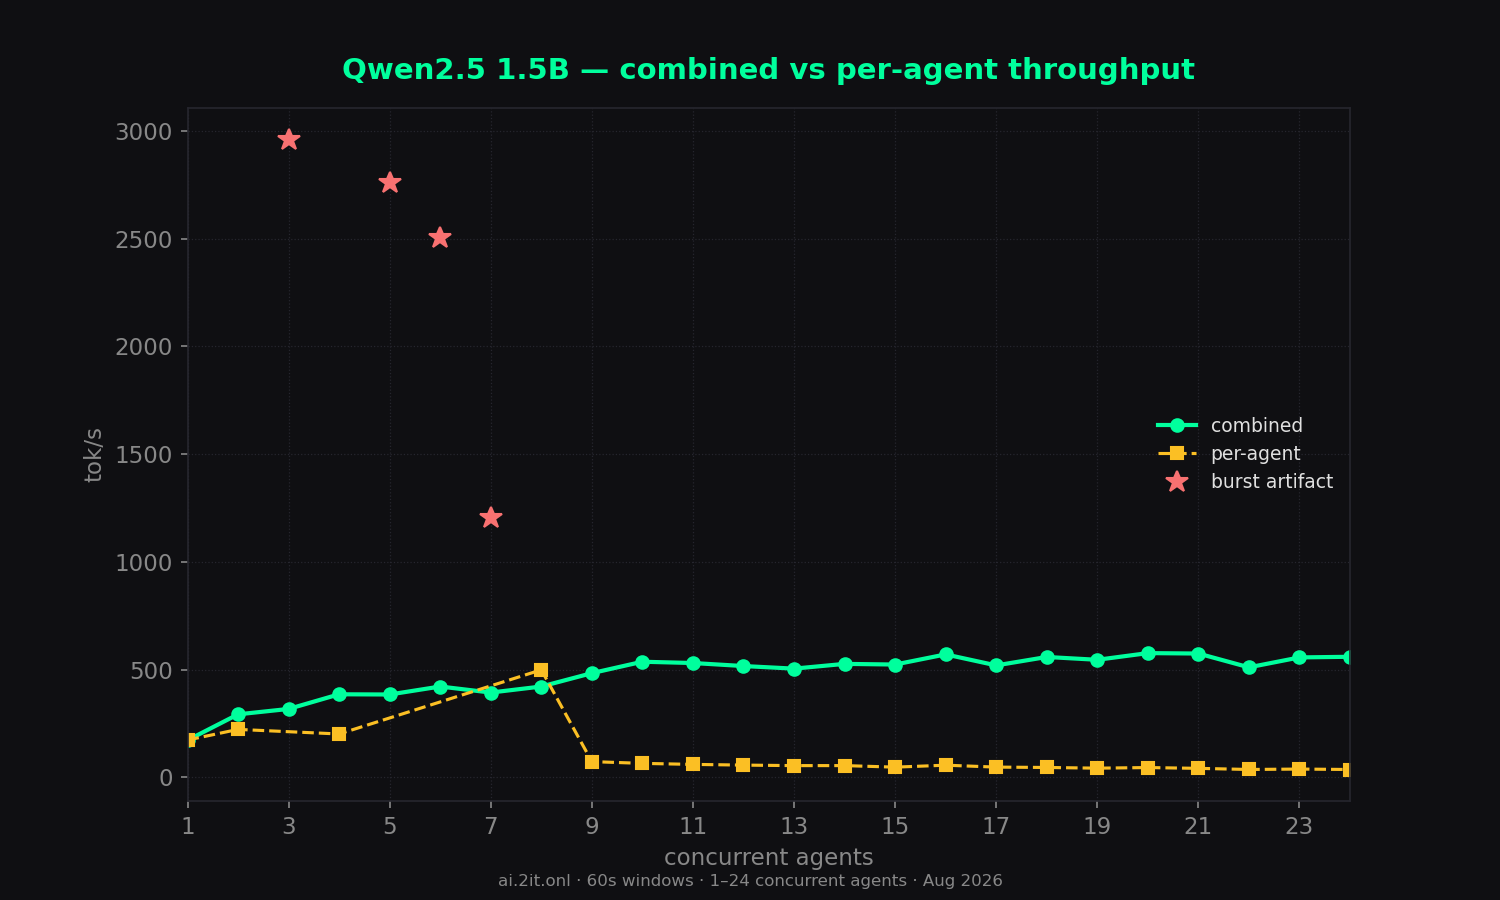
- Good scaling: combined throughput 173 tok/s solo → 577 tok/s at 20 agents (3.3x), plateauing around 520–577 from 10–24 agents.
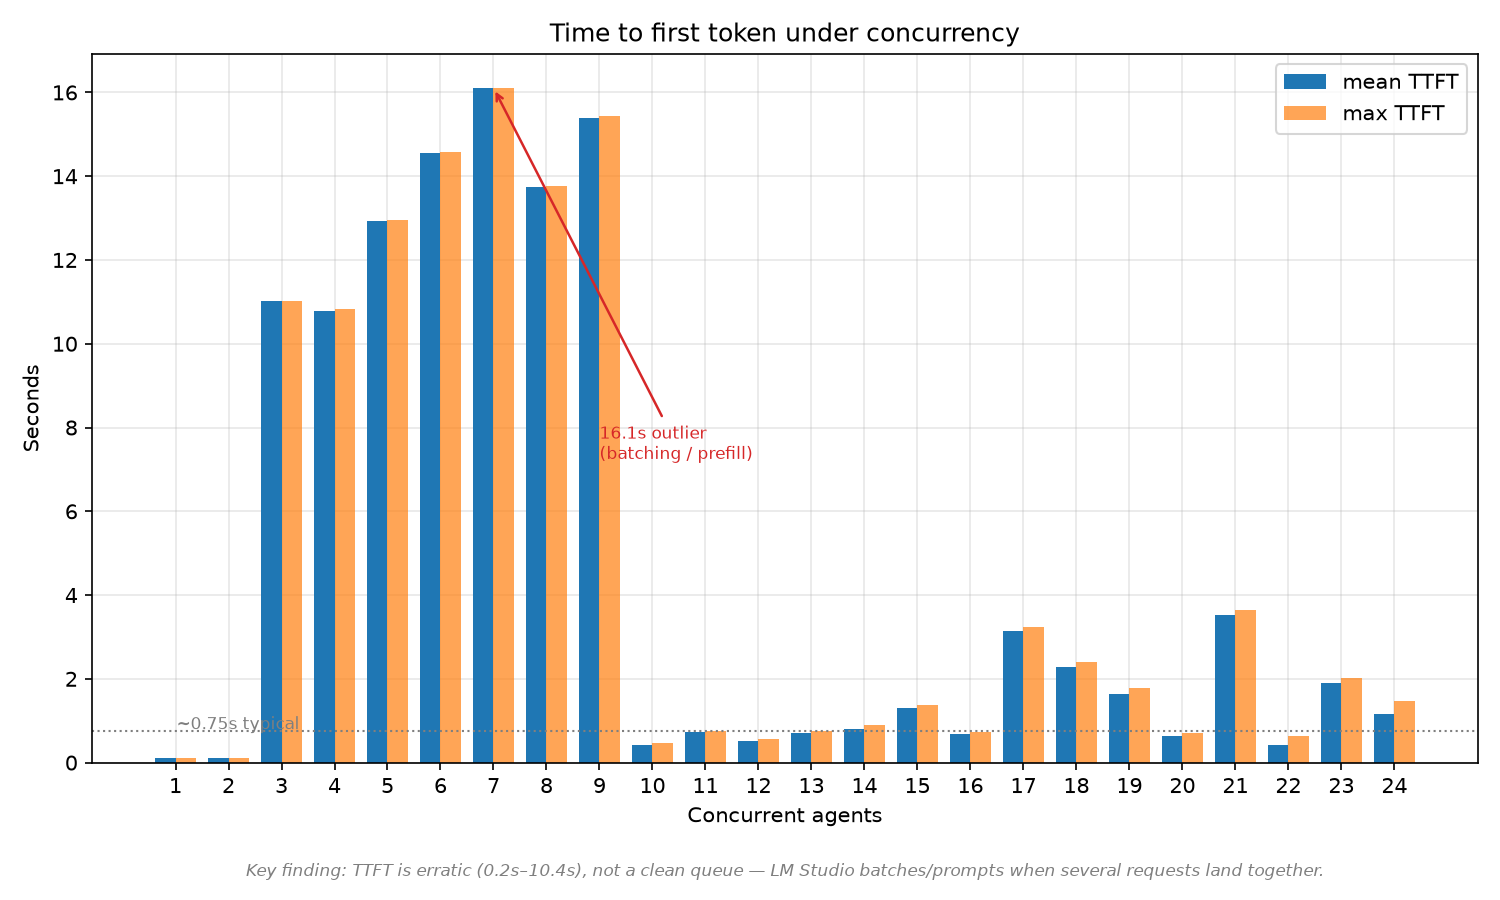
- Best latency of the lot at low concurrency: TTFT just 108ms at 1–2 agents. It degrades in the mid-range (11–16s at 3–9 agents — likely server batching transitions) then recovers to sub-second at 10+ agents. This erratic profile mirrors what we saw with the other models.
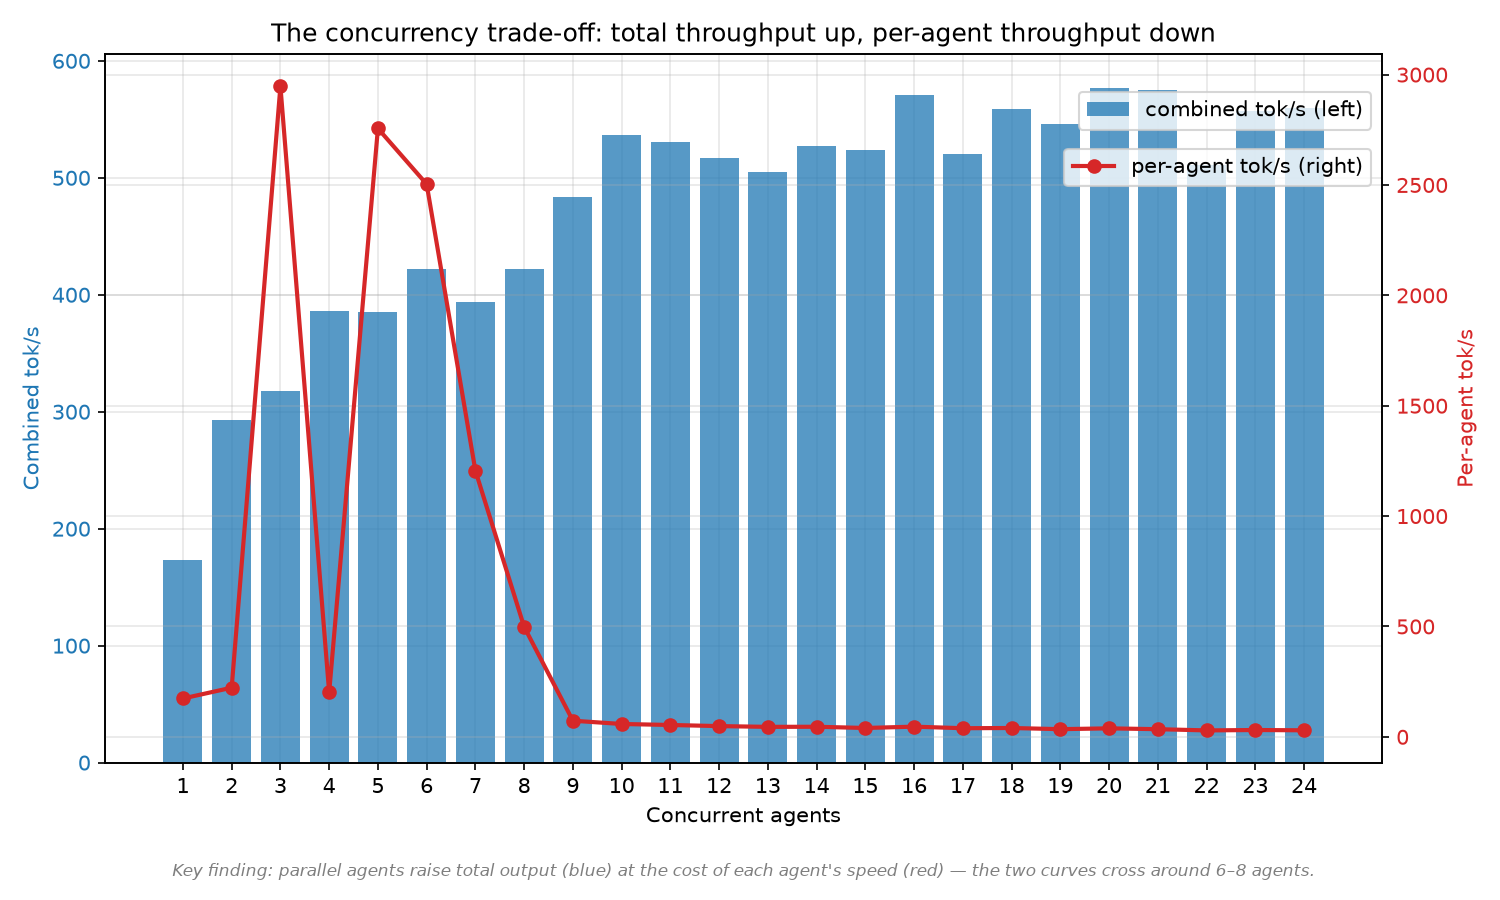
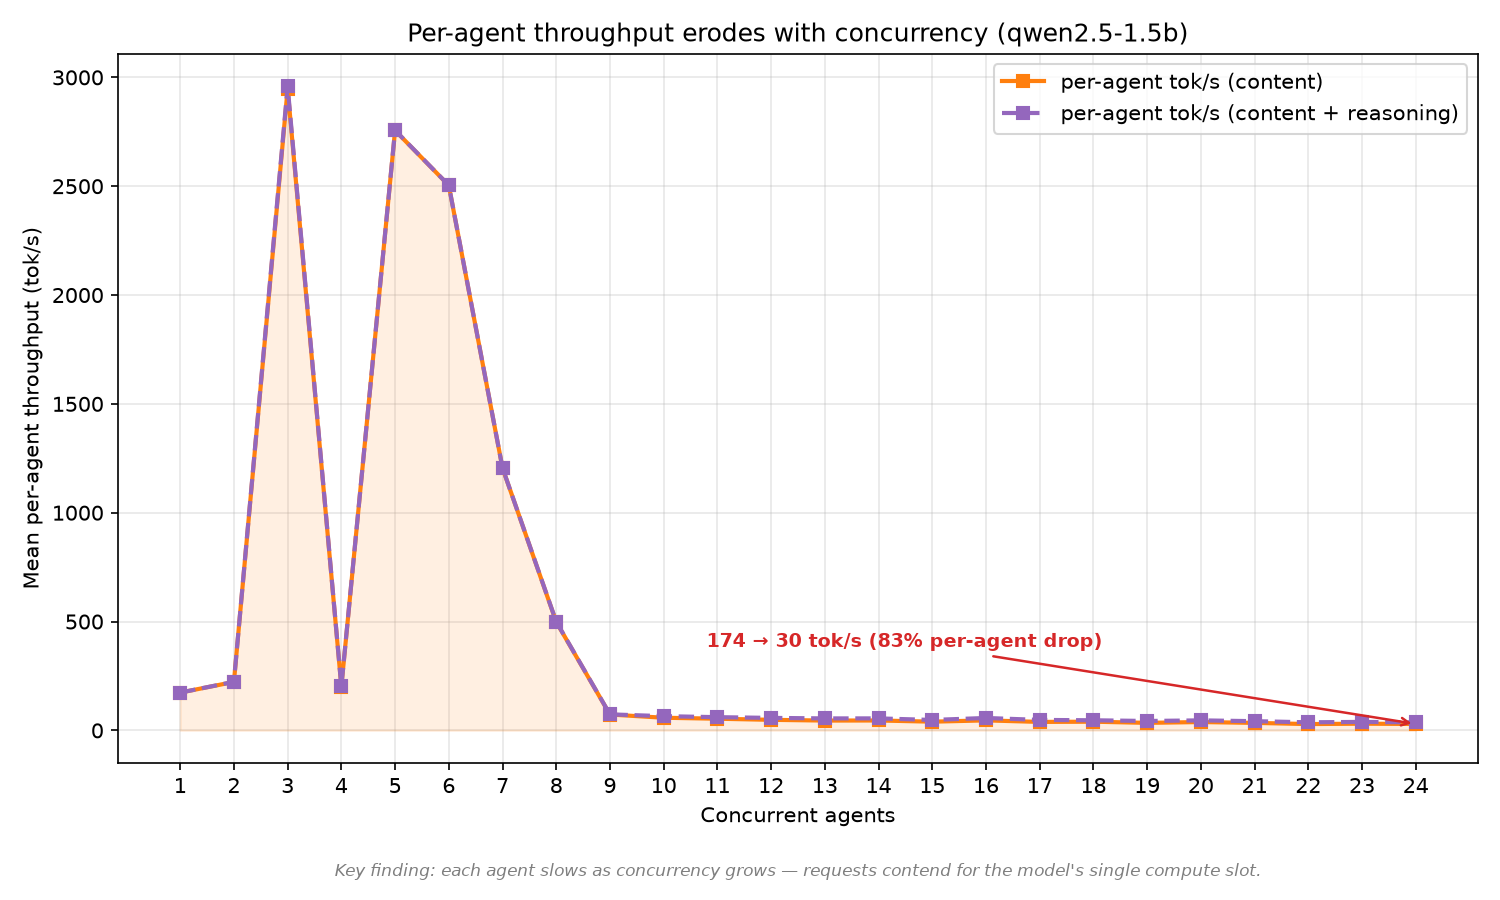
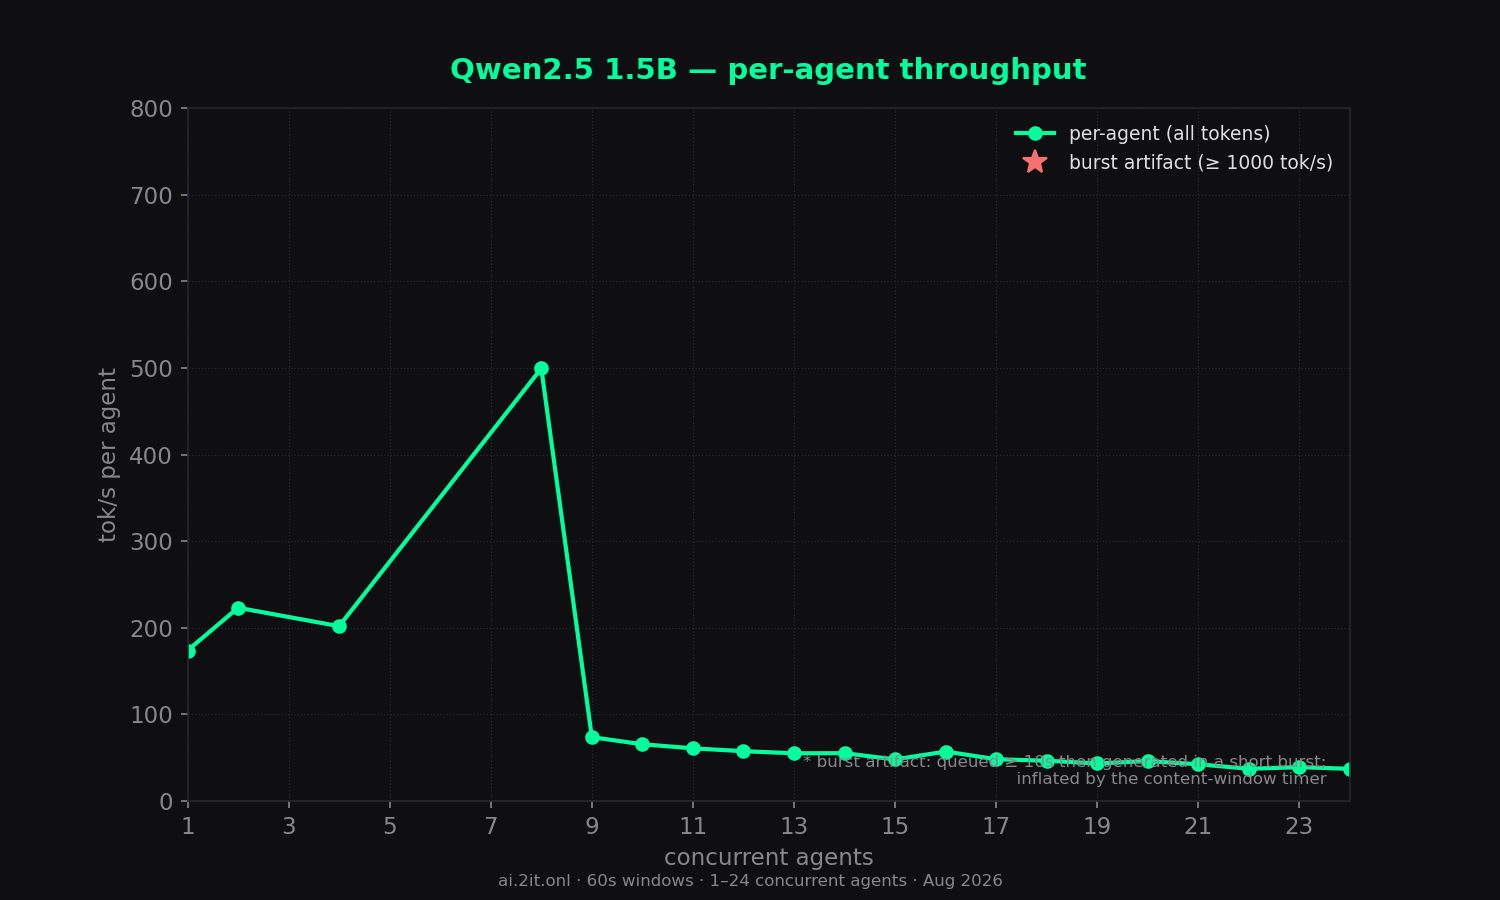
- Per-agent speed: ~30–46 tok/s at high concurrency (vs 173 solo) — the usual slot-contention erosion.
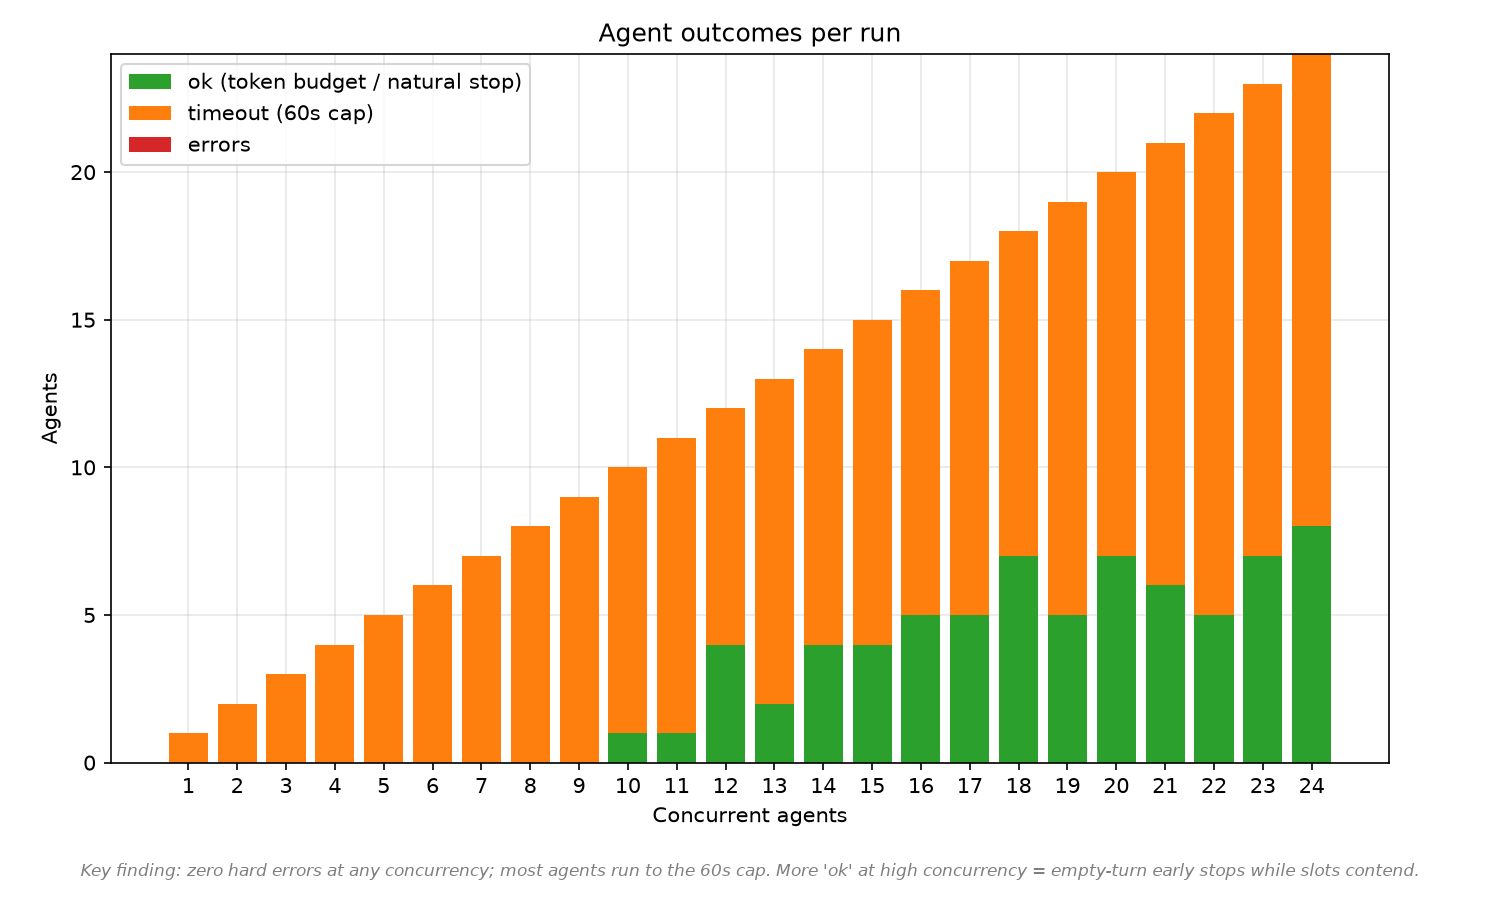
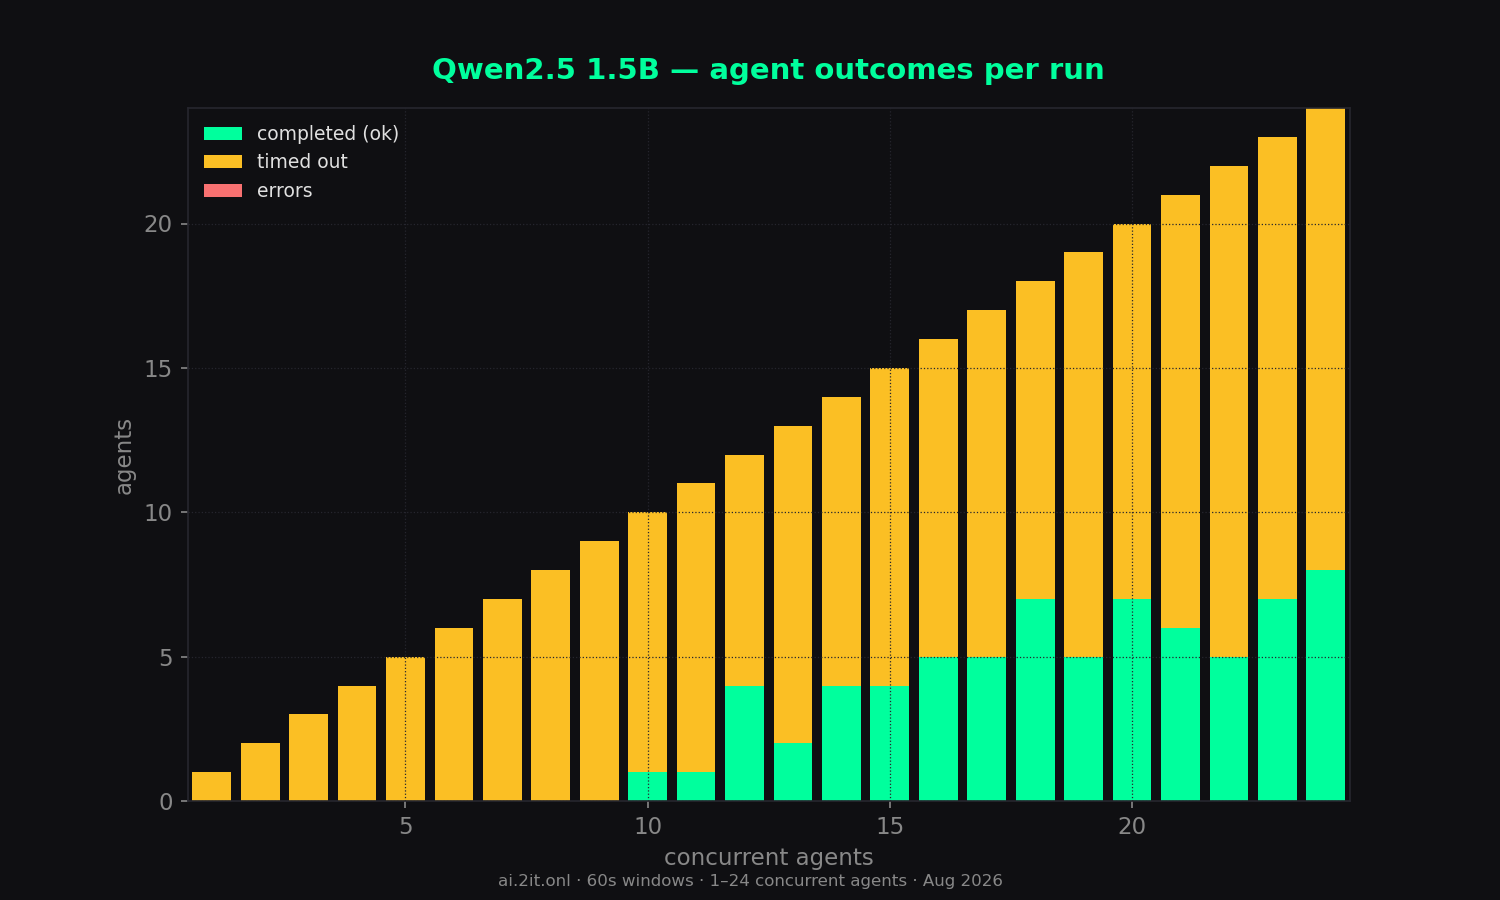
- Errors: 0 across all 24 runs.
Sweep — total concurrency 1–24
| agents | wall (s) | content | reason | total | comb tok/s | comb all | per-agent | per-agent all | scale % | TTFT mean | TTFT max | ok | timeout | err |
|---|---|---|---|---|---|---|---|---|---|---|---|---|---|---|
| 1 | 60.0 | 10,404 | 0 | 10,404 | 173 | 173 | 173.7 | 173.7 | 100% | 108ms | 108ms | 0 | 1 | 0 |
| 2 | 60.0 | 17,603 | 0 | 17,603 | 293 | 293 | 222.6 | 223.1 | 169% | 108ms | 111ms | 0 | 2 | 0 |
| 3 | 60.0 | 19,106 | 0 | 19,106 | 318 | 318 | 2,947.5 | *2,959.4 | 184% | 11.0s | 11.0s | 0 | 3 | 0 |
| 4 | 60.0 | 23,185 | 0 | 23,185 | 386 | 386 | 201.0 | 201.8 | 223% | 10.8s | 10.8s | 0 | 4 | 0 |
| 5 | 60.0 | 23,088 | 0 | 23,088 | 385 | 385 | 2,756.1 | *2,756.7 | 223% | 12.9s | 13.0s | 0 | 5 | 0 |
| 6 | 60.0 | 25,347 | 0 | 25,347 | 422 | 422 | 2,503.8 | *2,504.2 | 244% | 14.6s | 14.6s | 0 | 6 | 0 |
| 7 | 60.0 | 23,636 | 0 | 23,636 | 394 | 394 | 1,205.5 | *1,205.5 | 228% | 16.1s | 16.1s | 0 | 7 | 0 |
| 8 | 60.0 | 25,334 | 0 | 25,334 | 422 | 422 | 498.2 | 499.4 | 244% | 13.7s | 13.8s | 0 | 8 | 0 |
| 9 | 60.0 | 29,086 | 0 | 29,086 | 484 | 484 | 73.0 | 73.7 | 280% | 15.4s | 15.4s | 0 | 9 | 0 |
| 10 | 60.1 | 32,245 | 0 | 32,245 | 537 | 537 | 58.2 | 65.5 | 310% | 427ms | 457ms | 1 | 9 | 0 |
| 11 | 60.0 | 31,875 | 0 | 31,875 | 531 | 531 | 53.7 | 60.8 | 307% | 729ms | 748ms | 1 | 10 | 0 |
| 12 | 60.0 | 31,067 | 0 | 31,067 | 517 | 517 | 48.6 | 57.5 | 299% | 523ms | 567ms | 4 | 8 | 0 |
| 13 | 60.1 | 30,341 | 0 | 30,341 | 505 | 505 | 45.2 | 55.1 | 292% | 711ms | 761ms | 2 | 11 | 0 |
| 14 | 60.1 | 31,634 | 0 | 31,634 | 527 | 527 | 45.6 | 55.2 | 305% | 794ms | 891ms | 4 | 10 | 0 |
| 15 | 60.0 | 31,487 | 0 | 31,487 | 524 | 524 | 40.1 | 48.0 | 303% | 1.3s | 1.4s | 4 | 11 | 0 |
| 16 | 60.0 | 34,284 | 0 | 34,284 | 571 | 571 | 46.1 | 57.1 | 330% | 675ms | 725ms | 5 | 11 | 0 |
| 17 | 60.0 | 31,246 | 0 | 31,246 | 520 | 520 | 39.0 | 48.2 | 301% | 3.2s | 3.2s | 5 | 12 | 0 |
| 18 | 60.1 | 33,595 | 0 | 33,595 | 559 | 559 | 40.0 | 46.5 | 323% | 2.3s | 2.4s | 7 | 11 | 0 |
| 19 | 60.1 | 32,812 | 0 | 32,812 | 546 | 546 | 34.7 | 43.3 | 316% | 1.6s | 1.8s | 5 | 14 | 0 |
| 20 peak | 60.1 | 34,622 | 0 | 34,622 | 577 | 577 | 38.4 | 46.1 | 334% | 626ms | 716ms | 7 | 13 | 0 |
| 21 | 60.1 | 34,535 | 0 | 34,535 | 575 | 575 | 34.6 | 42.4 | 332% | 3.5s | 3.6s | 6 | 15 | 0 |
| 22 | 60.1 | 30,720 | 0 | 30,720 | 511 | 511 | 29.1 | 37.2 | 295% | 432ms | 631ms | 5 | 17 | 0 |
| 23 | 60.1 | 33,437 | 0 | 33,437 | 557 | 557 | 30.9 | 39.1 | 322% | 1.9s | 2.0s | 7 | 16 | 0 |
| 24 | 60.1 | 33,615 | 0 | 33,615 | 560 | 560 | 29.6 | 37.1 | 324% | 1.2s | 1.5s | 8 | 16 | 0 |
* burst artifact — agents queued ~11–16s then generated in a short burst; the per-agent timer inflates the number. Trust combined throughput and TTFT columns. Peak row = highest combined (all-token) throughput.
Charts
Raw data & downloads
- report.md5 KB
- sweep-summary.csv2 KB
- sweep-summary.json11 KB
- combined_throughput.png124 KB · original matplotlib export
- combined_vs_per_agent.png108 KB · original matplotlib export
- dashboard_1_24.png180 KB · original matplotlib export
- outcome_breakdown.png57 KB · original matplotlib export
- per_agent_throughput.png121 KB · original matplotlib export
- scaling_efficiency.png83 KB · original matplotlib export
- time_to_first_token.png67 KB · original matplotlib export
- total_tokens_generated.png73 KB · original matplotlib export