Granite 4.1 3B
server model id:
granite-4.1-3bnon-thinkingKV Q4_0ctx 32k3B params
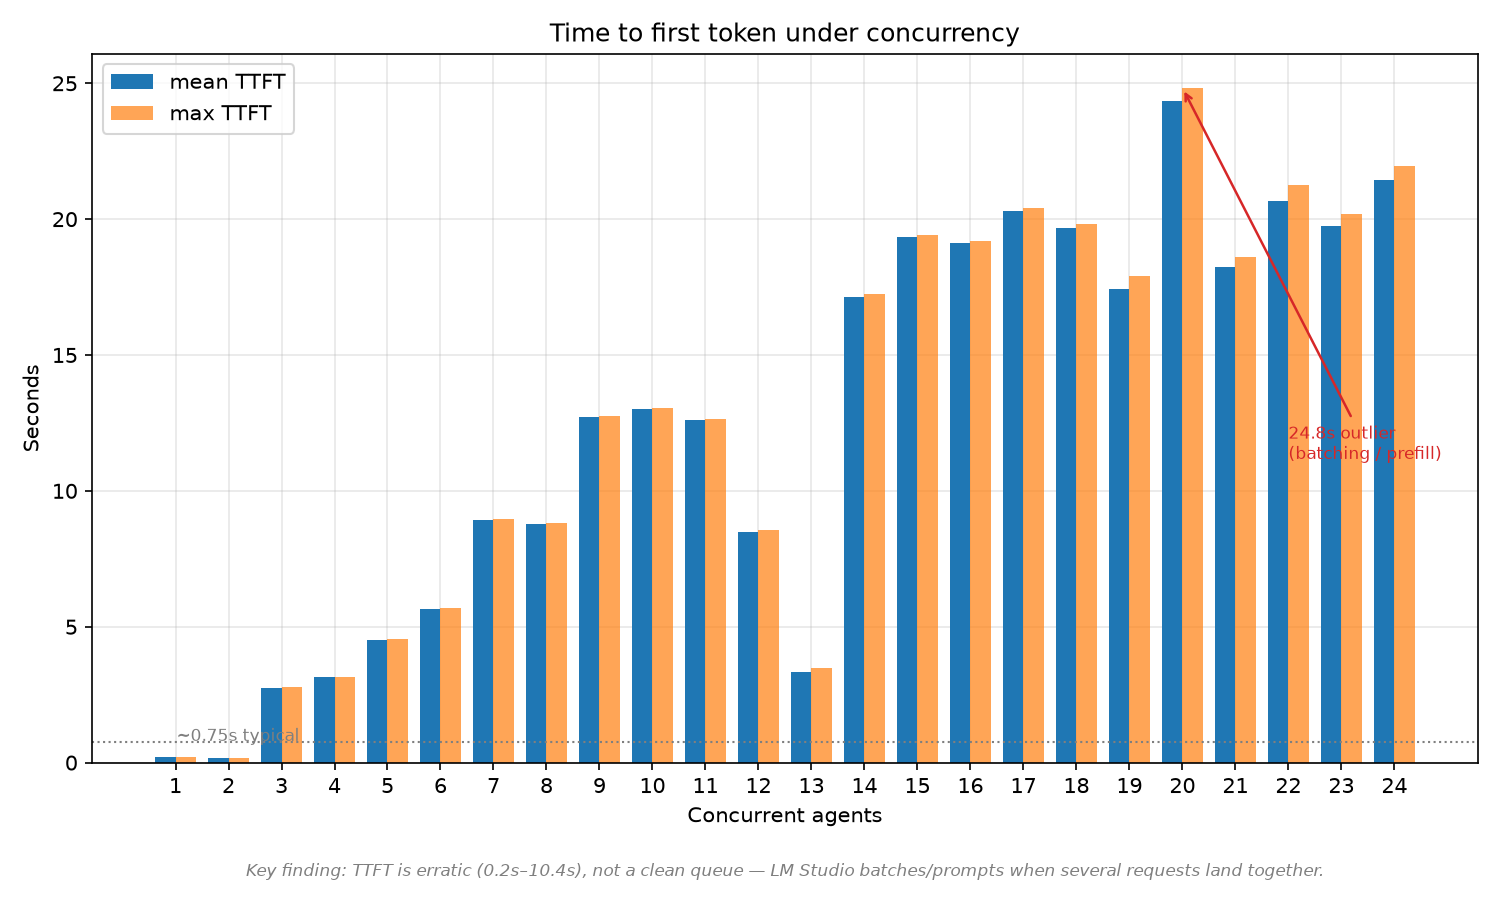
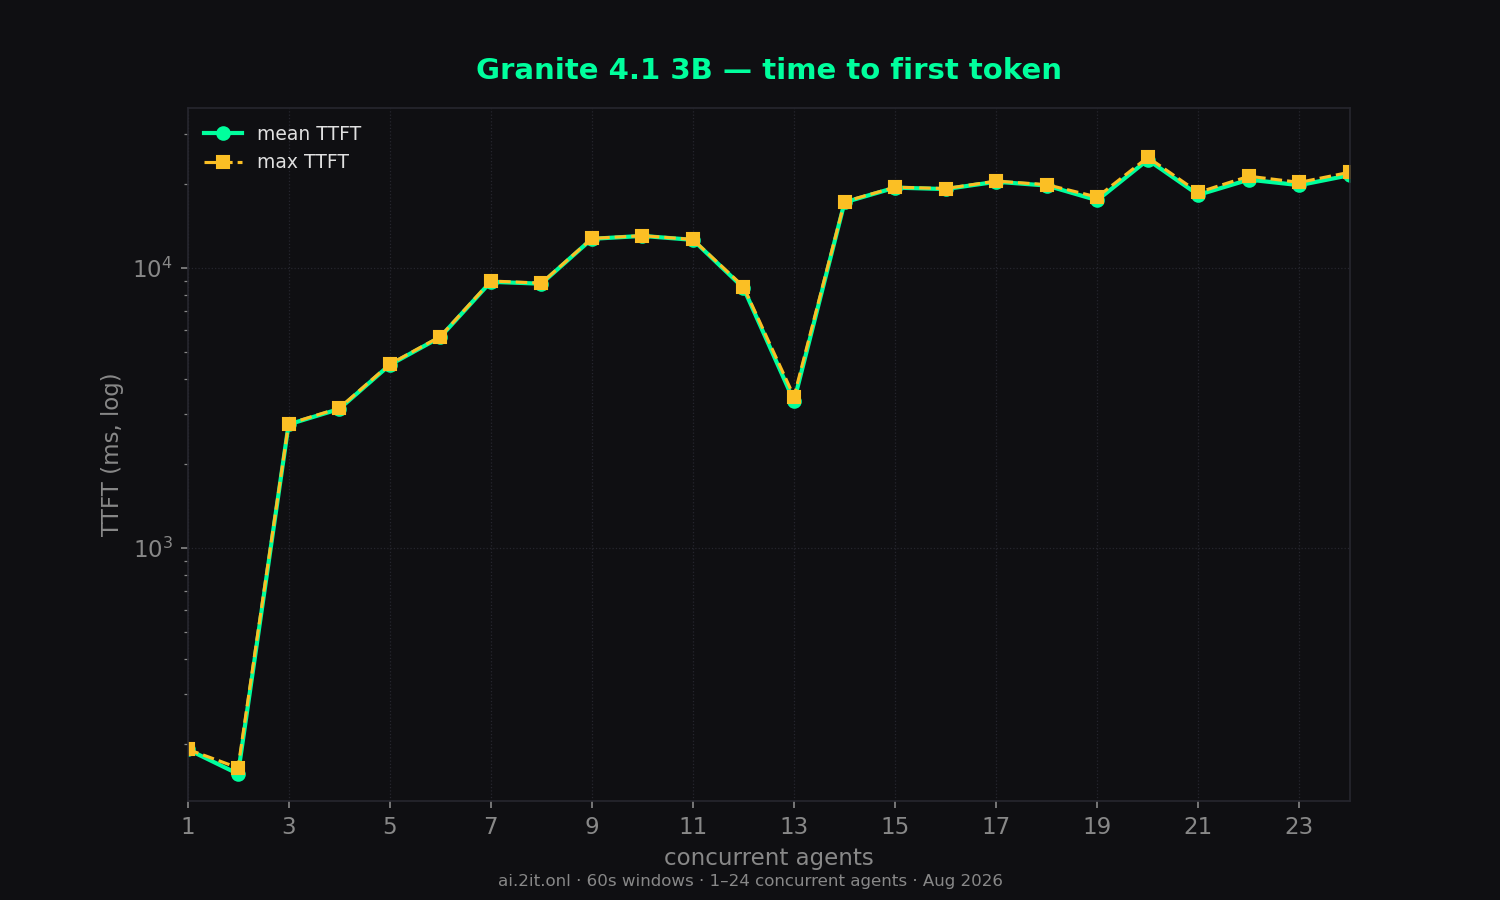
Slowest solo of all (79 tok/s) and the noisiest scaling curve, but TTFT is the real weak point — 20–24s at 20+ agents.
Key findings
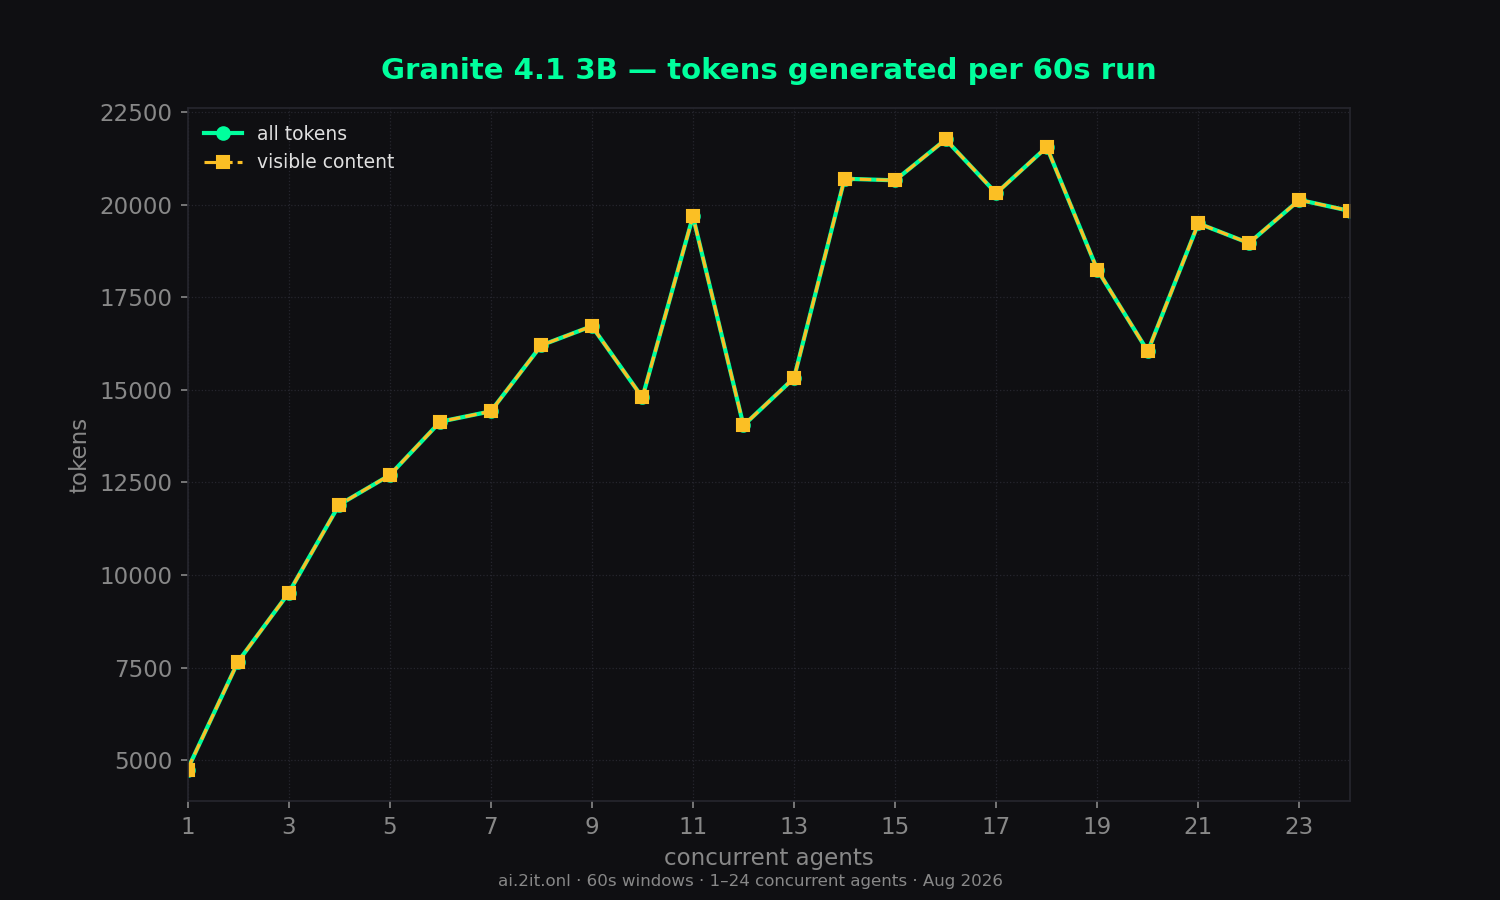
- Clean, all-content output: 0 reasoning tokens everywhere.
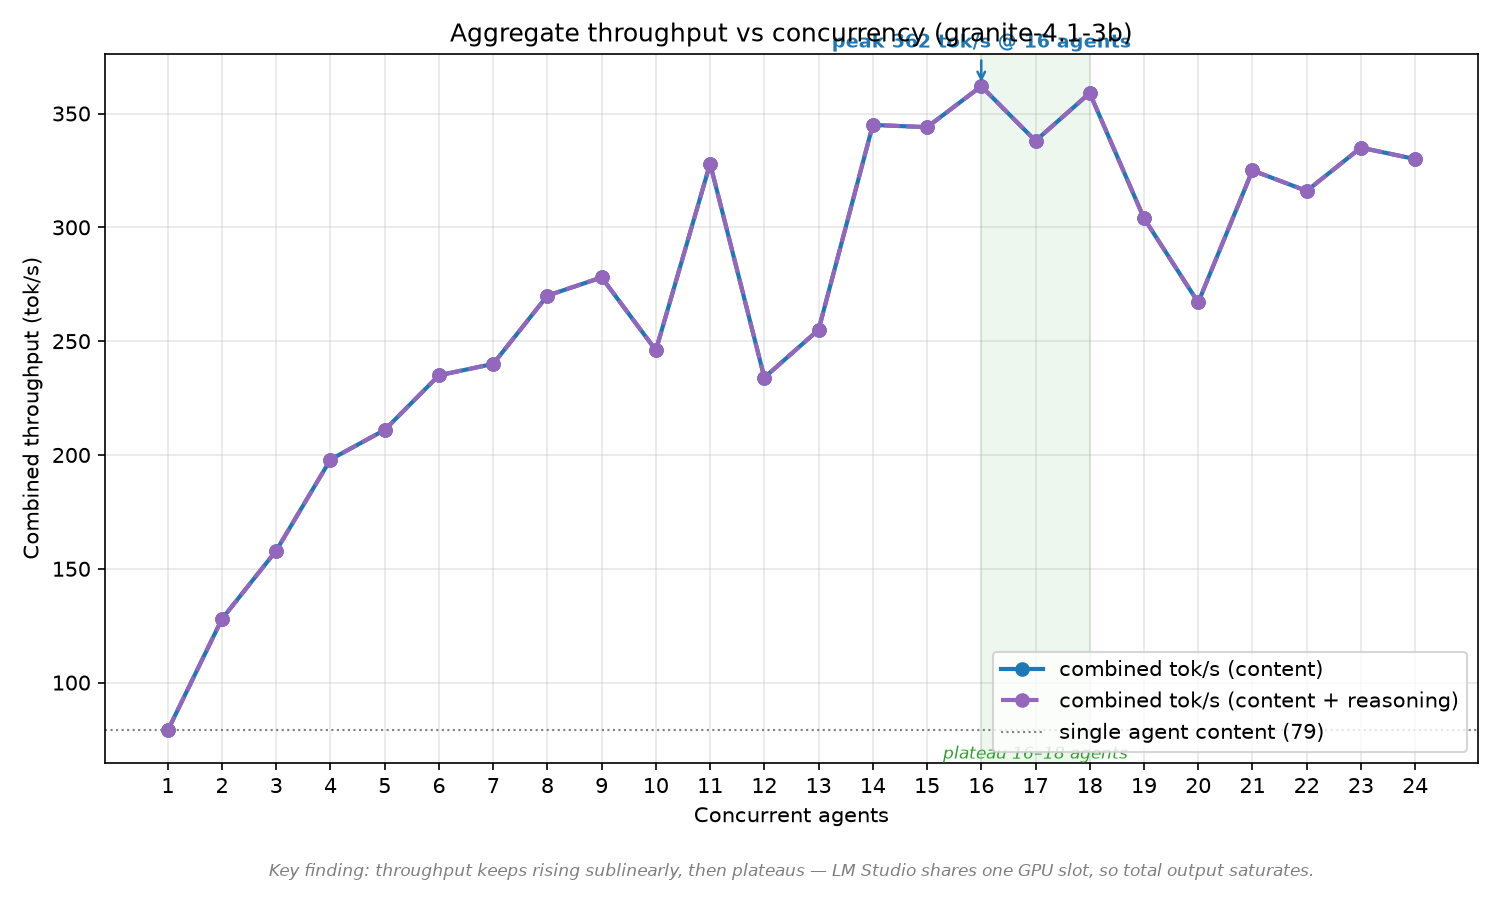
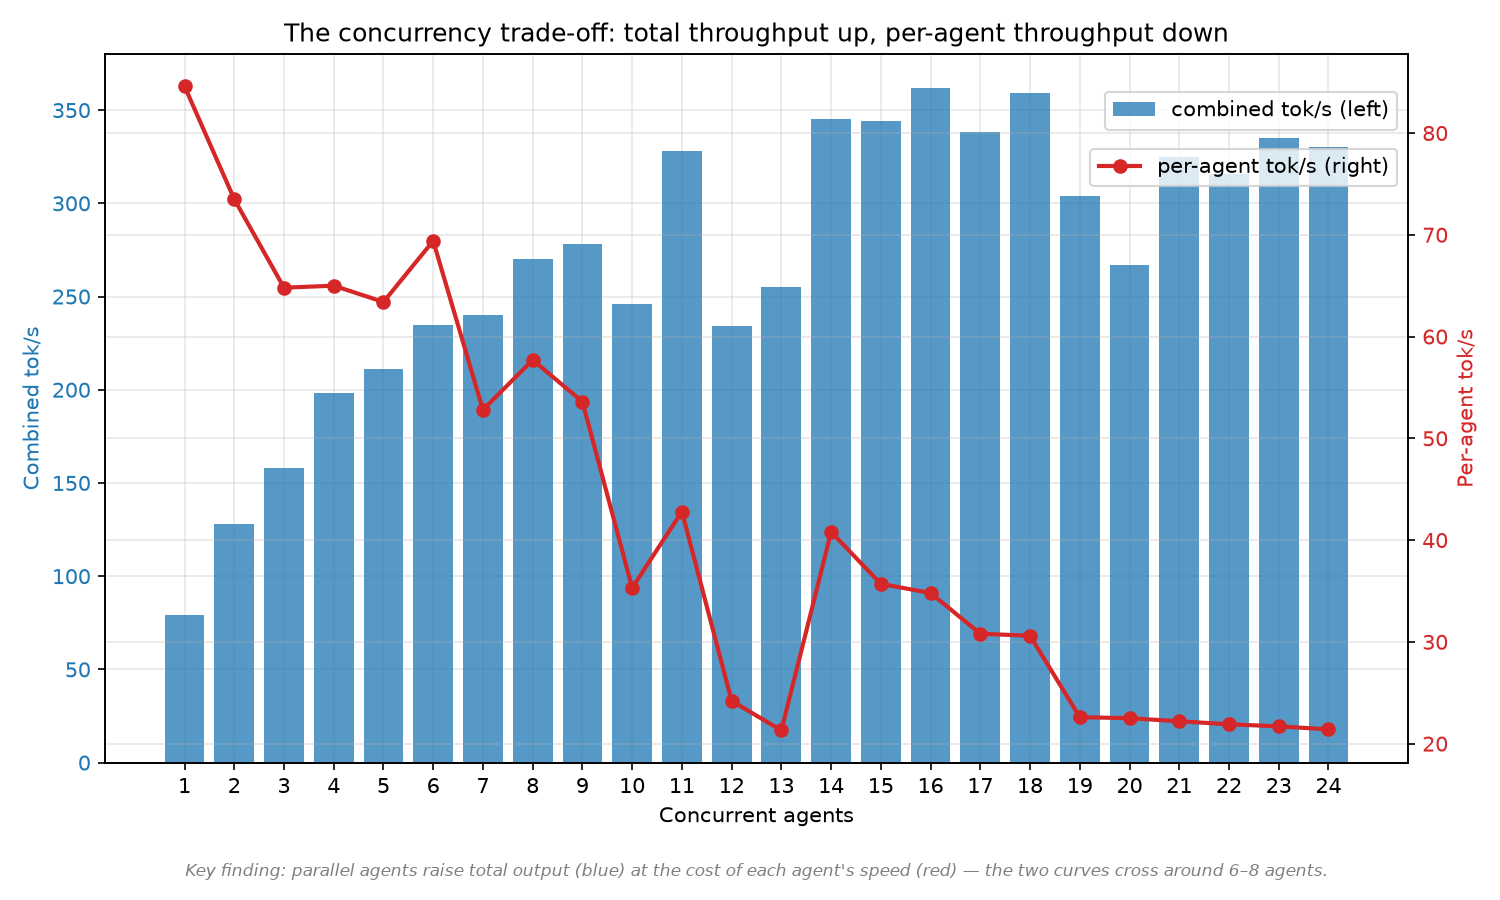
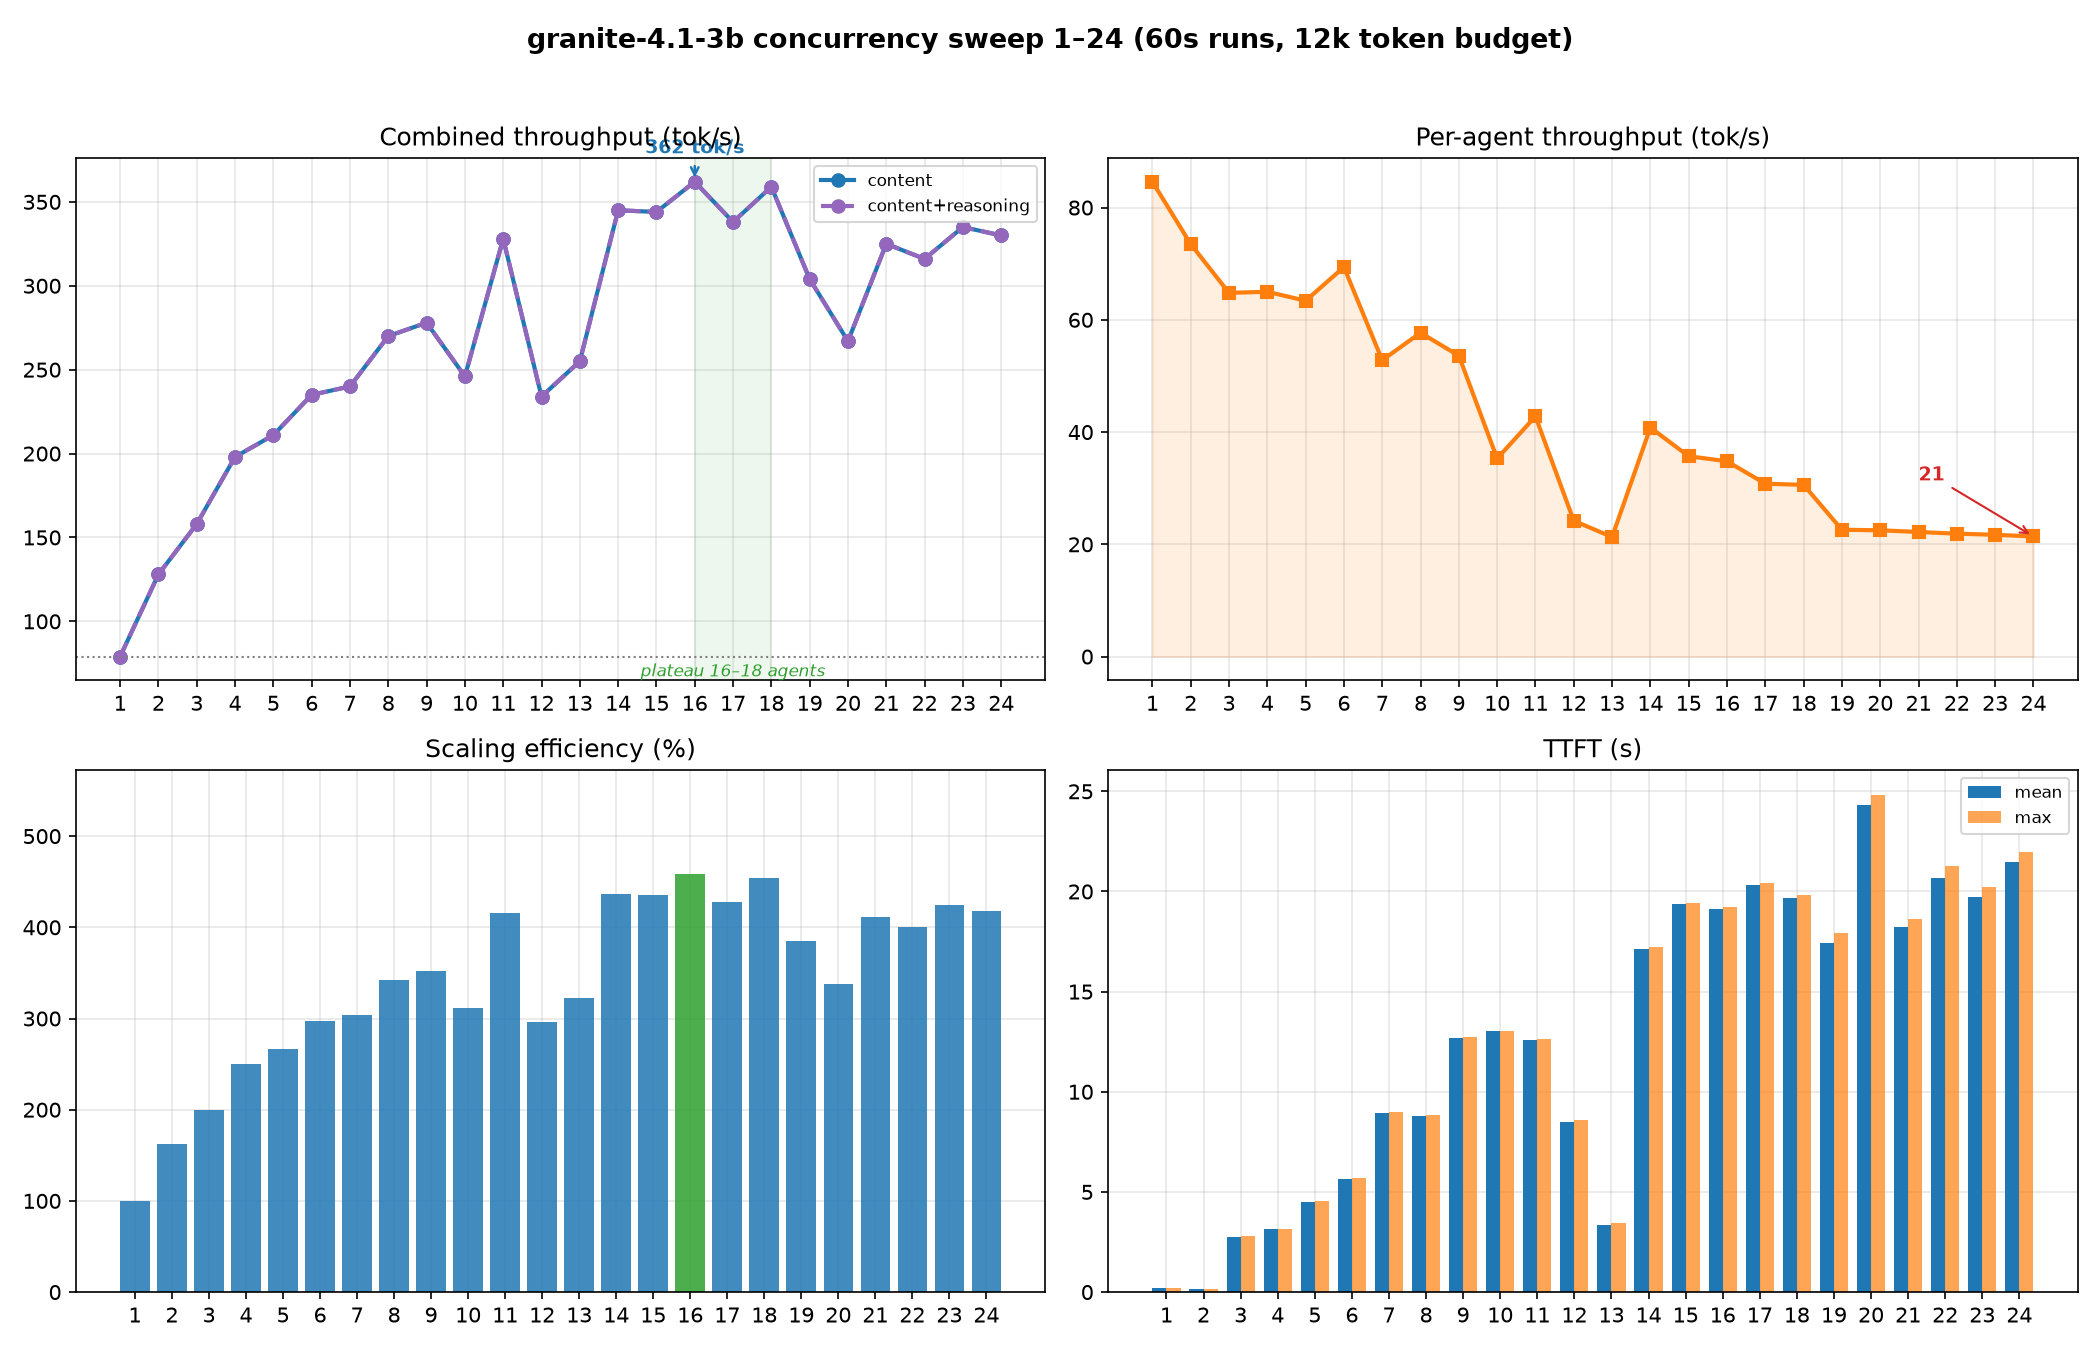
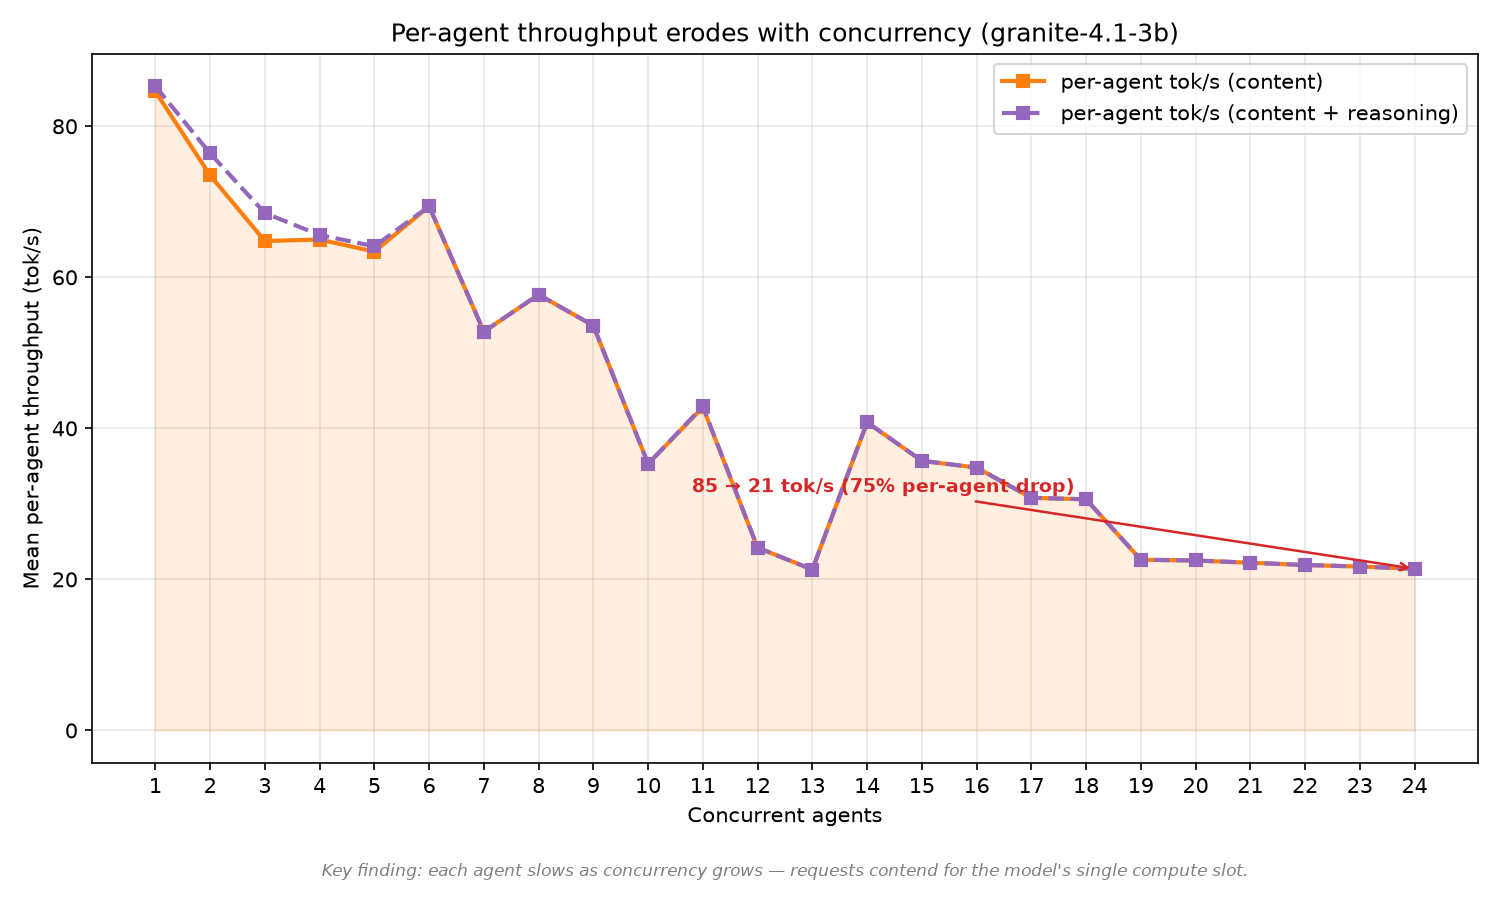
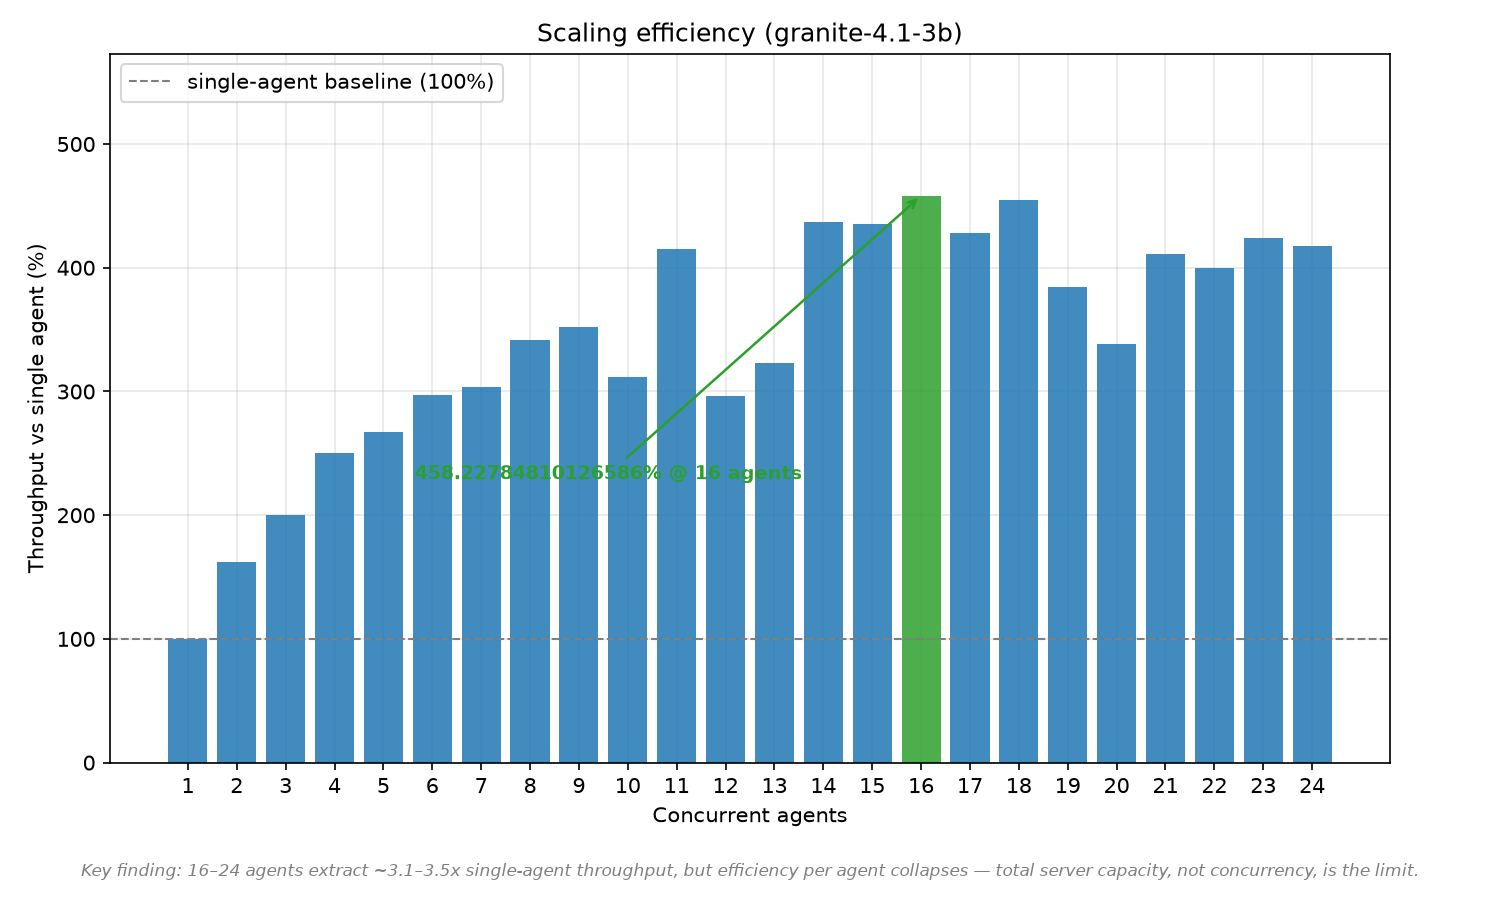
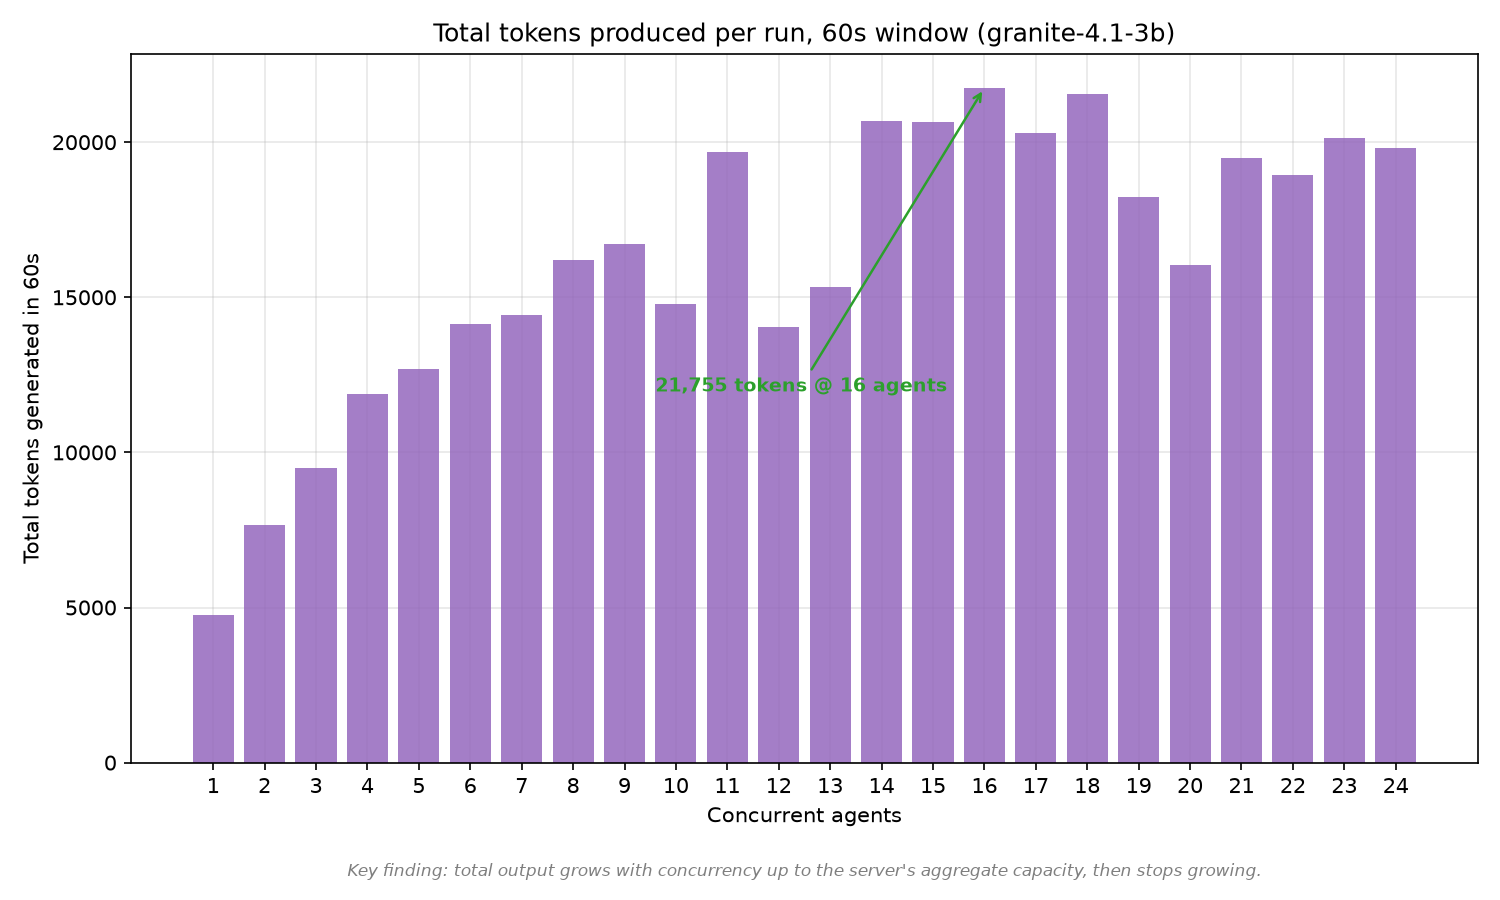
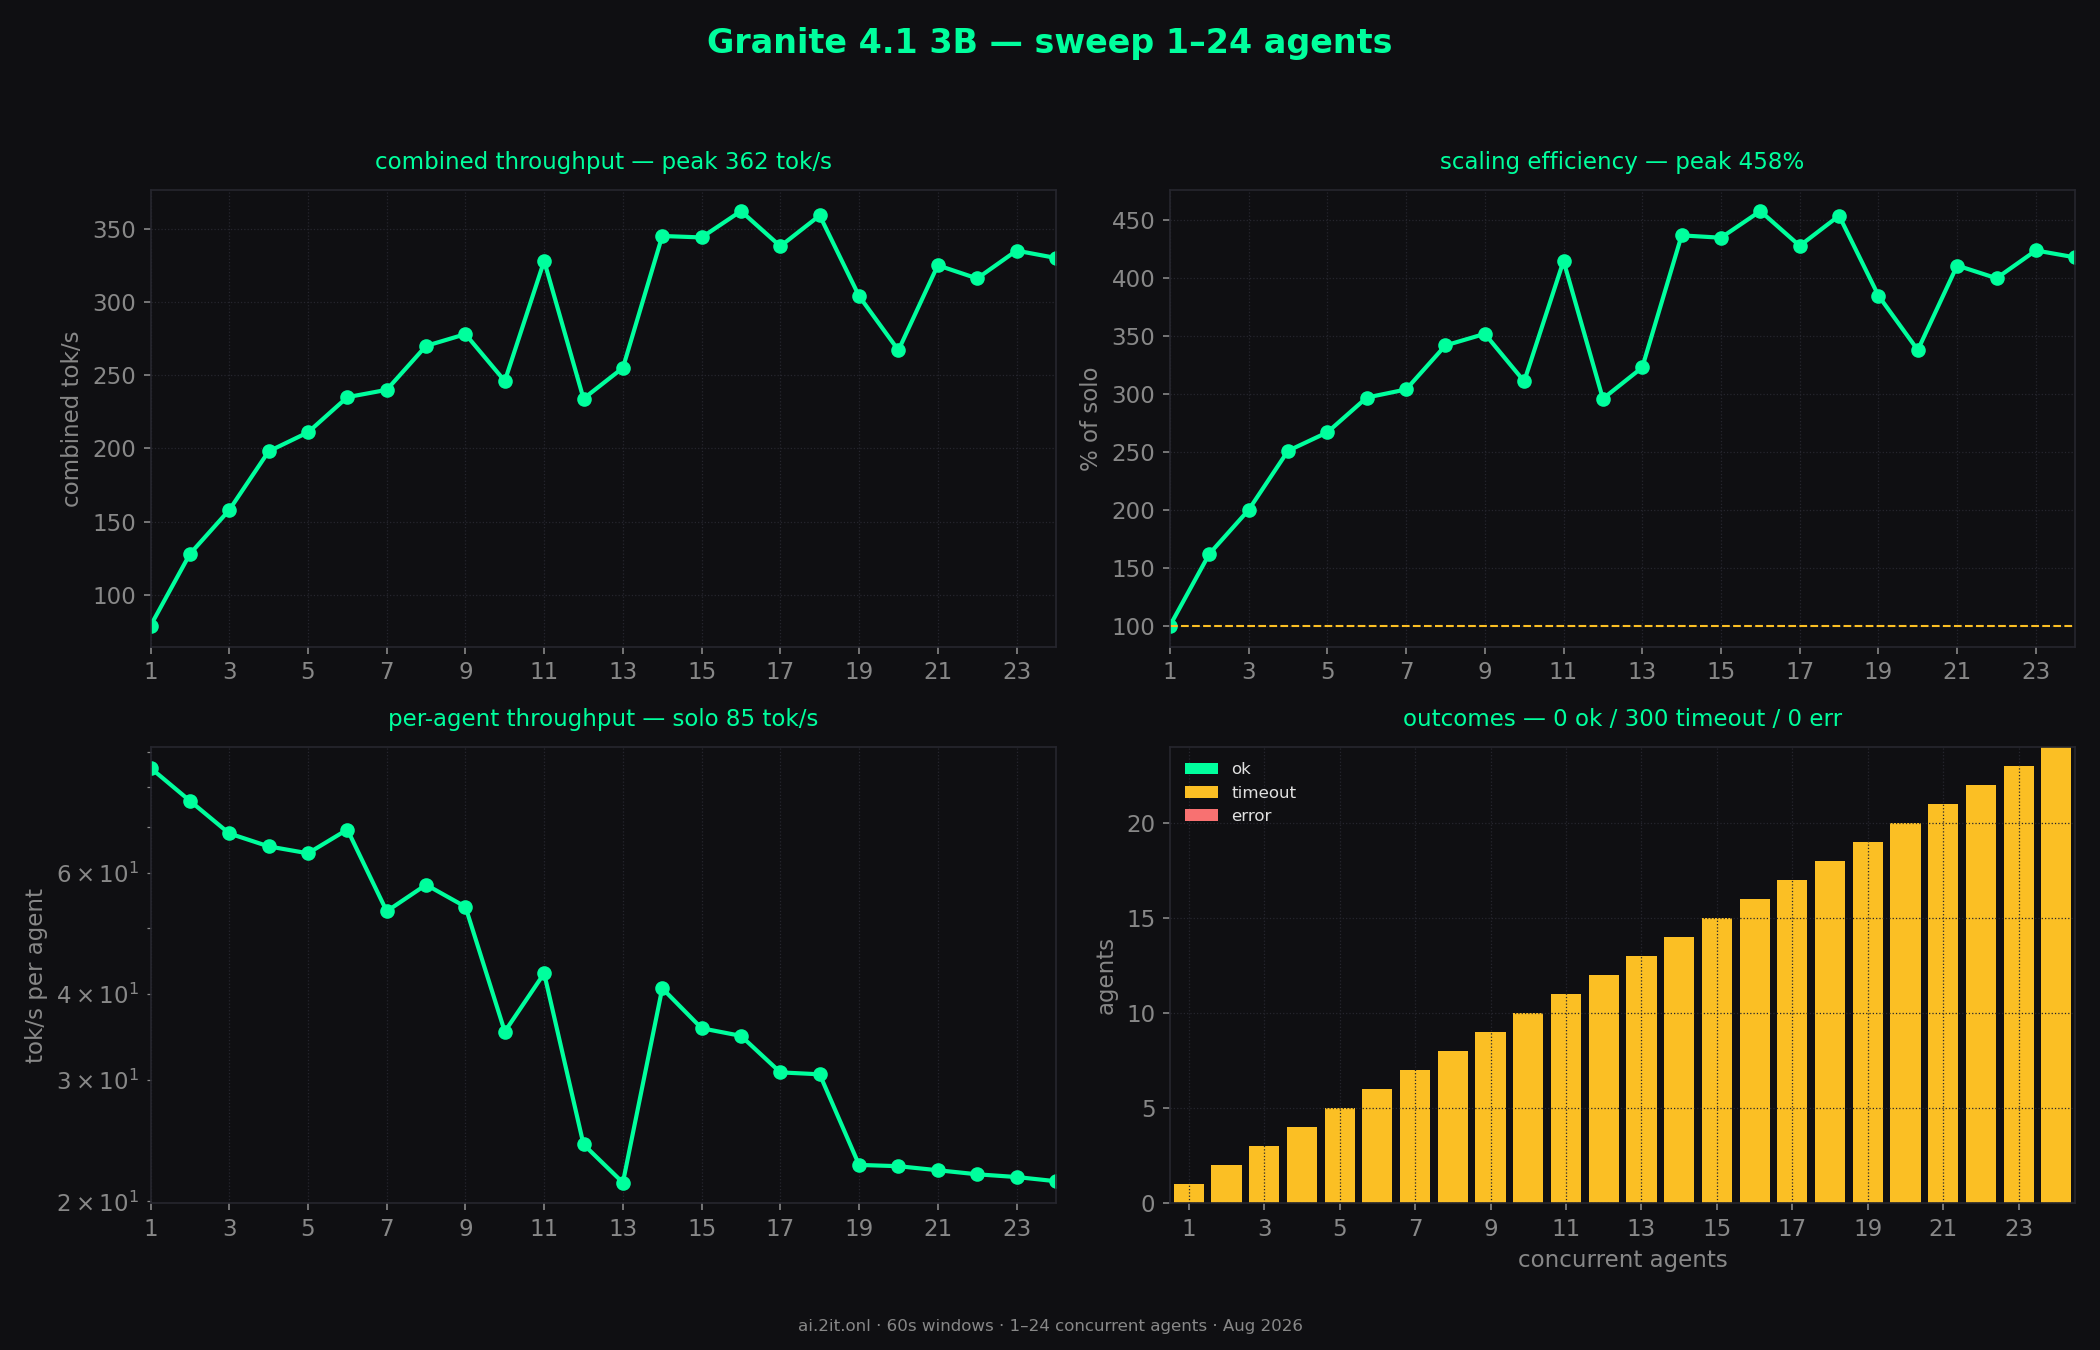
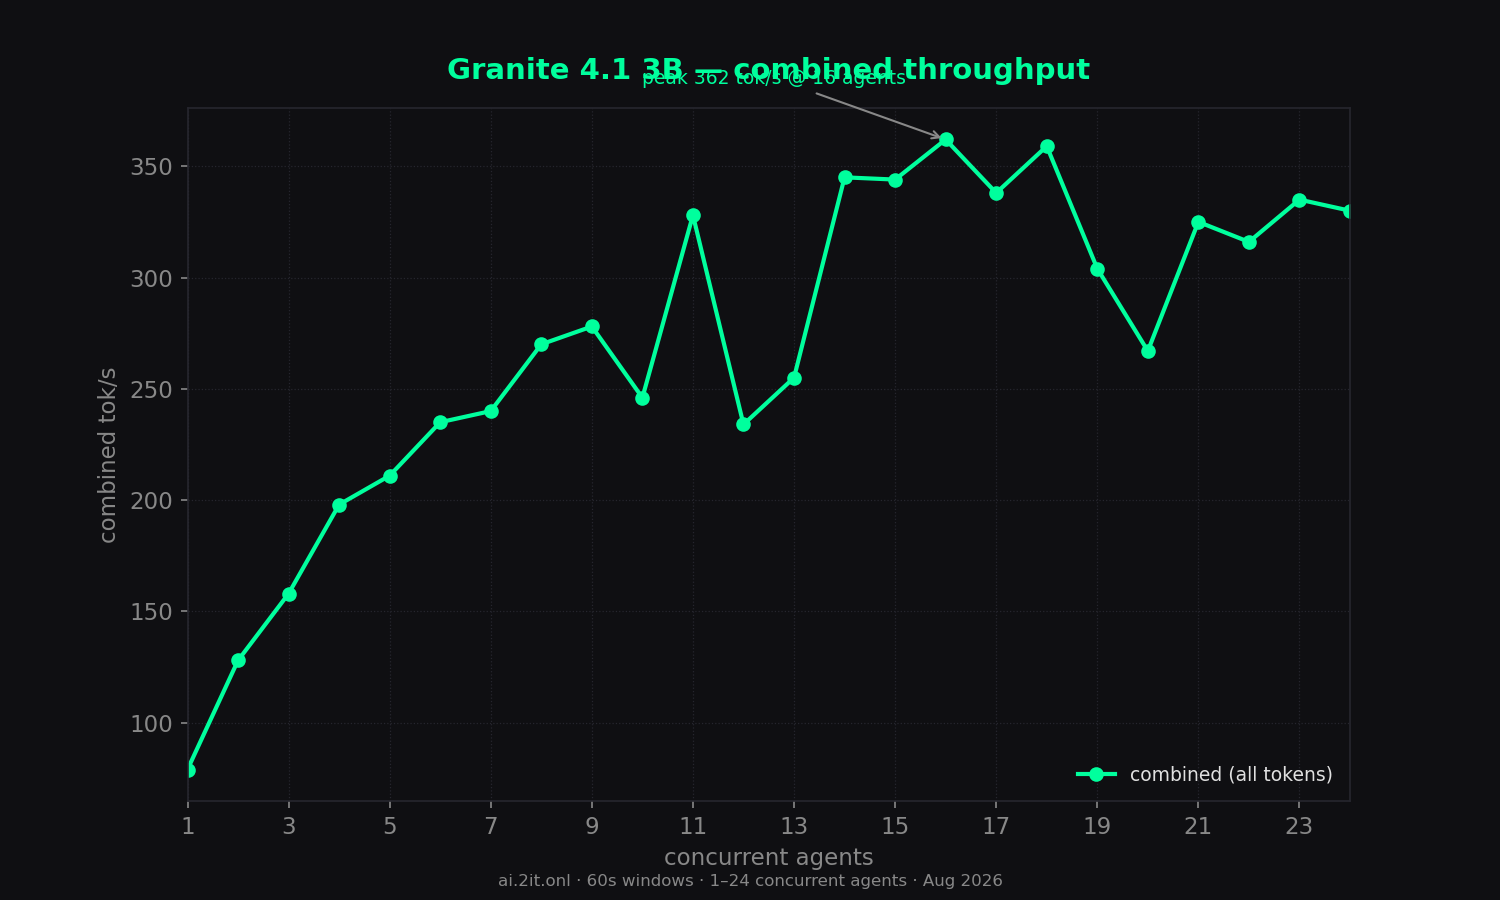
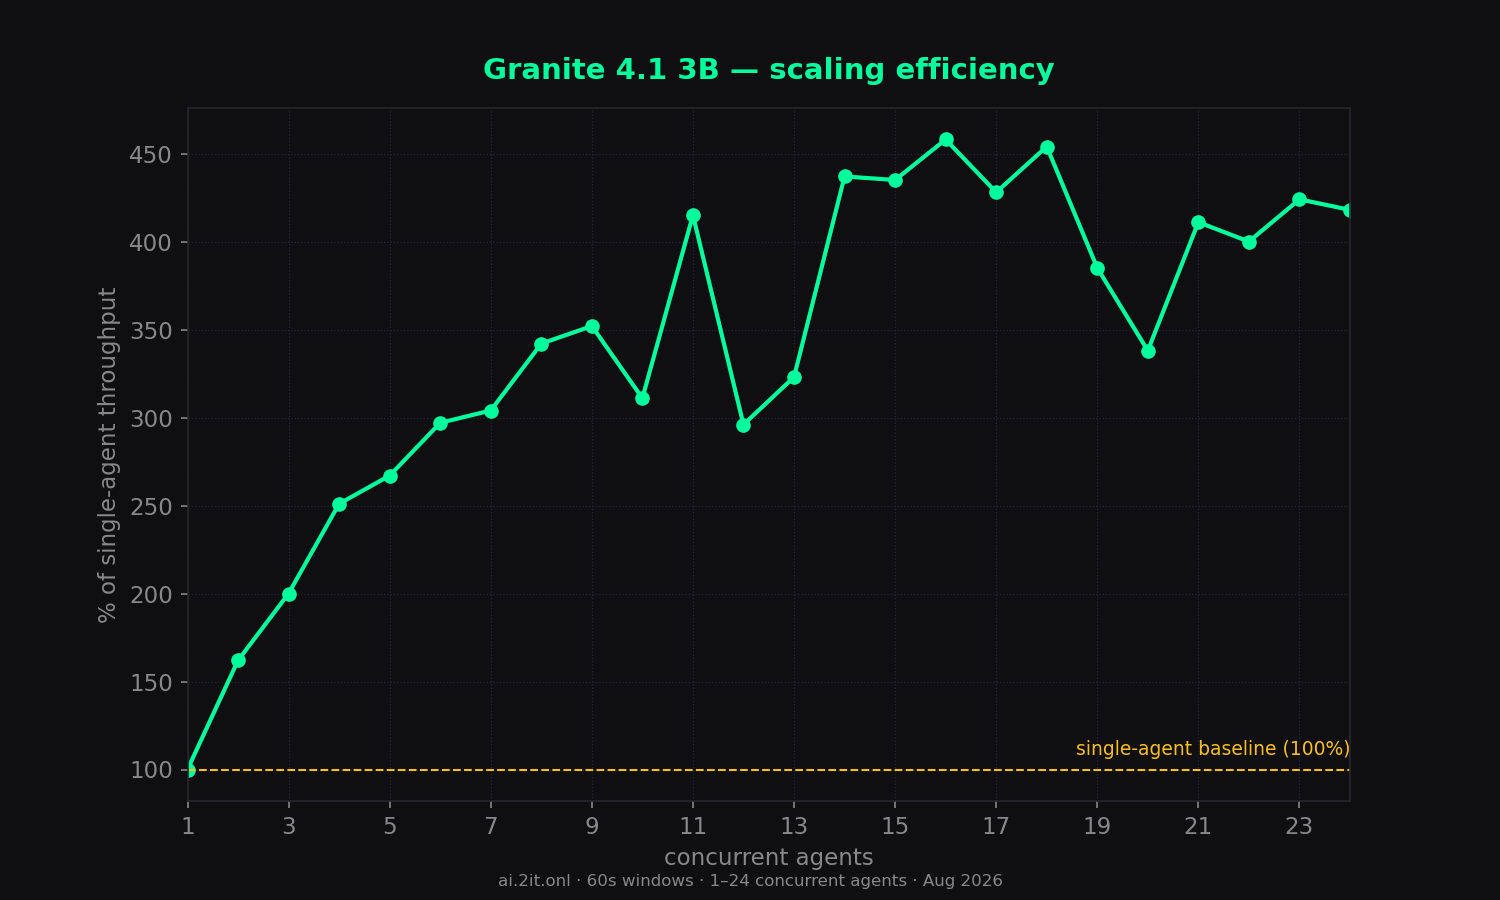
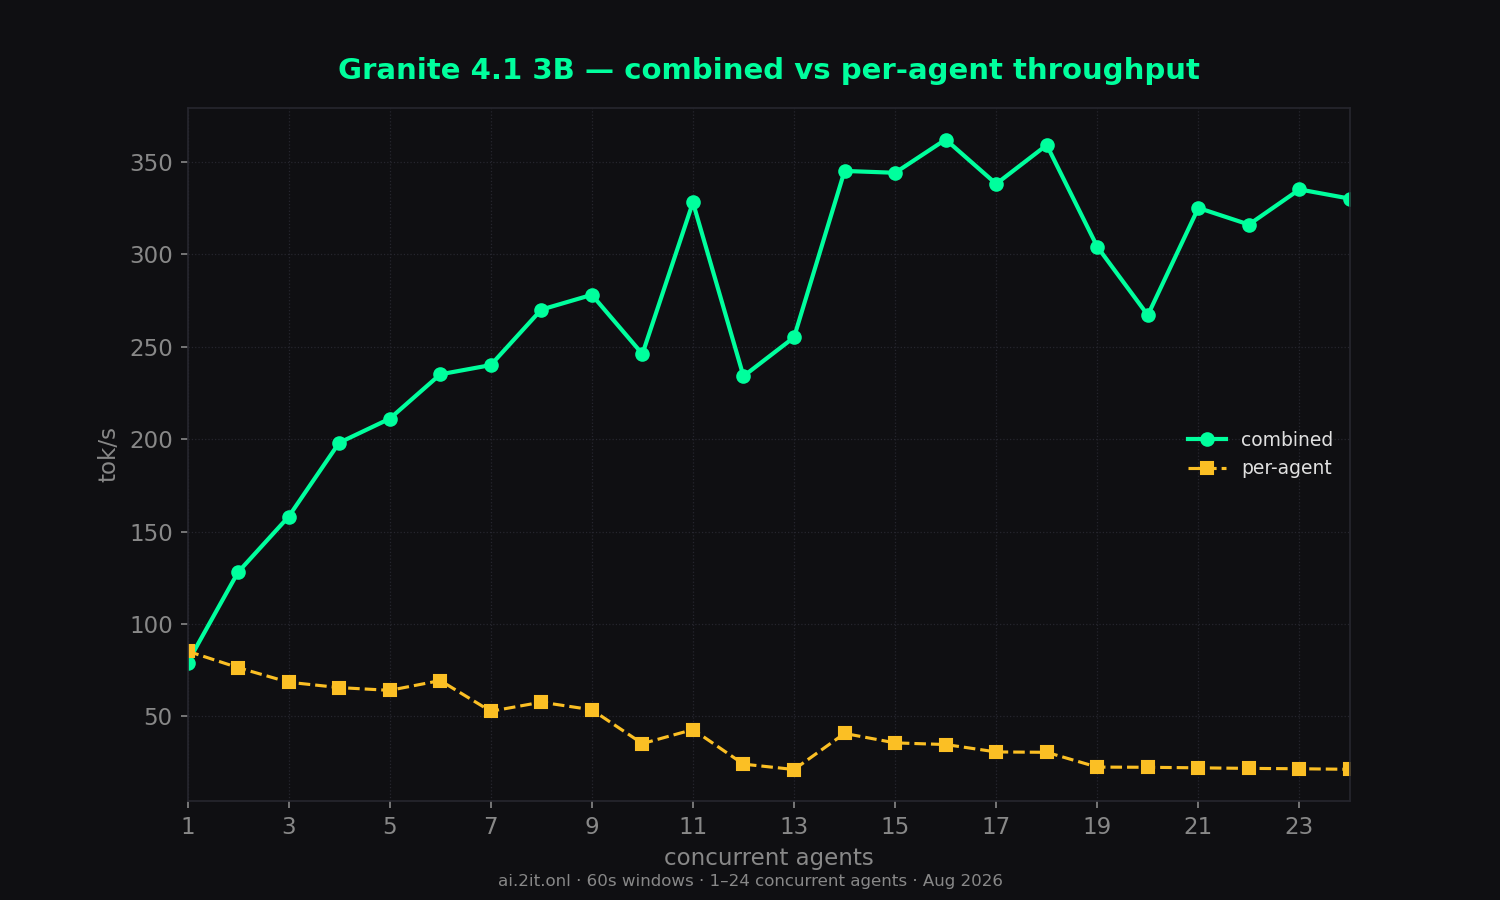
- Slowest solo of all models tested: only 79 tok/s at 1 agent (even slower than chronos's 88). Combined peaks at 362 tok/s at 16 agents (4.6x) but the curve is noisy/erratic — dips at 10 (246), 12 (234), 19–20 (304/267) amid the climb. Granite shows the least consistent scaling of the non-thinking models.
- TTFT climbs the hardest: 191ms solo rising to ~20–24s at 20+ agents, with the worst values of the clean models.
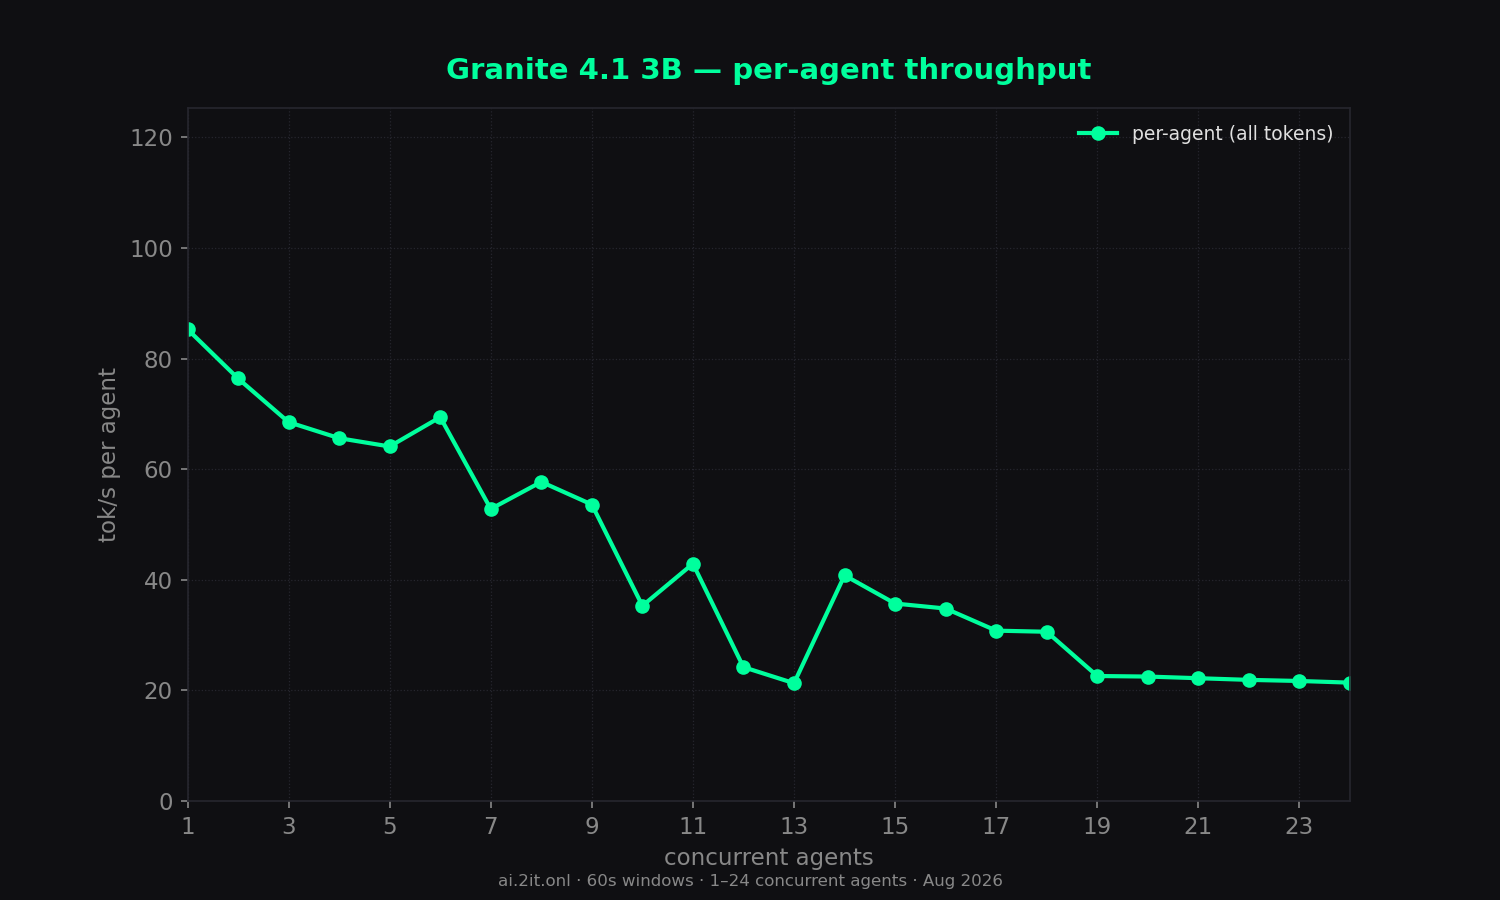
- Per-agent speed: ~21–22 tok/s at 24 agents (vs 85 solo).
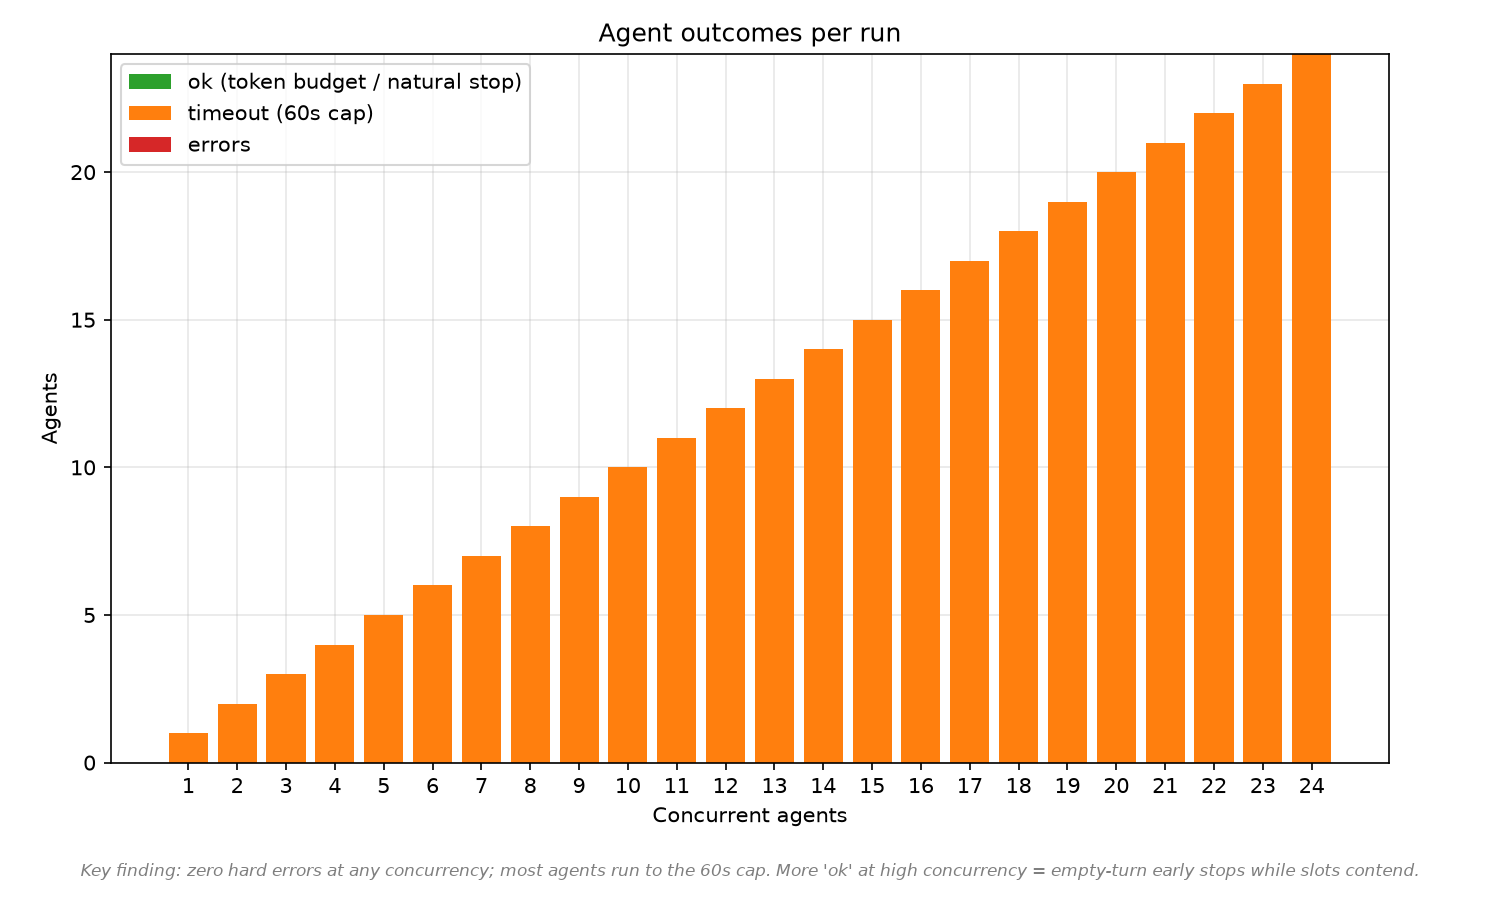
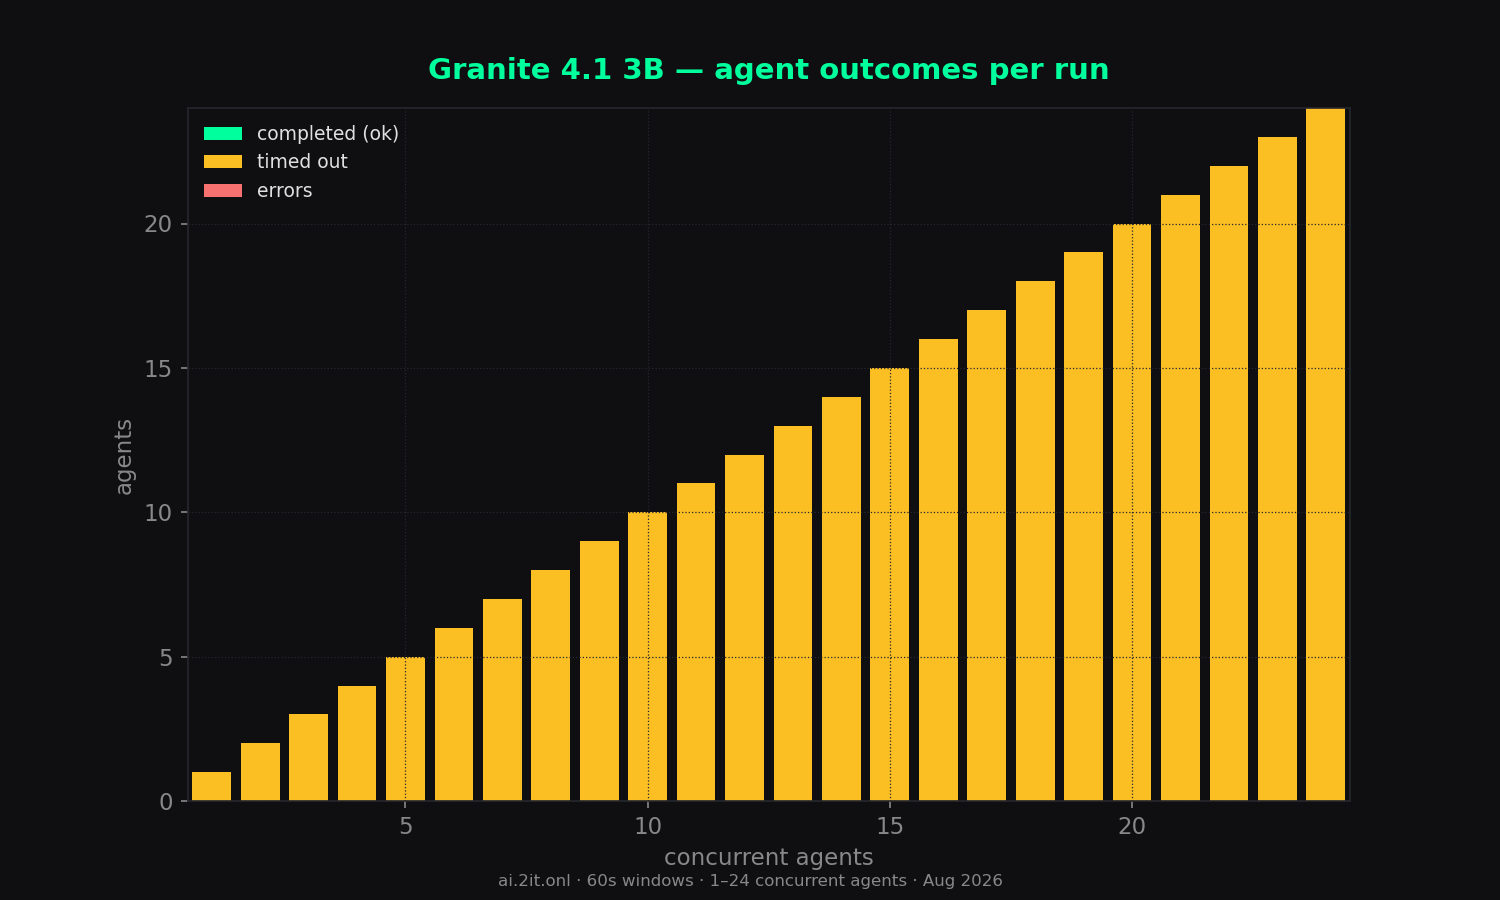
- Errors: 0 across all 24 runs.
Sweep — total concurrency 1–24
| agents | wall (s) | content | reason | total | comb tok/s | comb all | per-agent | per-agent all | scale % | TTFT mean | TTFT max | ok | timeout | err |
|---|---|---|---|---|---|---|---|---|---|---|---|---|---|---|
| 1 | 60.0 | 4,749 | 0 | 4,749 | 79 | 79 | 84.6 | 85.3 | 100% | 191ms | 191ms | 0 | 1 | 0 |
| 2 | 60.0 | 7,660 | 0 | 7,660 | 128 | 128 | 73.5 | 76.4 | 162% | 156ms | 164ms | 0 | 2 | 0 |
| 3 | 60.1 | 9,511 | 0 | 9,511 | 158 | 158 | 64.8 | 68.5 | 200% | 2.8s | 2.8s | 0 | 3 | 0 |
| 4 | 60.0 | 11,894 | 0 | 11,894 | 198 | 198 | 65.0 | 65.6 | 251% | 3.1s | 3.2s | 0 | 4 | 0 |
| 5 | 60.0 | 12,693 | 0 | 12,693 | 211 | 211 | 63.4 | 64.1 | 267% | 4.5s | 4.5s | 0 | 5 | 0 |
| 6 | 60.0 | 14,137 | 0 | 14,137 | 235 | 235 | 69.4 | 69.4 | 297% | 5.7s | 5.7s | 0 | 6 | 0 |
| 7 | 60.0 | 14,417 | 0 | 14,417 | 240 | 240 | 52.8 | 52.8 | 304% | 8.9s | 9.0s | 0 | 7 | 0 |
| 8 | 60.0 | 16,199 | 0 | 16,199 | 270 | 270 | 57.7 | 57.7 | 342% | 8.8s | 8.8s | 0 | 8 | 0 |
| 9 | 60.0 | 16,717 | 0 | 16,717 | 278 | 278 | 53.6 | 53.6 | 352% | 12.7s | 12.7s | 0 | 9 | 0 |
| 10 | 60.0 | 14,791 | 0 | 14,791 | 246 | 246 | 35.3 | 35.3 | 311% | 13.0s | 13.0s | 0 | 10 | 0 |
| 11 | 60.0 | 19,682 | 0 | 19,682 | 328 | 328 | 42.8 | 42.9 | 415% | 12.6s | 12.6s | 0 | 11 | 0 |
| 12 | 60.0 | 14,036 | 0 | 14,036 | 234 | 234 | 24.2 | 24.2 | 296% | 8.5s | 8.6s | 0 | 12 | 0 |
| 13 | 60.0 | 15,316 | 0 | 15,316 | 255 | 255 | 21.3 | 21.3 | 323% | 3.3s | 3.5s | 0 | 13 | 0 |
| 14 | 60.0 | 20,696 | 0 | 20,696 | 345 | 345 | 40.8 | 40.8 | 437% | 17.2s | 17.2s | 0 | 14 | 0 |
| 15 | 60.0 | 20,653 | 0 | 20,653 | 344 | 344 | 35.7 | 35.7 | 435% | 19.4s | 19.4s | 0 | 15 | 0 |
| 16 peak | 60.0 | 21,755 | 0 | 21,755 | 362 | 362 | 34.8 | 34.8 | 458% | 19.1s | 19.2s | 0 | 16 | 0 |
| 17 | 60.0 | 20,303 | 0 | 20,303 | 338 | 338 | 30.8 | 30.8 | 428% | 20.3s | 20.4s | 0 | 17 | 0 |
| 18 | 60.0 | 21,551 | 0 | 21,551 | 359 | 359 | 30.6 | 30.6 | 454% | 19.7s | 19.8s | 0 | 18 | 0 |
| 19 | 60.0 | 18,241 | 0 | 18,241 | 304 | 304 | 22.6 | 22.6 | 385% | 17.4s | 17.9s | 0 | 19 | 0 |
| 20 | 60.0 | 16,037 | 0 | 16,037 | 267 | 267 | 22.5 | 22.5 | 338% | 24.3s | 24.8s | 0 | 20 | 0 |
| 21 | 60.0 | 19,491 | 0 | 19,491 | 325 | 325 | 22.2 | 22.2 | 411% | 18.2s | 18.6s | 0 | 21 | 0 |
| 22 | 60.0 | 18,958 | 0 | 18,958 | 316 | 316 | 21.9 | 21.9 | 400% | 20.7s | 21.3s | 0 | 22 | 0 |
| 23 | 60.0 | 20,125 | 0 | 20,125 | 335 | 335 | 21.7 | 21.7 | 424% | 19.7s | 20.2s | 0 | 23 | 0 |
| 24 | 60.0 | 19,826 | 0 | 19,826 | 330 | 330 | 21.4 | 21.4 | 418% | 21.5s | 22.0s | 0 | 24 | 0 |
* burst artifact — agents queued ~11–16s then generated in a short burst; the per-agent timer inflates the number. Trust combined throughput and TTFT columns. Peak row = highest combined (all-token) throughput.
Charts
Raw data & downloads
- report.md5 KB
- sweep-summary.csv2 KB
- sweep-summary.json11 KB
- combined_throughput.png129 KB · original matplotlib export
- combined_vs_per_agent.png110 KB · original matplotlib export
- dashboard_1_24.png174 KB · original matplotlib export
- outcome_breakdown.png57 KB · original matplotlib export
- per_agent_throughput.png109 KB · original matplotlib export
- scaling_efficiency.png77 KB · original matplotlib export
- time_to_first_token.png66 KB · original matplotlib export
- total_tokens_generated.png67 KB · original matplotlib export