Qwen3 4B
server model id:
qwen3-4bthinkingKV Q4_0ctx 32k4B params
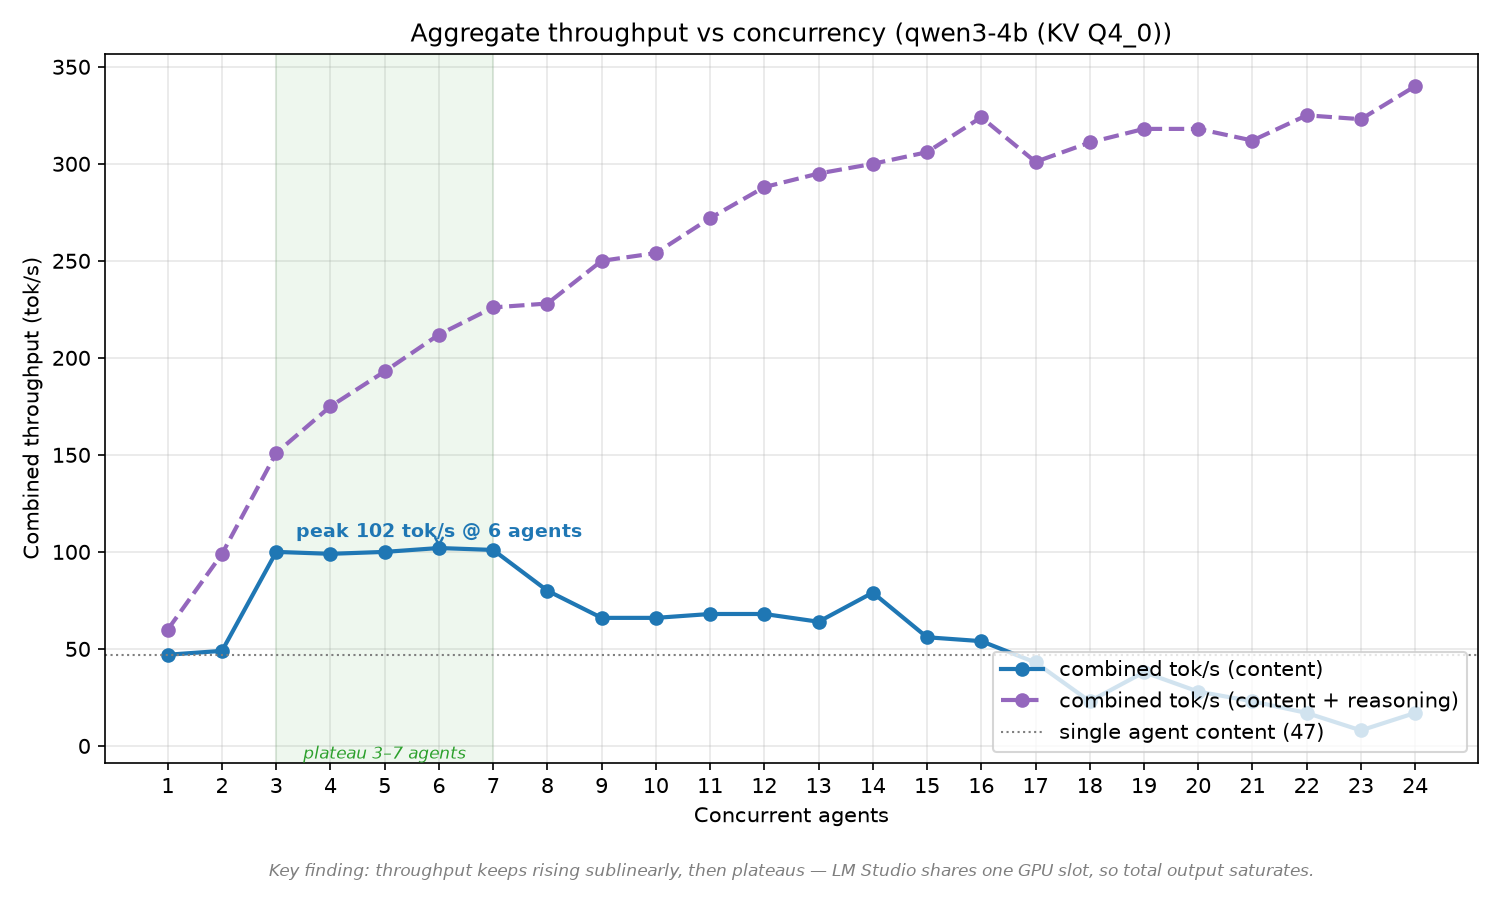
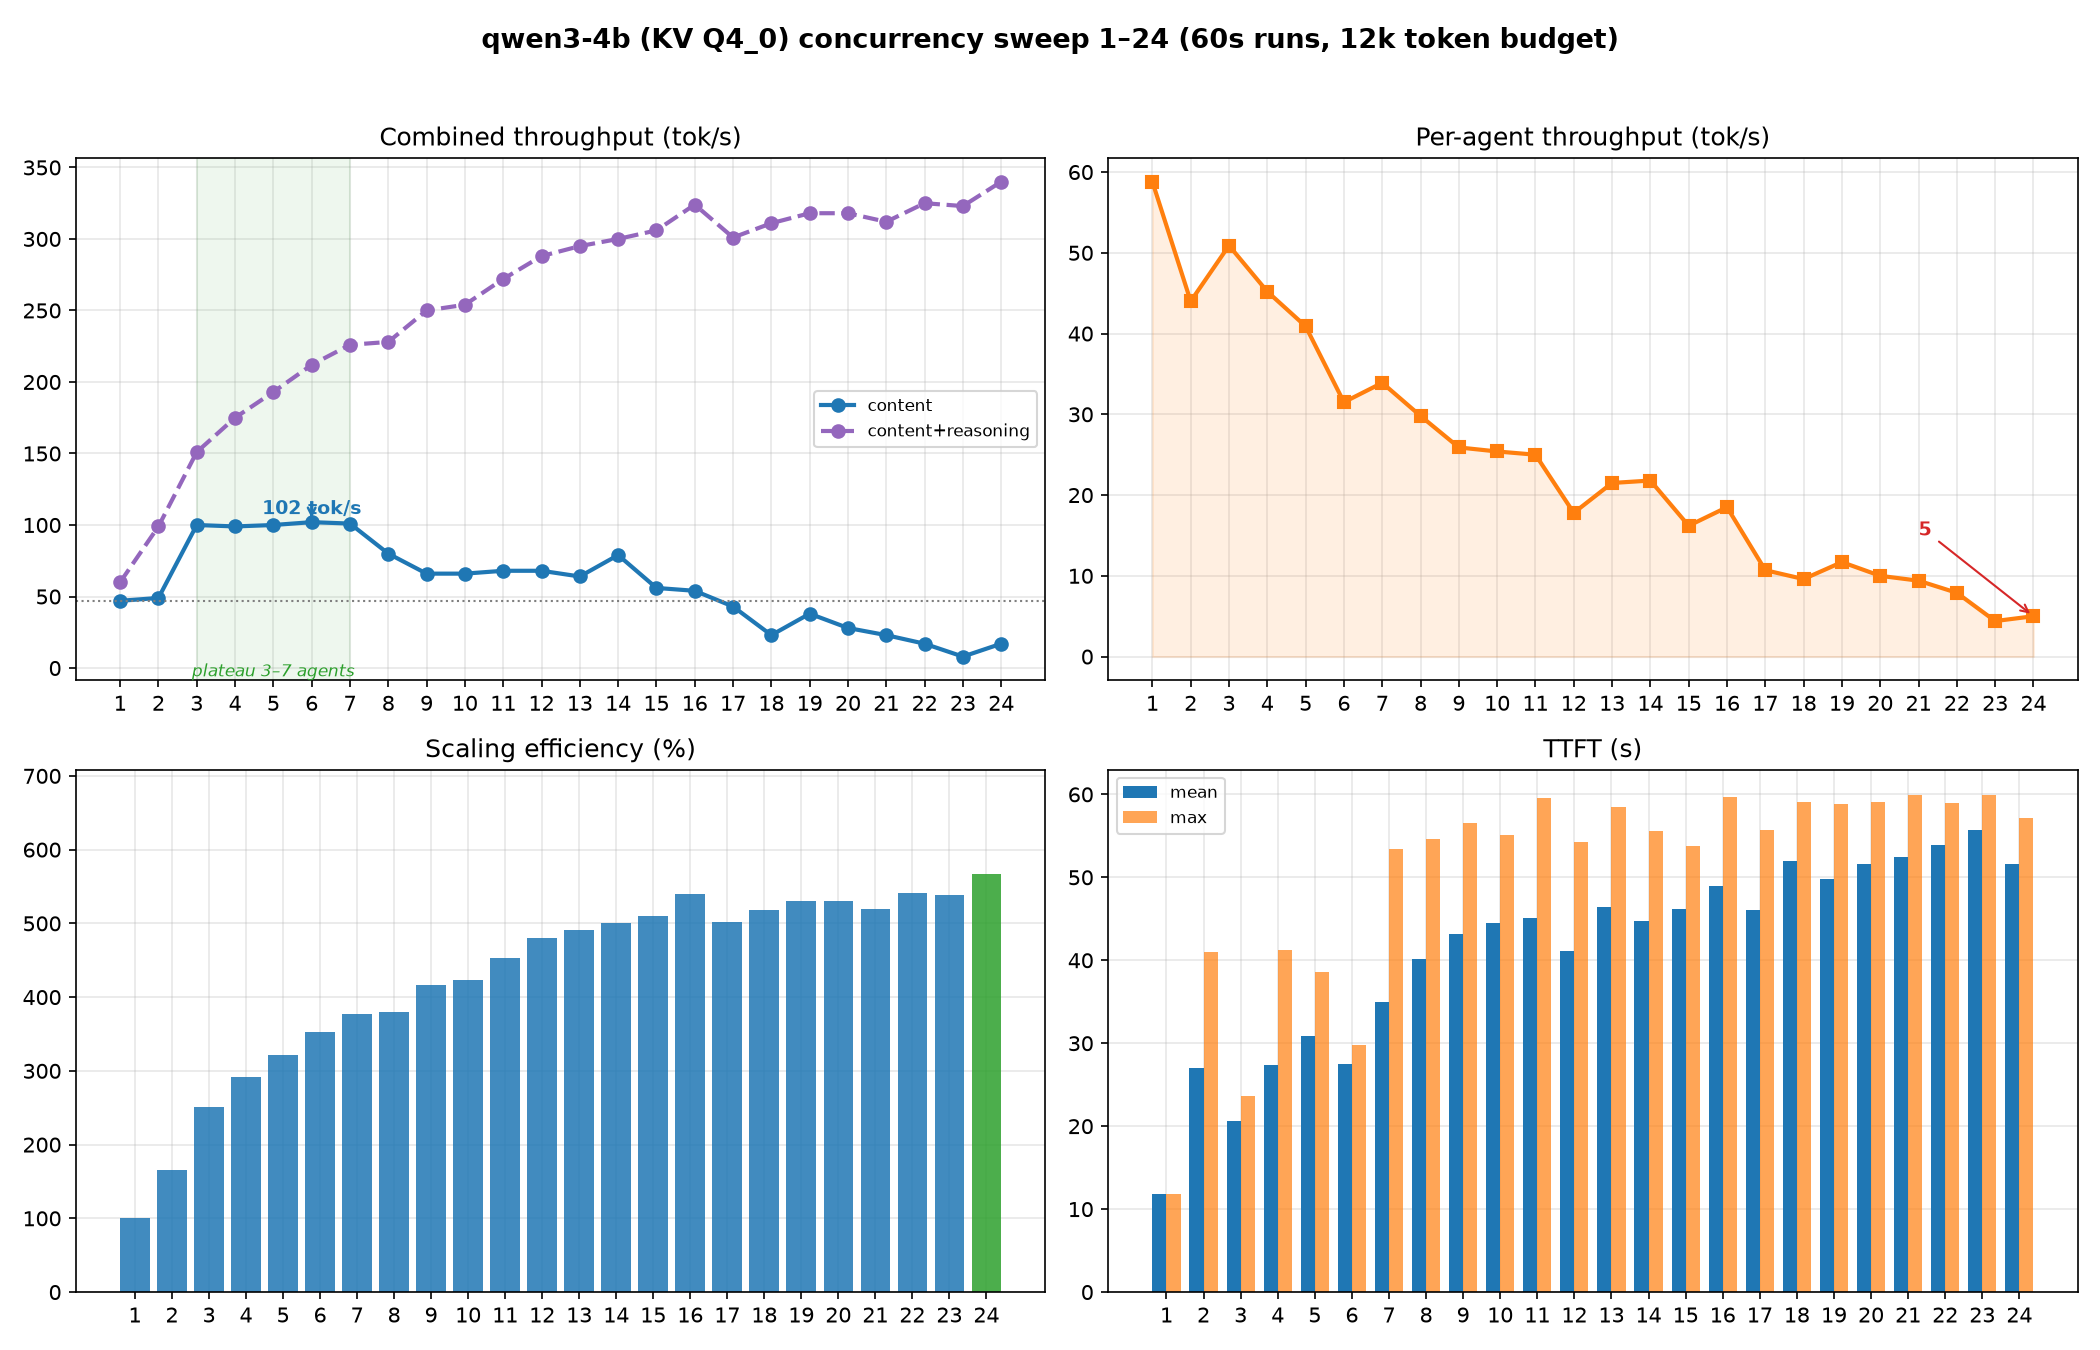
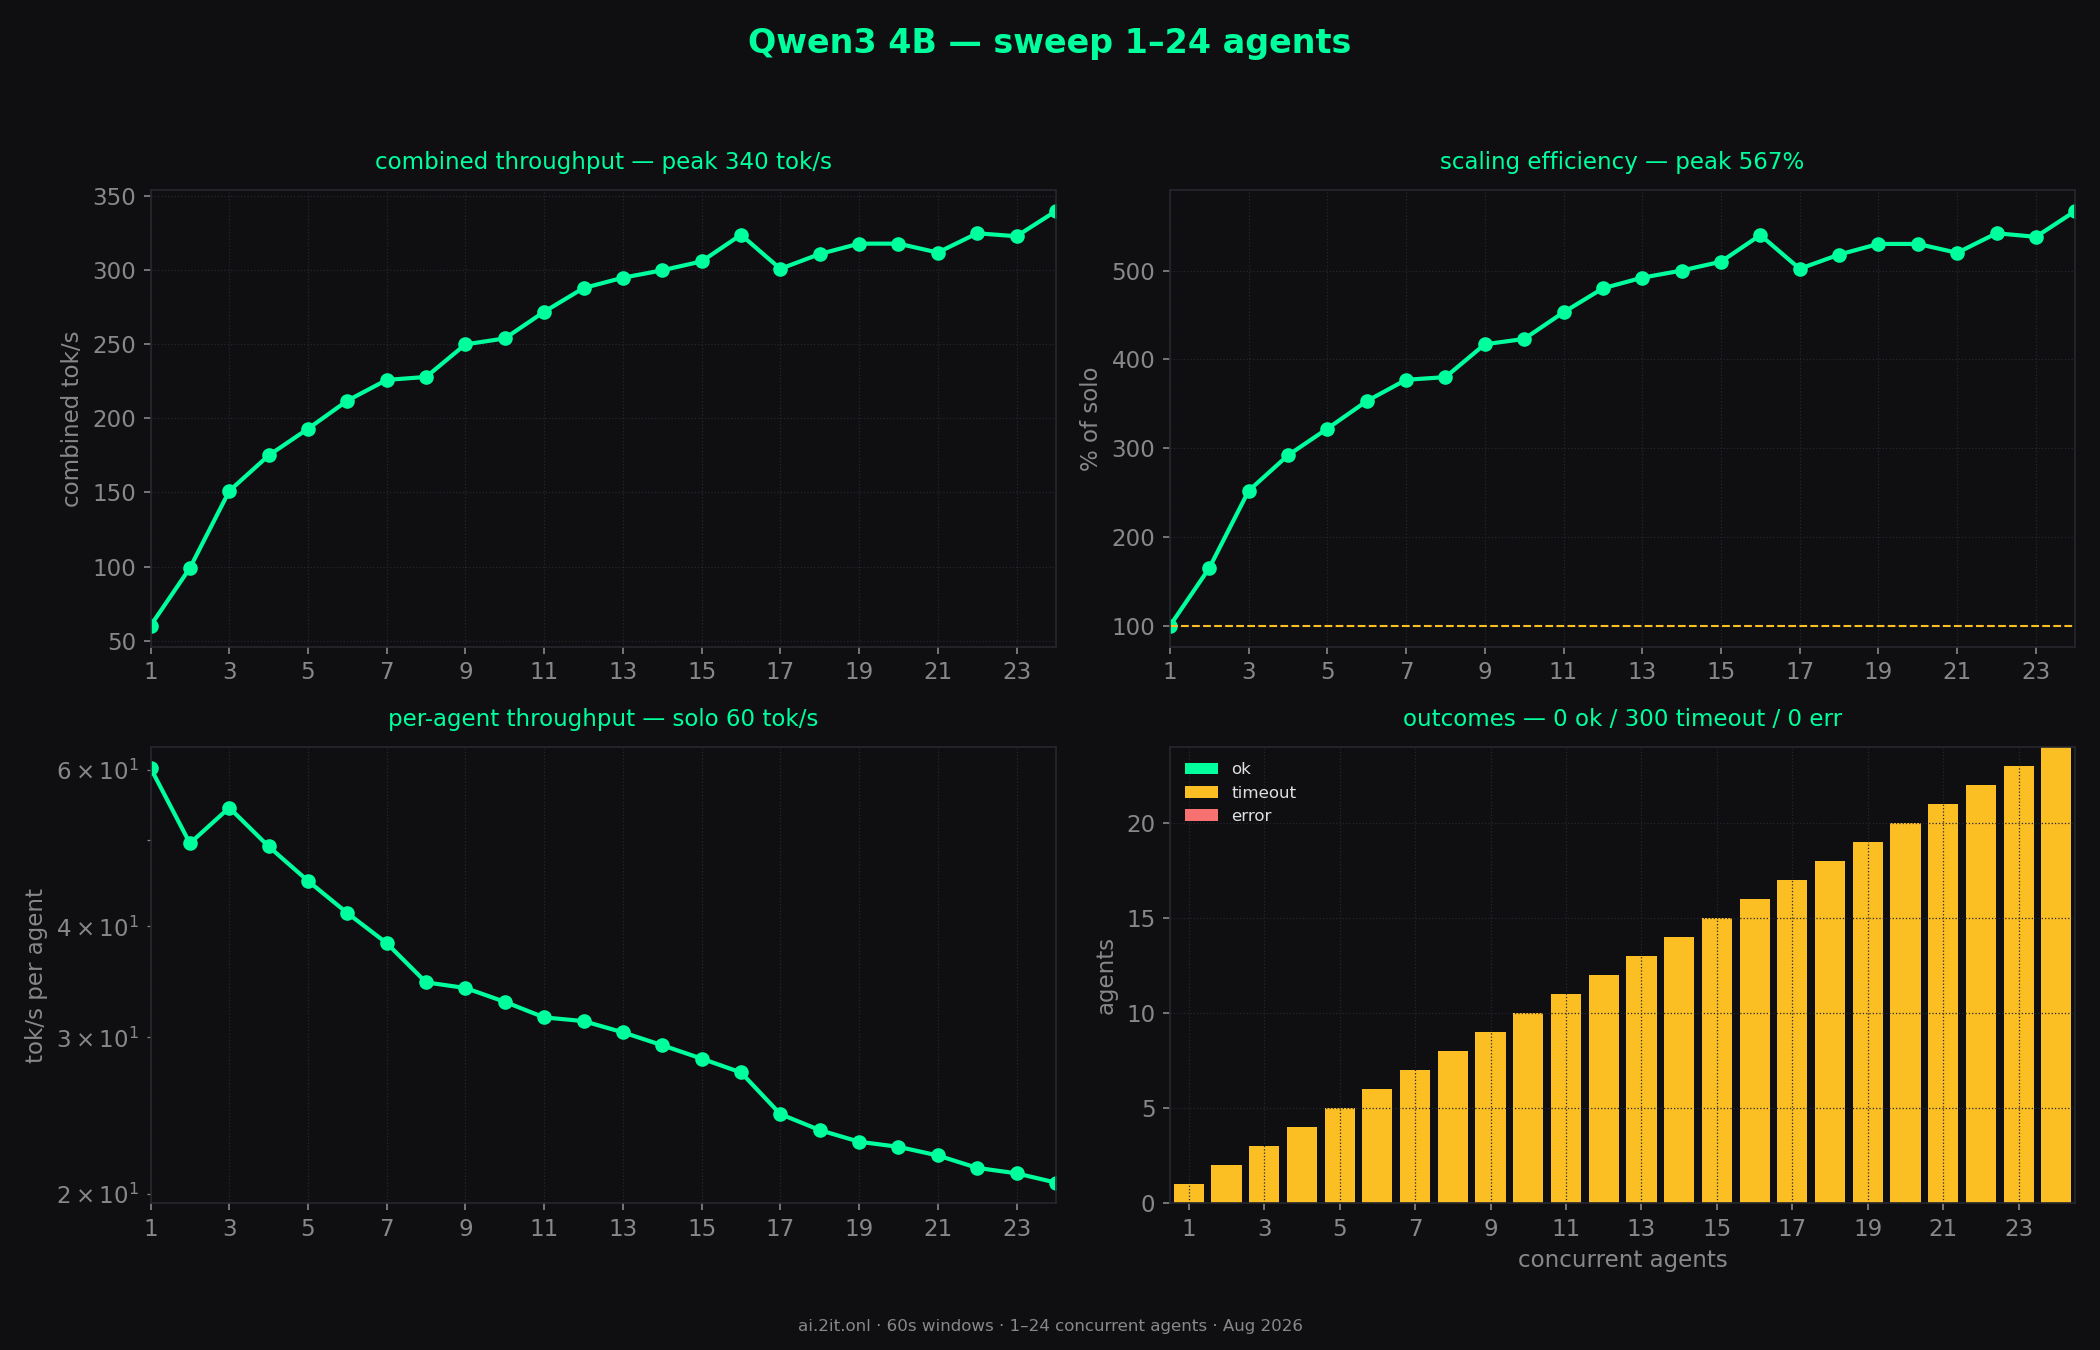
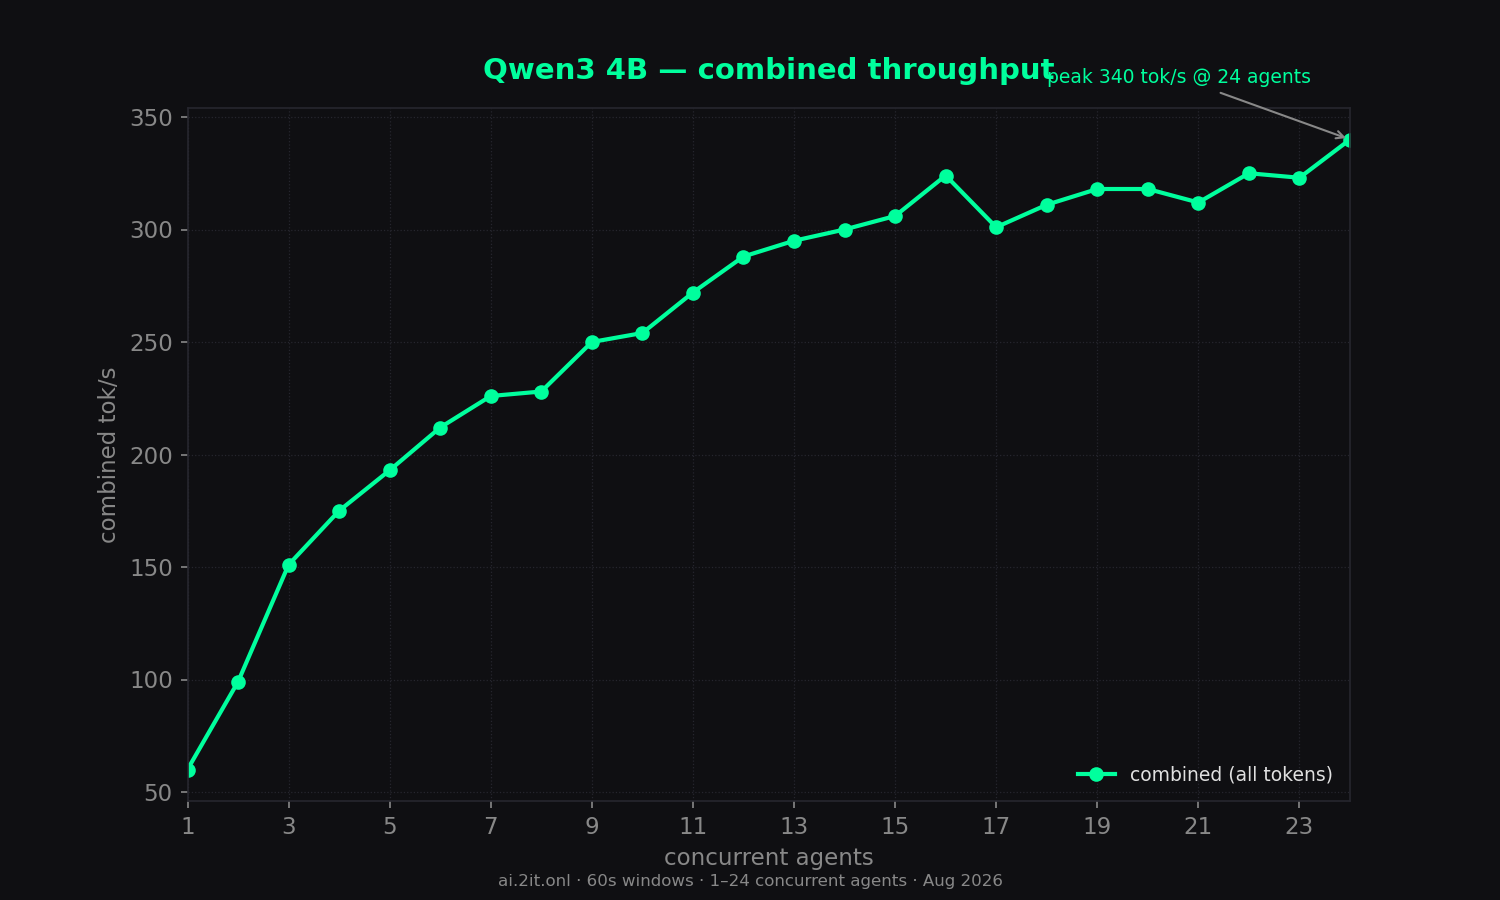
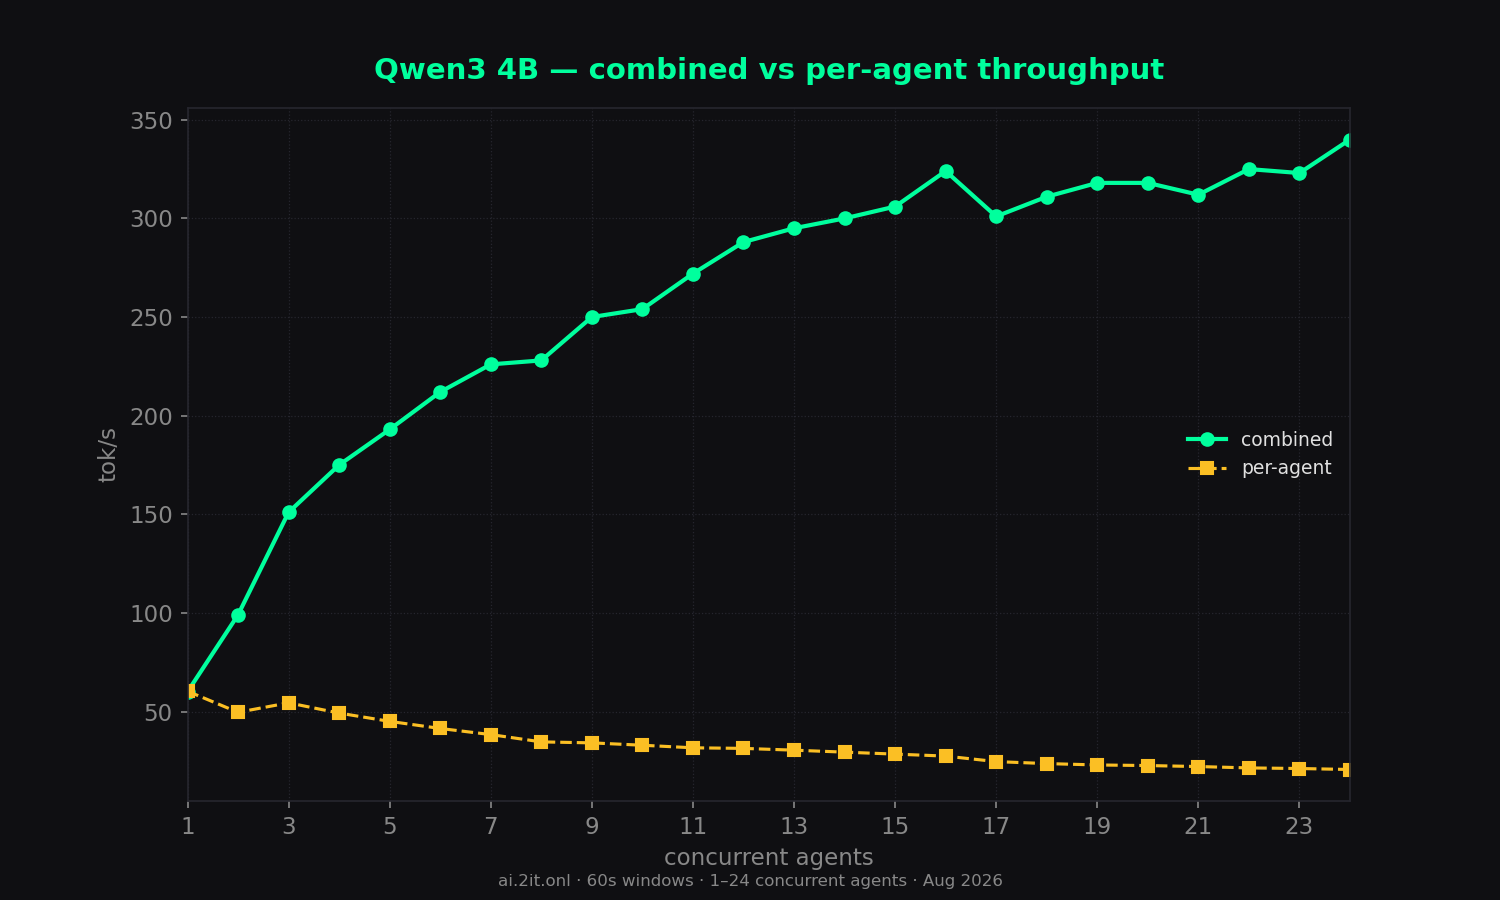
The worst latency profile of any model tested — 11.8s TTFT solo, 40–56s under load — and ~95% of its output is hidden reasoning at high concurrency. Peak: 340 tok/s.
Key findings
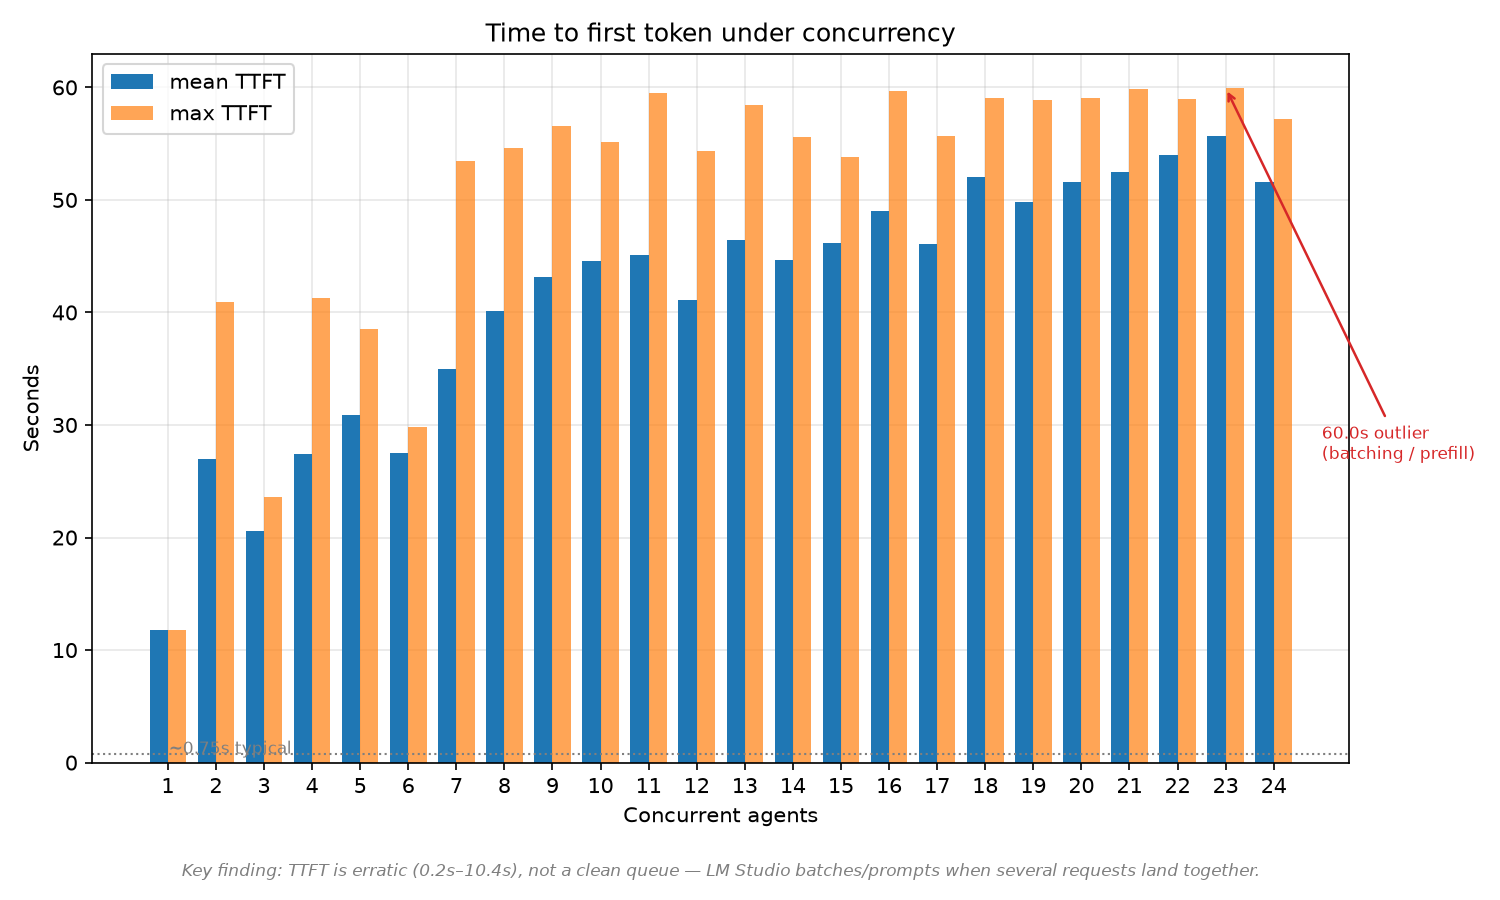
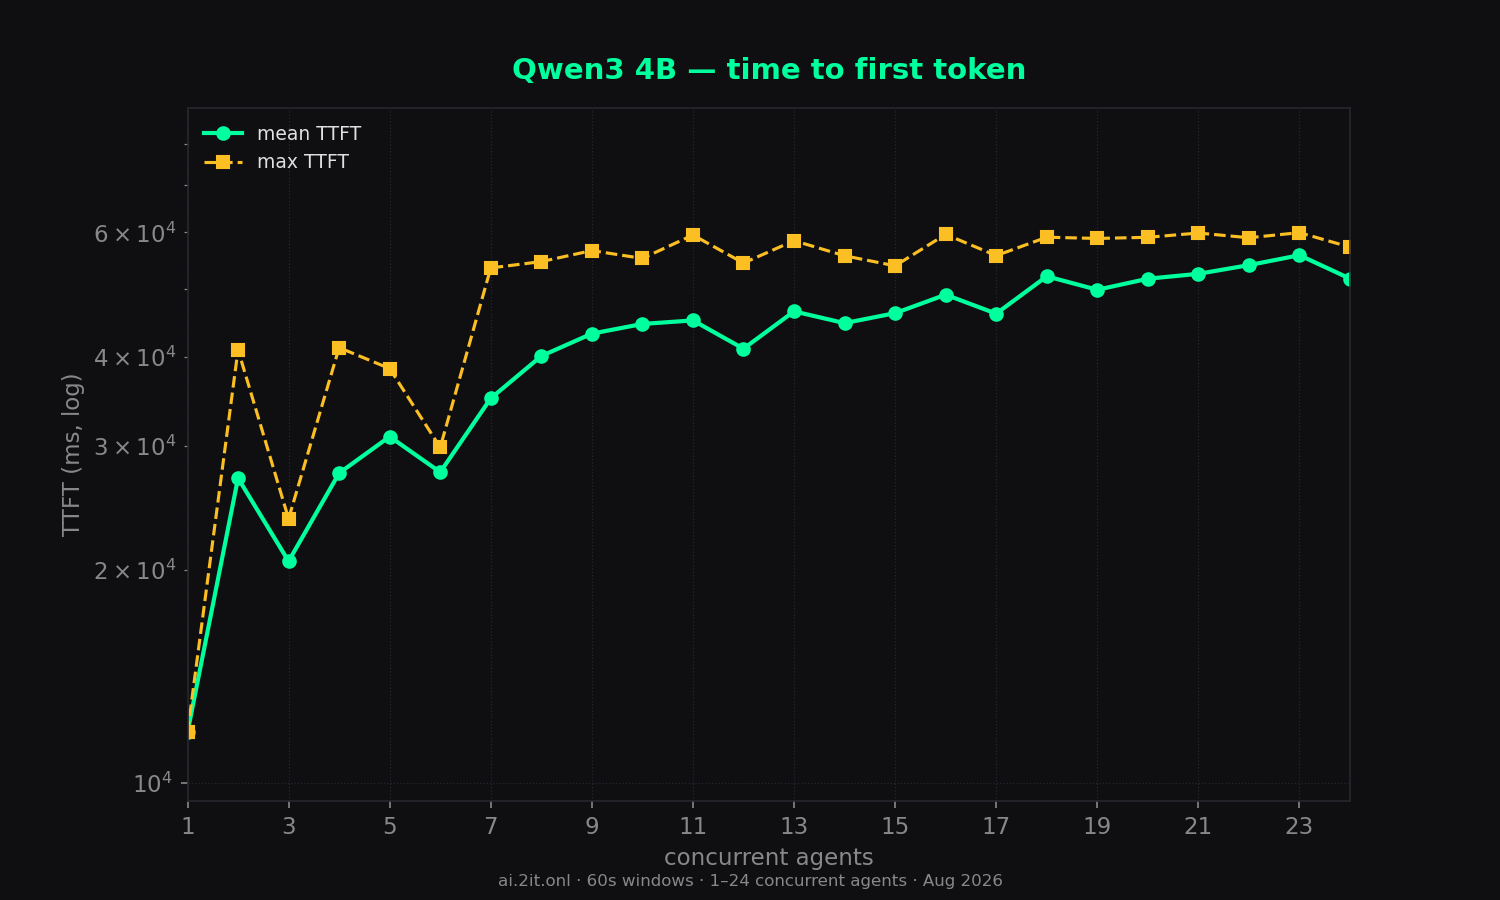
- The worst latency profile of any model tested: TTFT is 11.8s solo and 40–56s under load, with max values up to 60.0s — at high concurrency agents often wait the *entire* 60s window before producing a single token. The 4b params + Q4_0 KV + thinking prefill makes every request start extremely slowly.
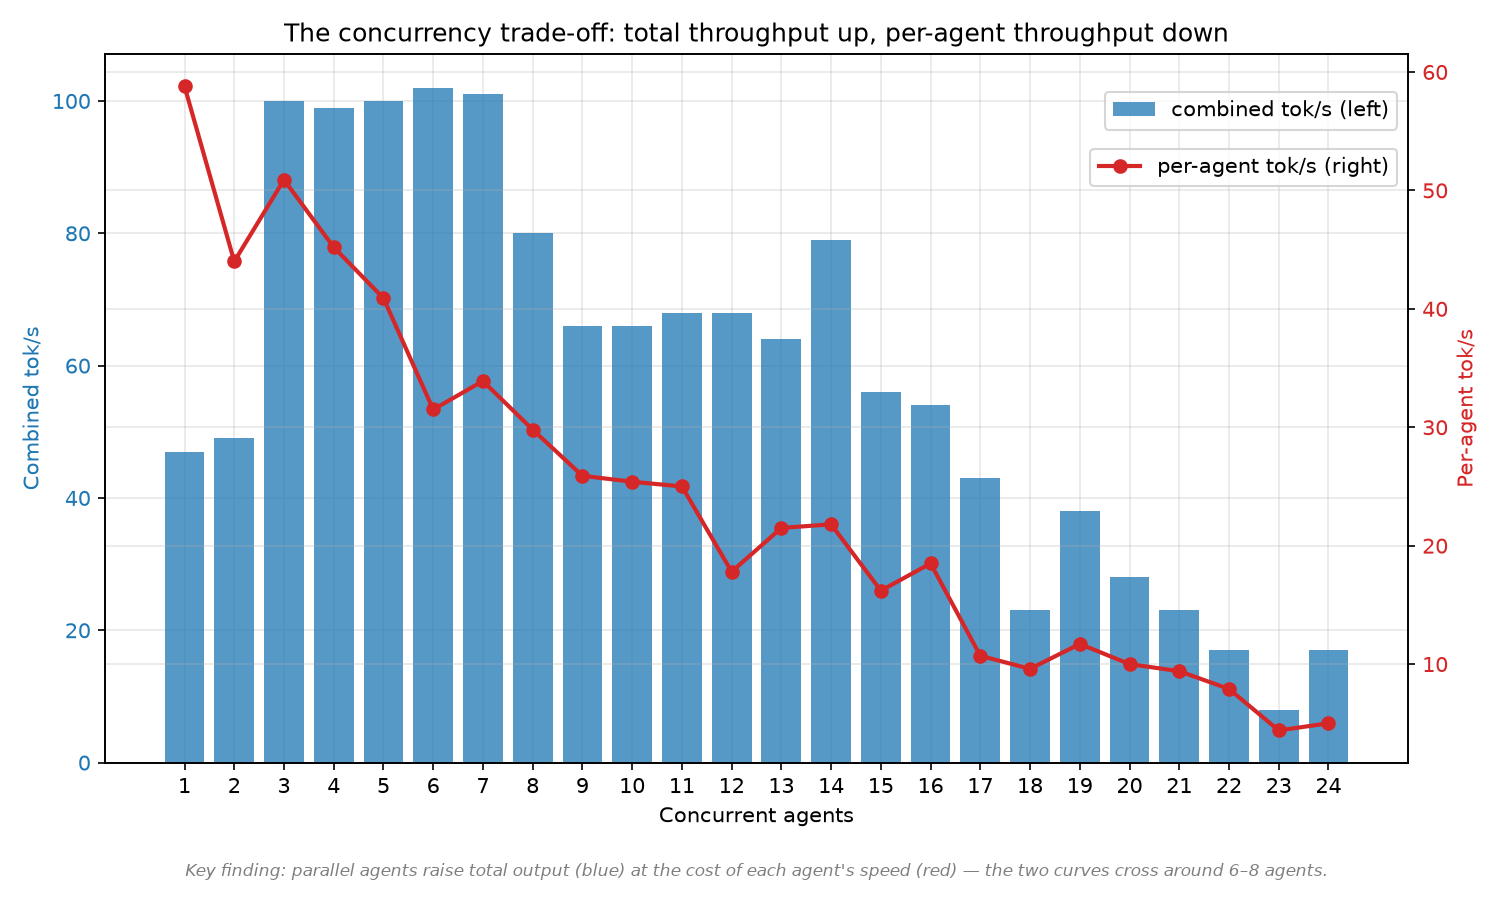
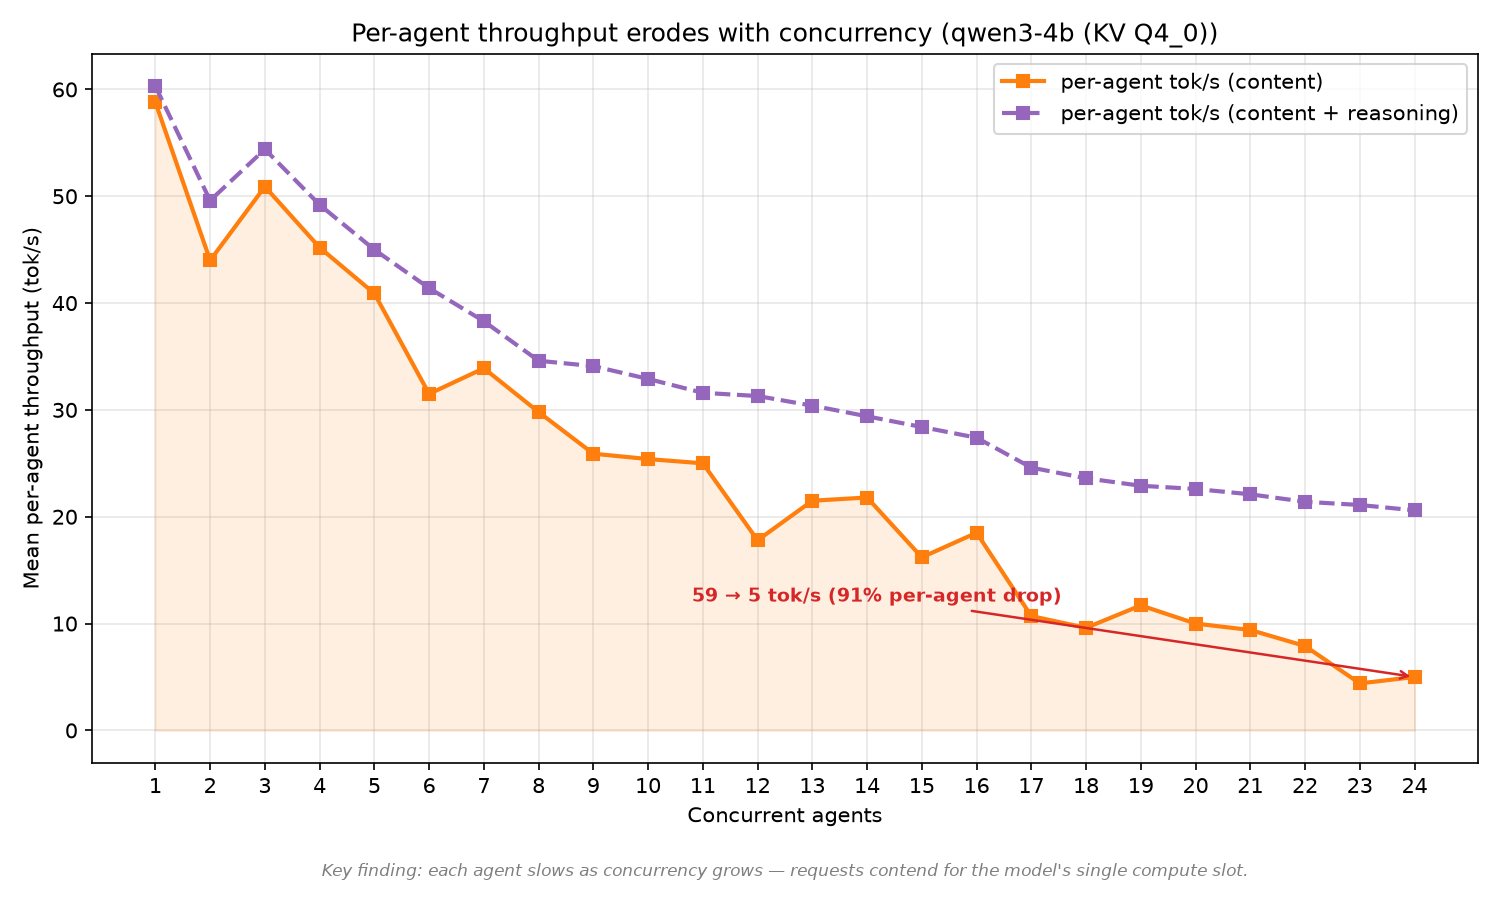
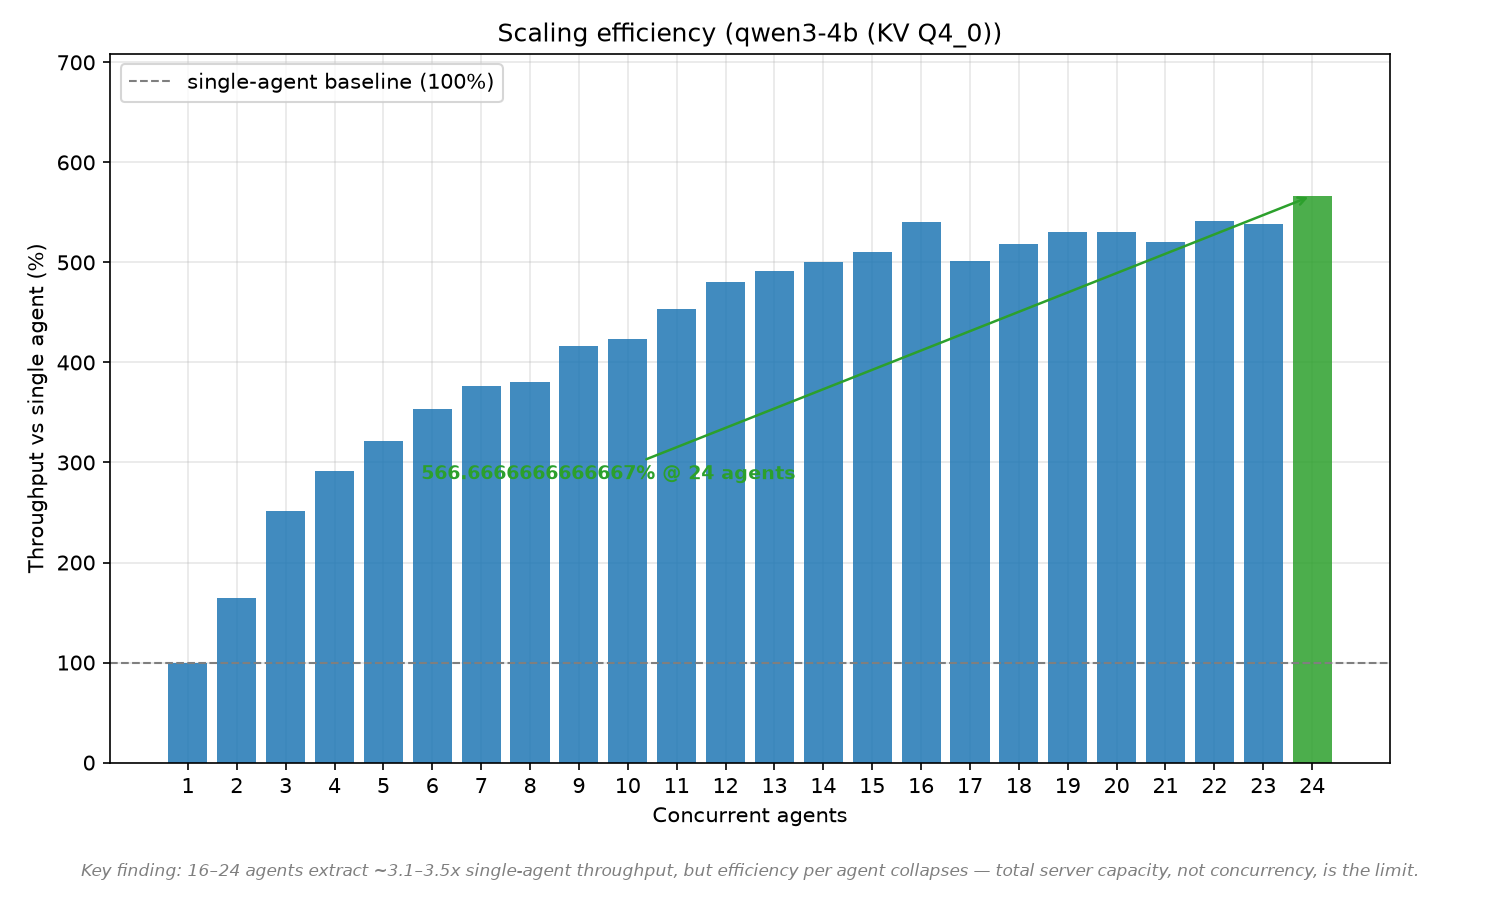
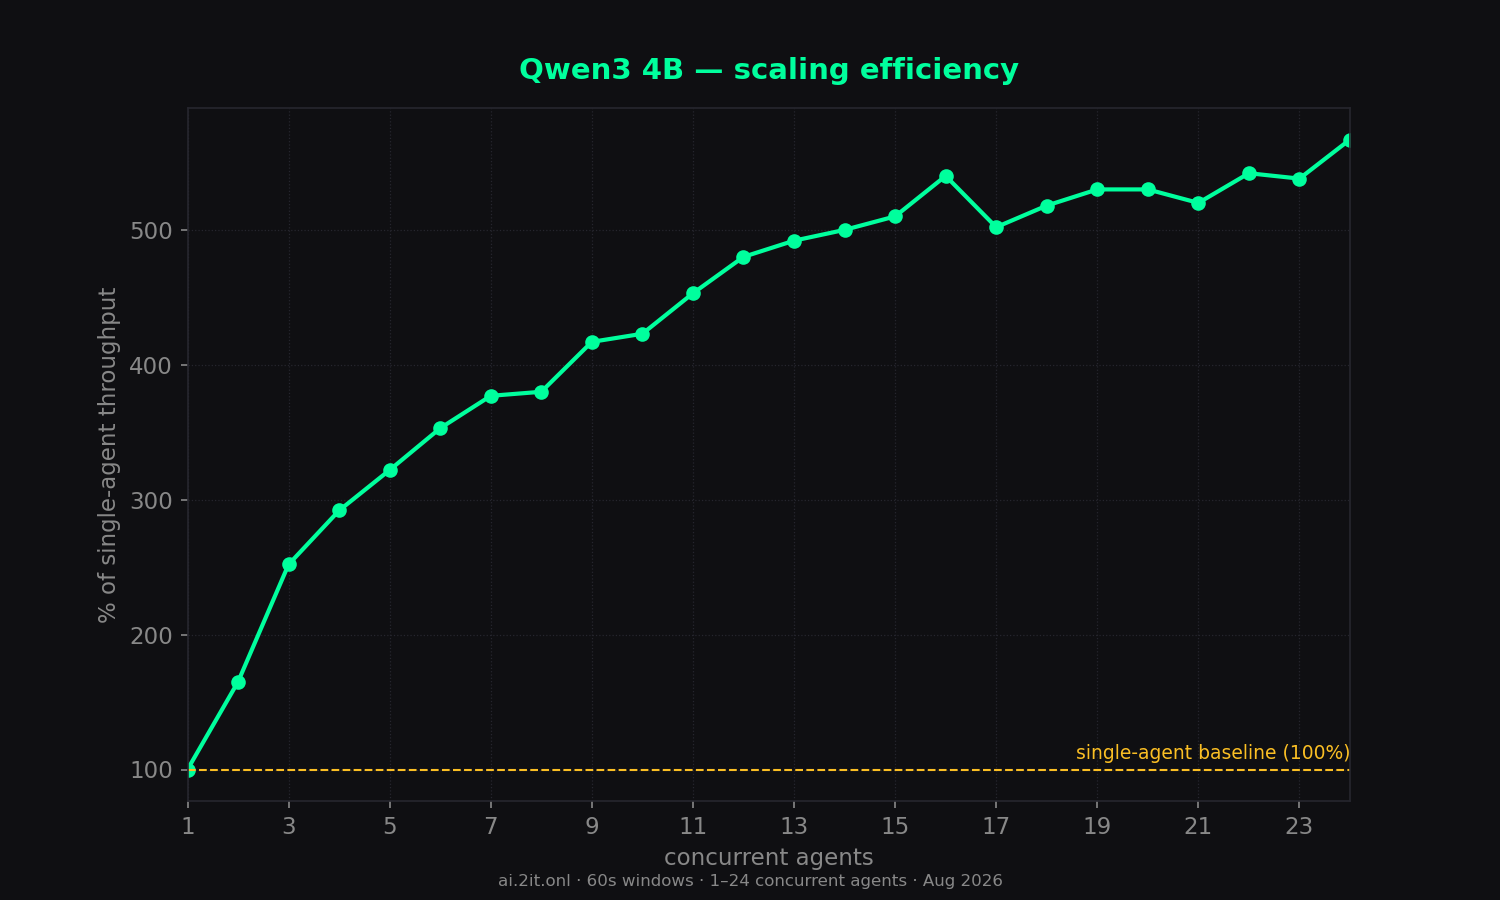
- Very slow absolute speed: only 60 tok/s solo (47 visible), and combined all-token throughput peaks at just 340 tok/s at 24 agents (5.7x) — near the bottom of the field.
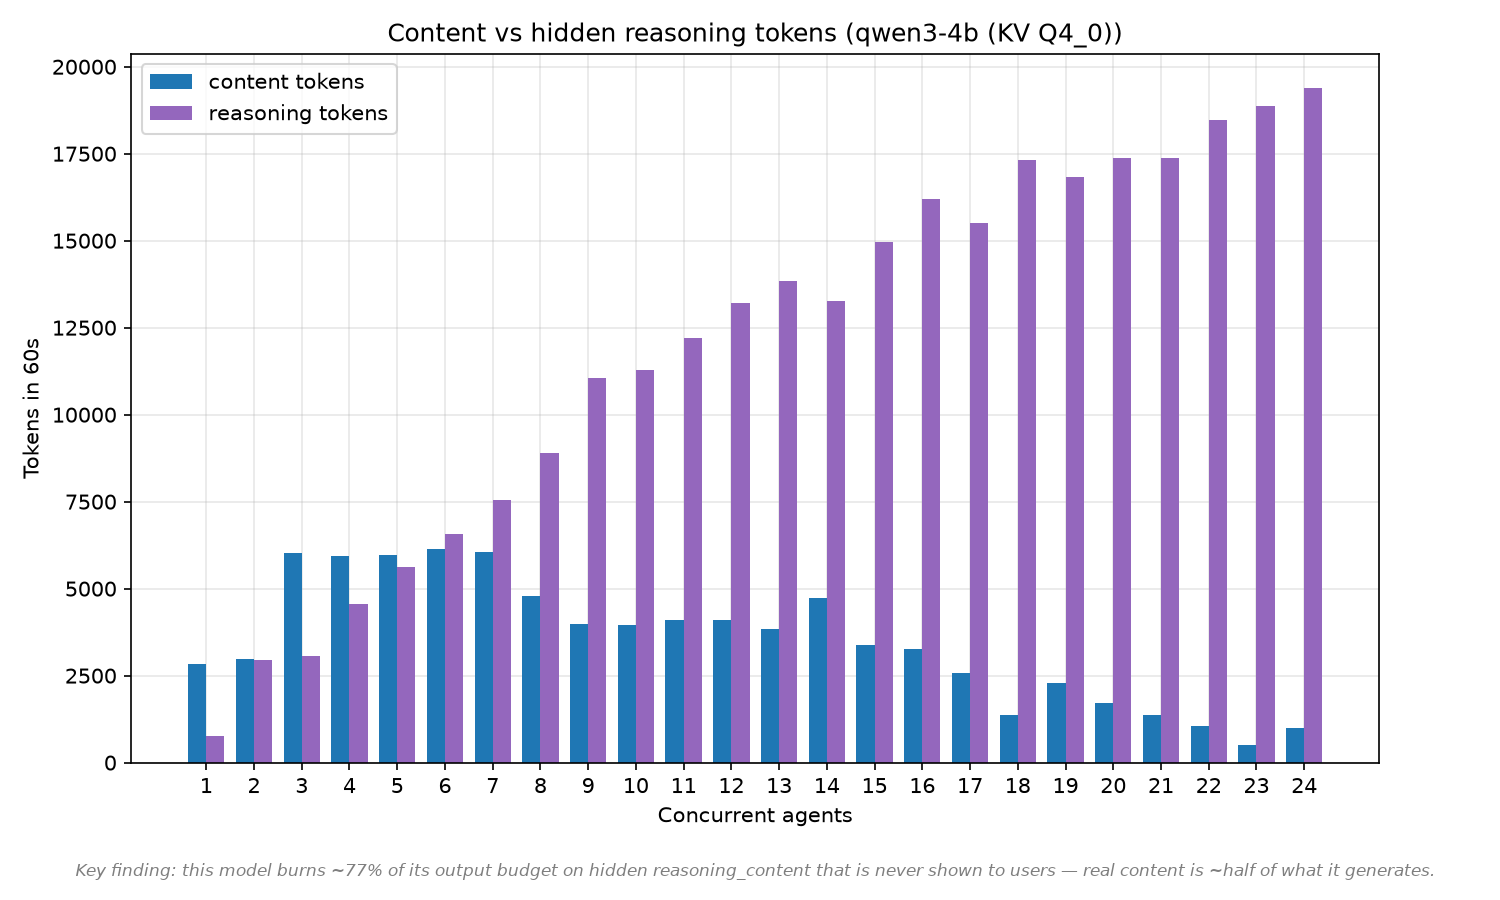
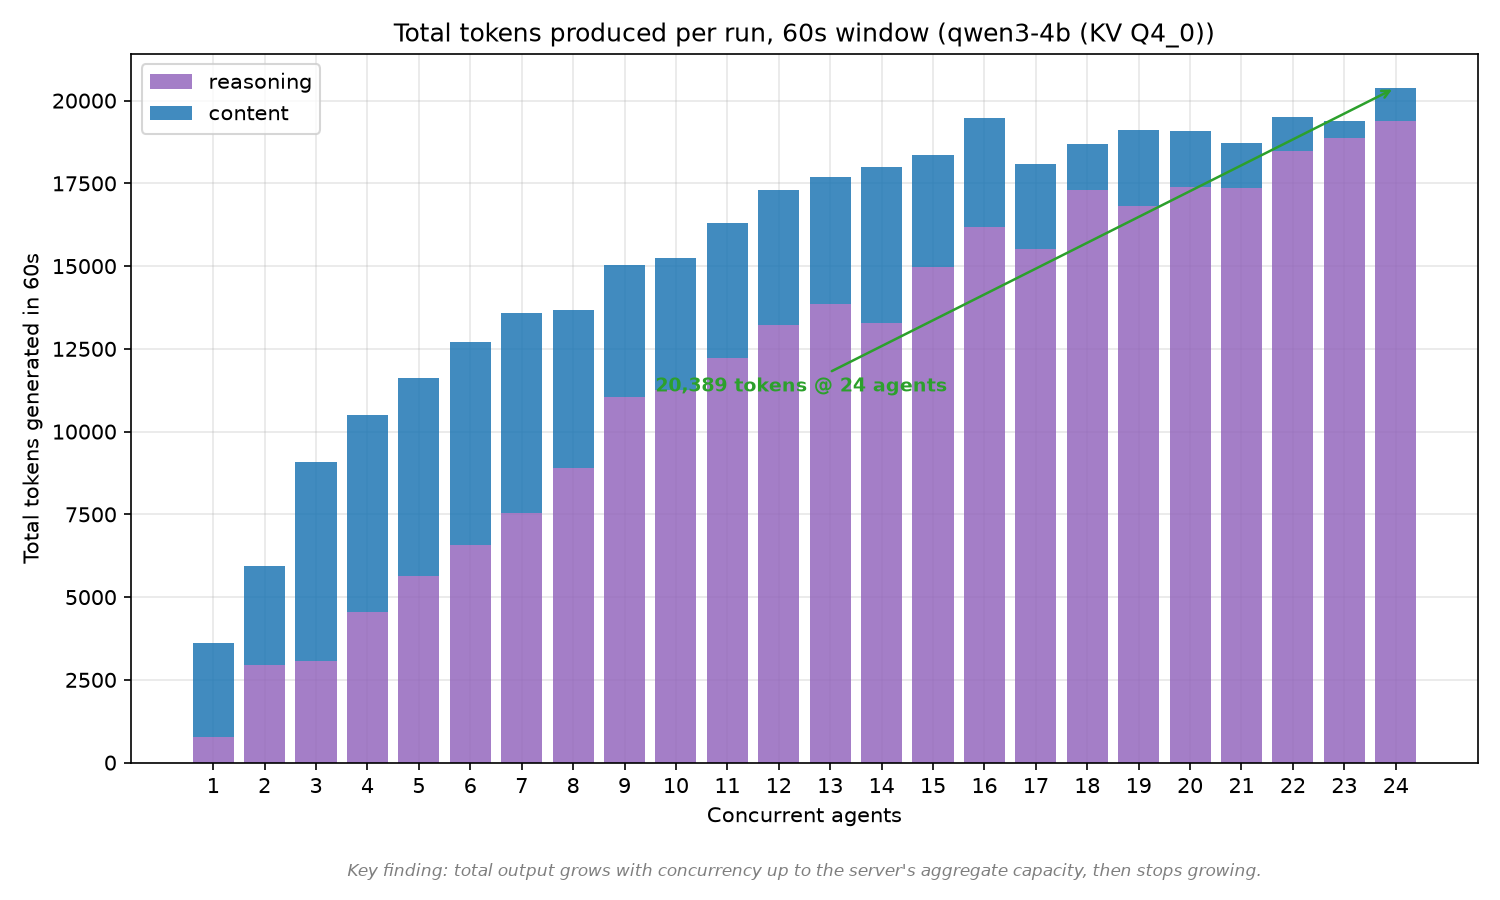
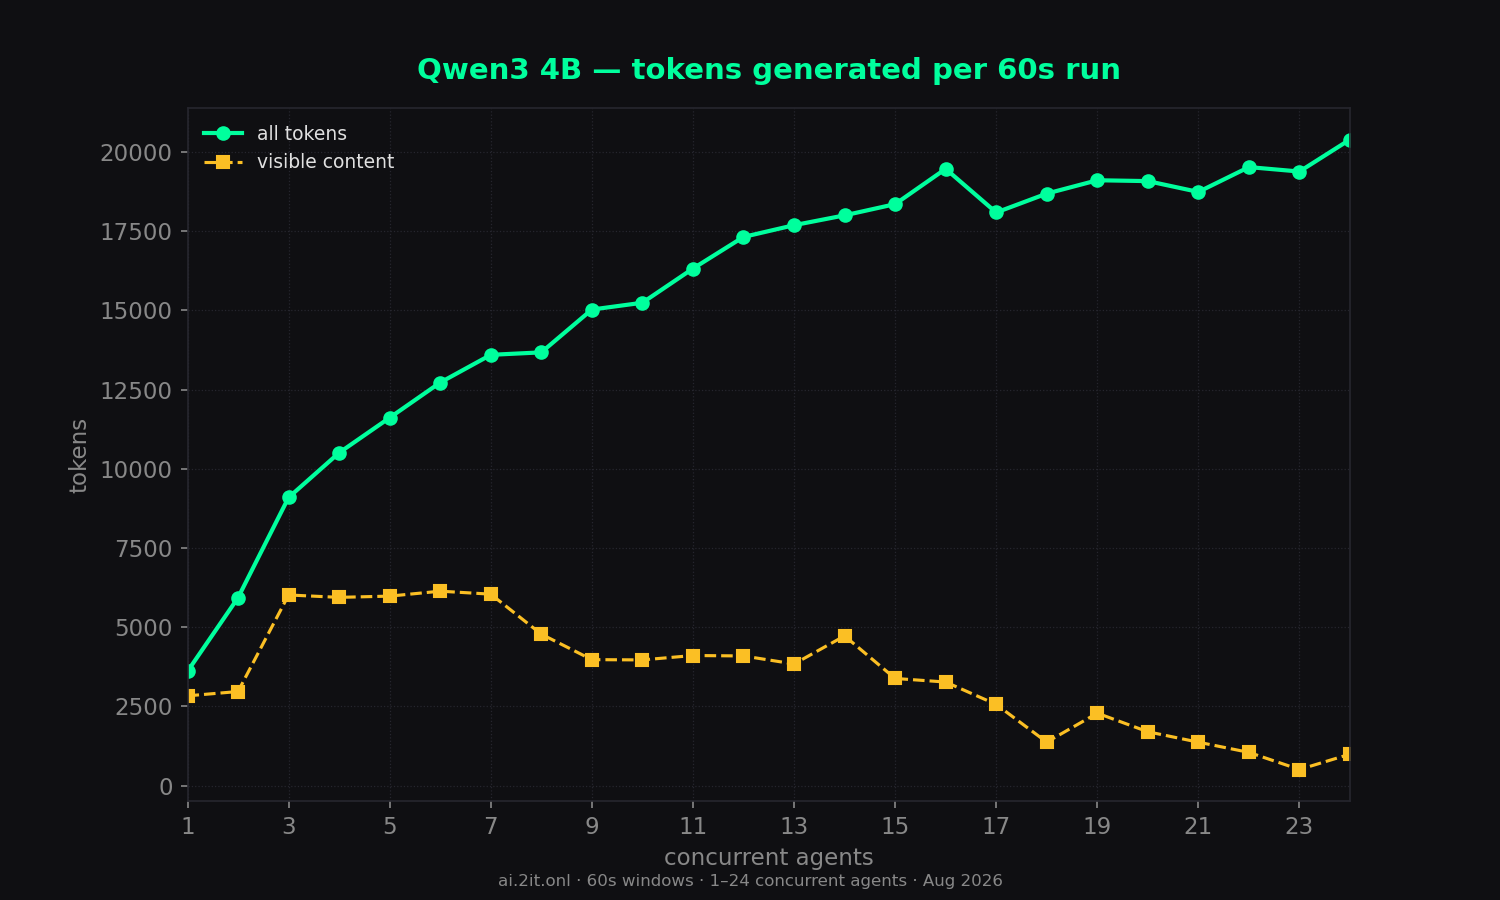
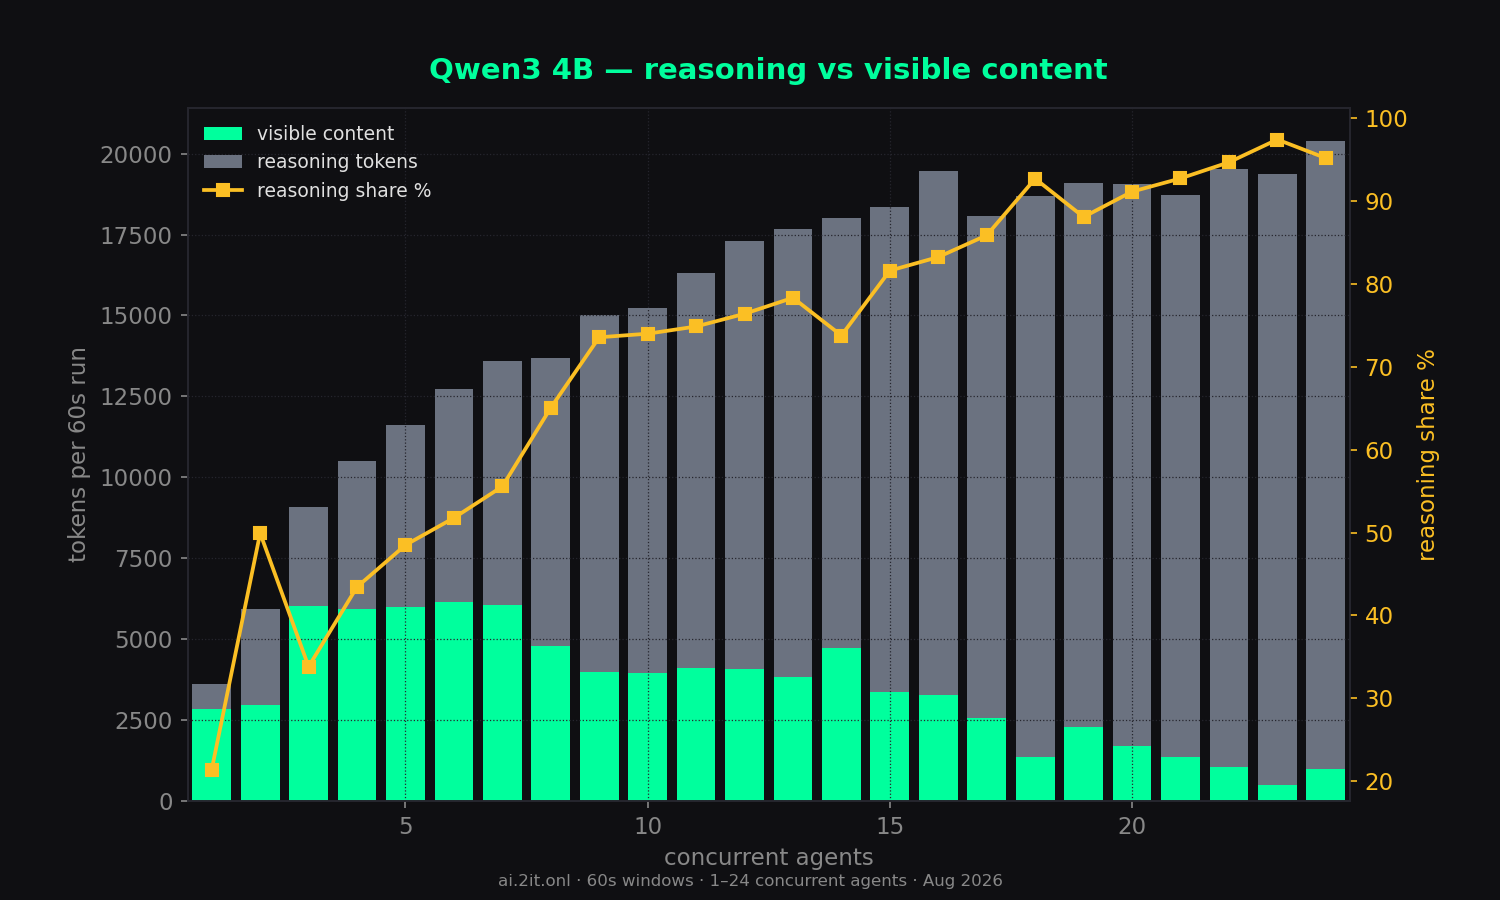
- Reasoning dominates almost everything at high concurrency: visible content collapses to 8–17 tok/s at 18–24 agents (~95% of output is hidden
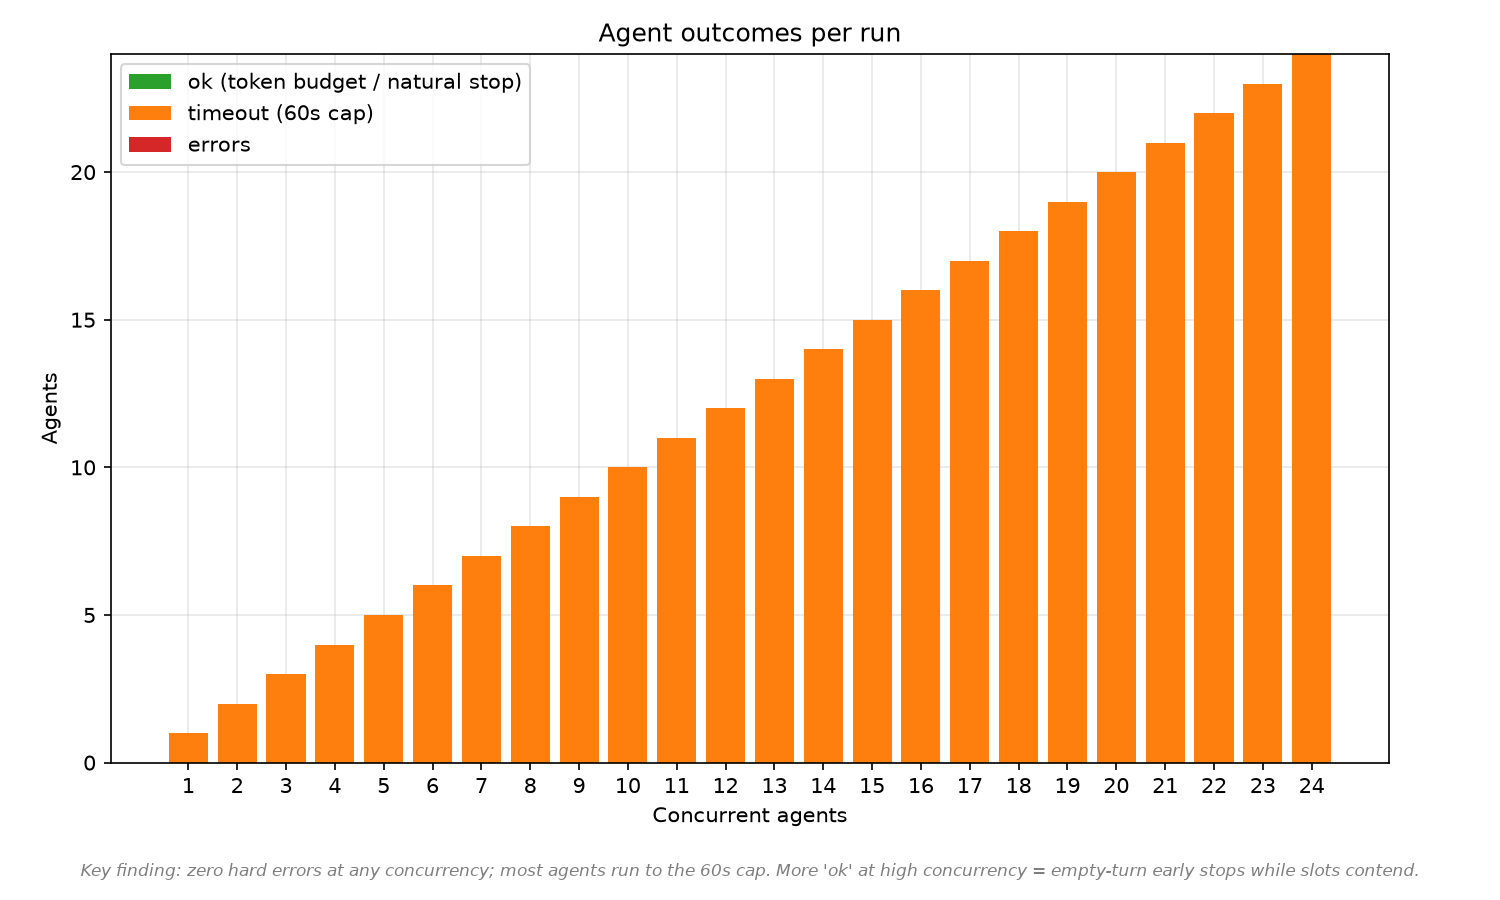
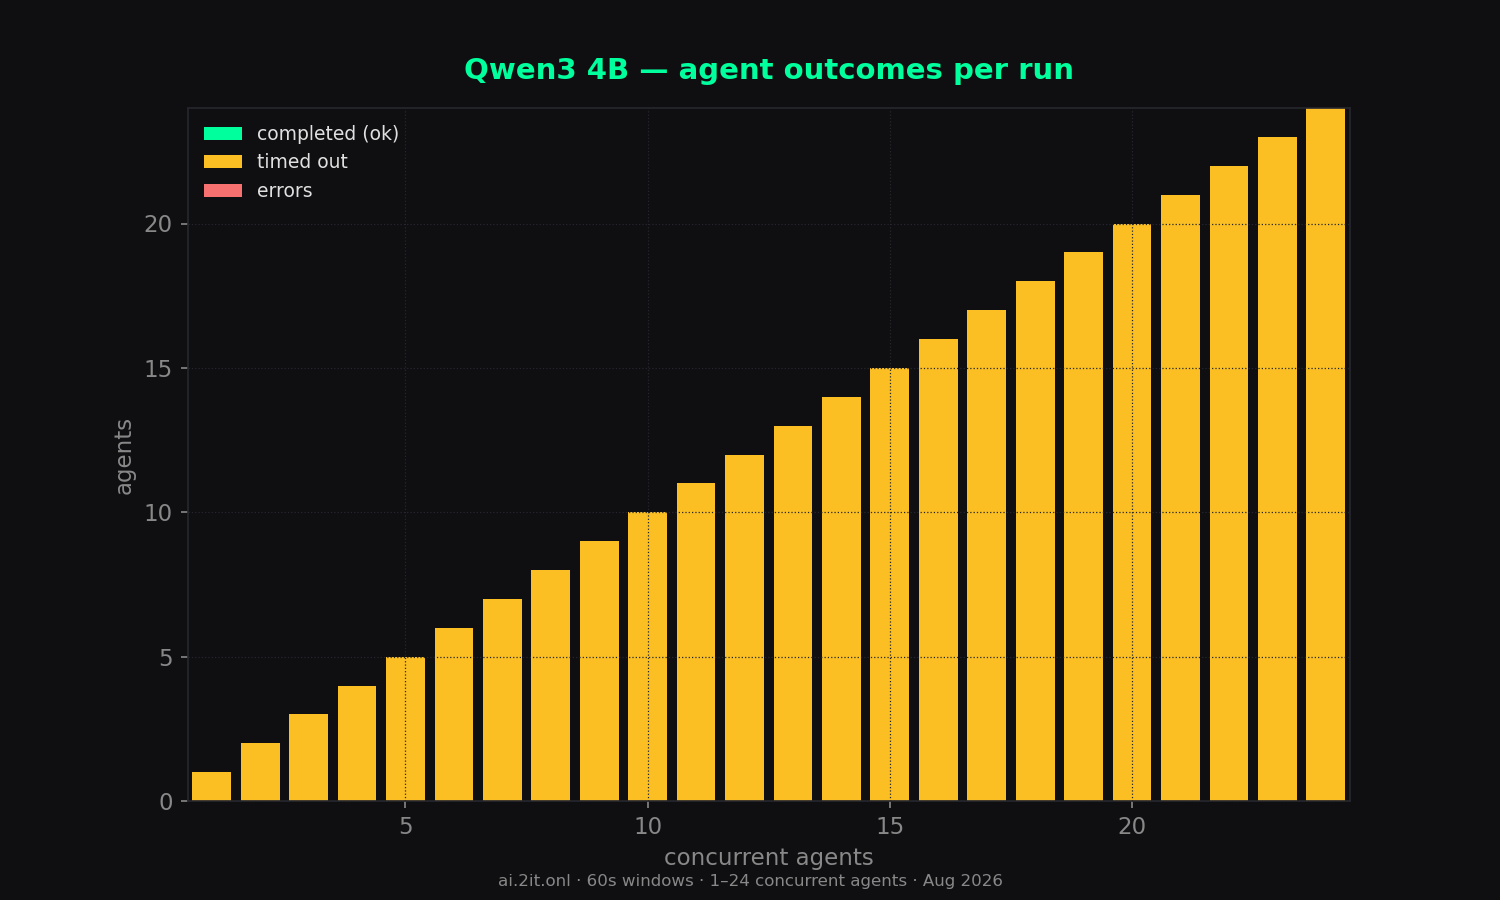
reasoning_content). - Errors: 0 across all 24 runs — but as a latency-sensitive or content-heavy workload, this model is a poor fit.
Sweep — total concurrency 1–24
| agents | wall (s) | content | reason | total | comb tok/s | comb all | per-agent | per-agent all | scale % | TTFT mean | TTFT max | ok | timeout | err |
|---|---|---|---|---|---|---|---|---|---|---|---|---|---|---|
| 1 | 60.0 | 2,833 | 773 | 3,606 | 47 | 60 | 58.8 | 60.3 | 100% | 11.8s | 11.8s | 0 | 1 | 0 |
| 2 | 60.0 | 2,970 | 2,961 | 5,931 | 49 | 99 | 44.0 | 49.6 | 165% | 27.0s | 41.0s | 0 | 2 | 0 |
| 3 | 60.0 | 6,016 | 3,077 | 9,093 | 100 | 151 | 50.9 | 54.4 | 252% | 20.6s | 23.6s | 0 | 3 | 0 |
| 4 | 60.0 | 5,941 | 4,563 | 10,504 | 99 | 175 | 45.2 | 49.2 | 292% | 27.4s | 41.3s | 0 | 4 | 0 |
| 5 | 60.0 | 5,980 | 5,630 | 11,610 | 100 | 193 | 40.9 | 45.0 | 322% | 30.9s | 38.5s | 0 | 5 | 0 |
| 6 | 60.0 | 6,136 | 6,584 | 12,720 | 102 | 212 | 31.5 | 41.4 | 353% | 27.5s | 29.8s | 0 | 6 | 0 |
| 7 | 60.0 | 6,042 | 7,552 | 13,594 | 101 | 226 | 33.9 | 38.3 | 377% | 35.0s | 53.5s | 0 | 7 | 0 |
| 8 | 60.0 | 4,780 | 8,892 | 13,672 | 80 | 228 | 29.8 | 34.6 | 380% | 40.1s | 54.6s | 0 | 8 | 0 |
| 9 | 60.0 | 3,976 | 11,047 | 15,023 | 66 | 250 | 25.9 | 34.1 | 417% | 43.2s | 56.6s | 0 | 9 | 0 |
| 10 | 60.0 | 3,967 | 11,271 | 15,238 | 66 | 254 | 25.4 | 32.9 | 423% | 44.6s | 55.1s | 0 | 10 | 0 |
| 11 | 60.0 | 4,106 | 12,210 | 16,316 | 68 | 272 | 25.0 | 31.6 | 453% | 45.1s | 59.5s | 0 | 11 | 0 |
| 12 | 60.0 | 4,092 | 13,222 | 17,314 | 68 | 288 | 17.8 | 31.3 | 480% | 41.1s | 54.3s | 0 | 12 | 0 |
| 13 | 60.0 | 3,839 | 13,846 | 17,685 | 64 | 295 | 21.5 | 30.4 | 492% | 46.4s | 58.4s | 0 | 13 | 0 |
| 14 | 60.0 | 4,724 | 13,271 | 17,995 | 79 | 300 | 21.8 | 29.4 | 500% | 44.7s | 55.6s | 0 | 14 | 0 |
| 15 | 60.0 | 3,382 | 14,967 | 18,349 | 56 | 306 | 16.2 | 28.4 | 510% | 46.1s | 53.8s | 0 | 15 | 0 |
| 16 | 60.0 | 3,269 | 16,194 | 19,463 | 54 | 324 | 18.5 | 27.4 | 540% | 49.0s | 59.6s | 0 | 16 | 0 |
| 17 | 60.0 | 2,563 | 15,523 | 18,086 | 43 | 301 | 10.7 | 24.6 | 502% | 46.1s | 55.6s | 0 | 17 | 0 |
| 18 | 60.0 | 1,373 | 17,309 | 18,682 | 23 | 311 | 9.6 | 23.6 | 518% | 52.0s | 59.1s | 0 | 18 | 0 |
| 19 | 60.0 | 2,286 | 16,817 | 19,103 | 38 | 318 | 11.7 | 22.9 | 530% | 49.8s | 58.8s | 0 | 19 | 0 |
| 20 | 60.0 | 1,700 | 17,376 | 19,076 | 28 | 318 | 10.0 | 22.6 | 530% | 51.6s | 59.1s | 0 | 20 | 0 |
| 21 | 60.0 | 1,371 | 17,363 | 18,734 | 23 | 312 | 9.4 | 22.1 | 520% | 52.4s | 59.9s | 0 | 21 | 0 |
| 22 | 60.0 | 1,049 | 18,469 | 19,518 | 17 | 325 | 7.9 | 21.4 | 542% | 54.0s | 59.0s | 0 | 22 | 0 |
| 23 | 60.0 | 509 | 18,869 | 19,378 | 8 | 323 | 4.4 | 21.1 | 538% | 55.7s | 60.0s | 0 | 23 | 0 |
| 24 peak | 60.0 | 993 | 19,396 | 20,389 | 17 | 340 | 5.0 | 20.6 | 567% | 51.6s | 57.2s | 0 | 24 | 0 |
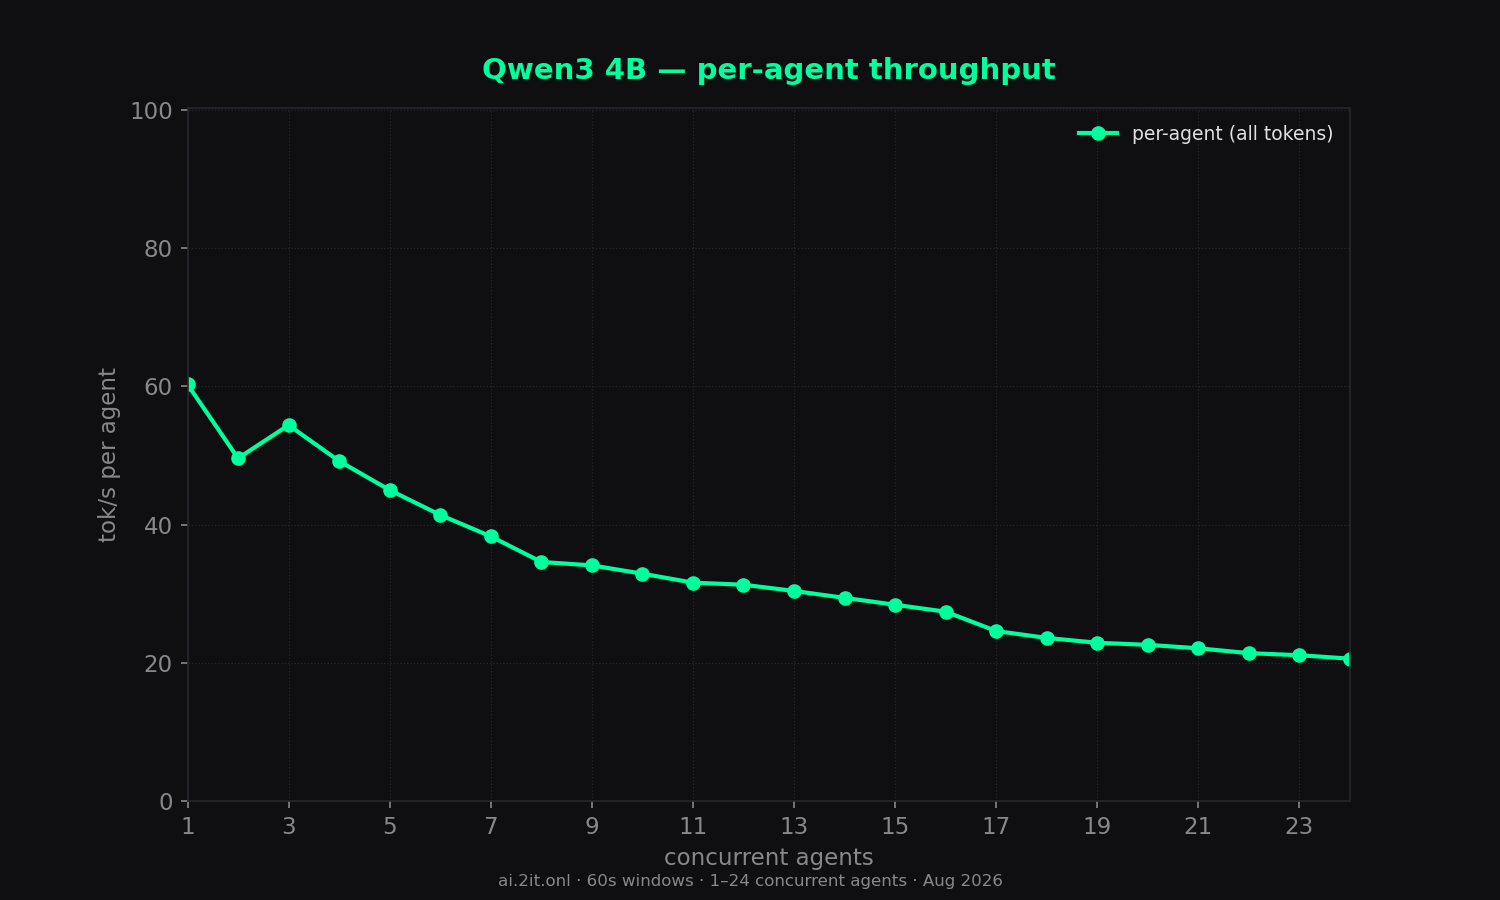
* burst artifact — agents queued ~11–16s then generated in a short burst; the per-agent timer inflates the number. Trust combined throughput and TTFT columns. Peak row = highest combined (all-token) throughput.
Charts
Raw data & downloads
- report.md5 KB
- sweep-summary.csv2 KB
- sweep-summary.json11 KB
- combined_throughput.png126 KB · original matplotlib export
- combined_vs_per_agent.png103 KB · original matplotlib export
- dashboard_1_24.png183 KB · original matplotlib export
- outcome_breakdown.png57 KB · original matplotlib export
- per_agent_throughput.png118 KB · original matplotlib export
- reasoning_vs_content.png65 KB · original matplotlib export
- scaling_efficiency.png82 KB · original matplotlib export
- time_to_first_token.png69 KB · original matplotlib export
- total_tokens_generated.png81 KB · original matplotlib export