
Qwen3.5 0.8B — MTP Disabled
server model id:
qwen3.5-0.8b-mtpthinkingKV F16ctx 32k0.8B params
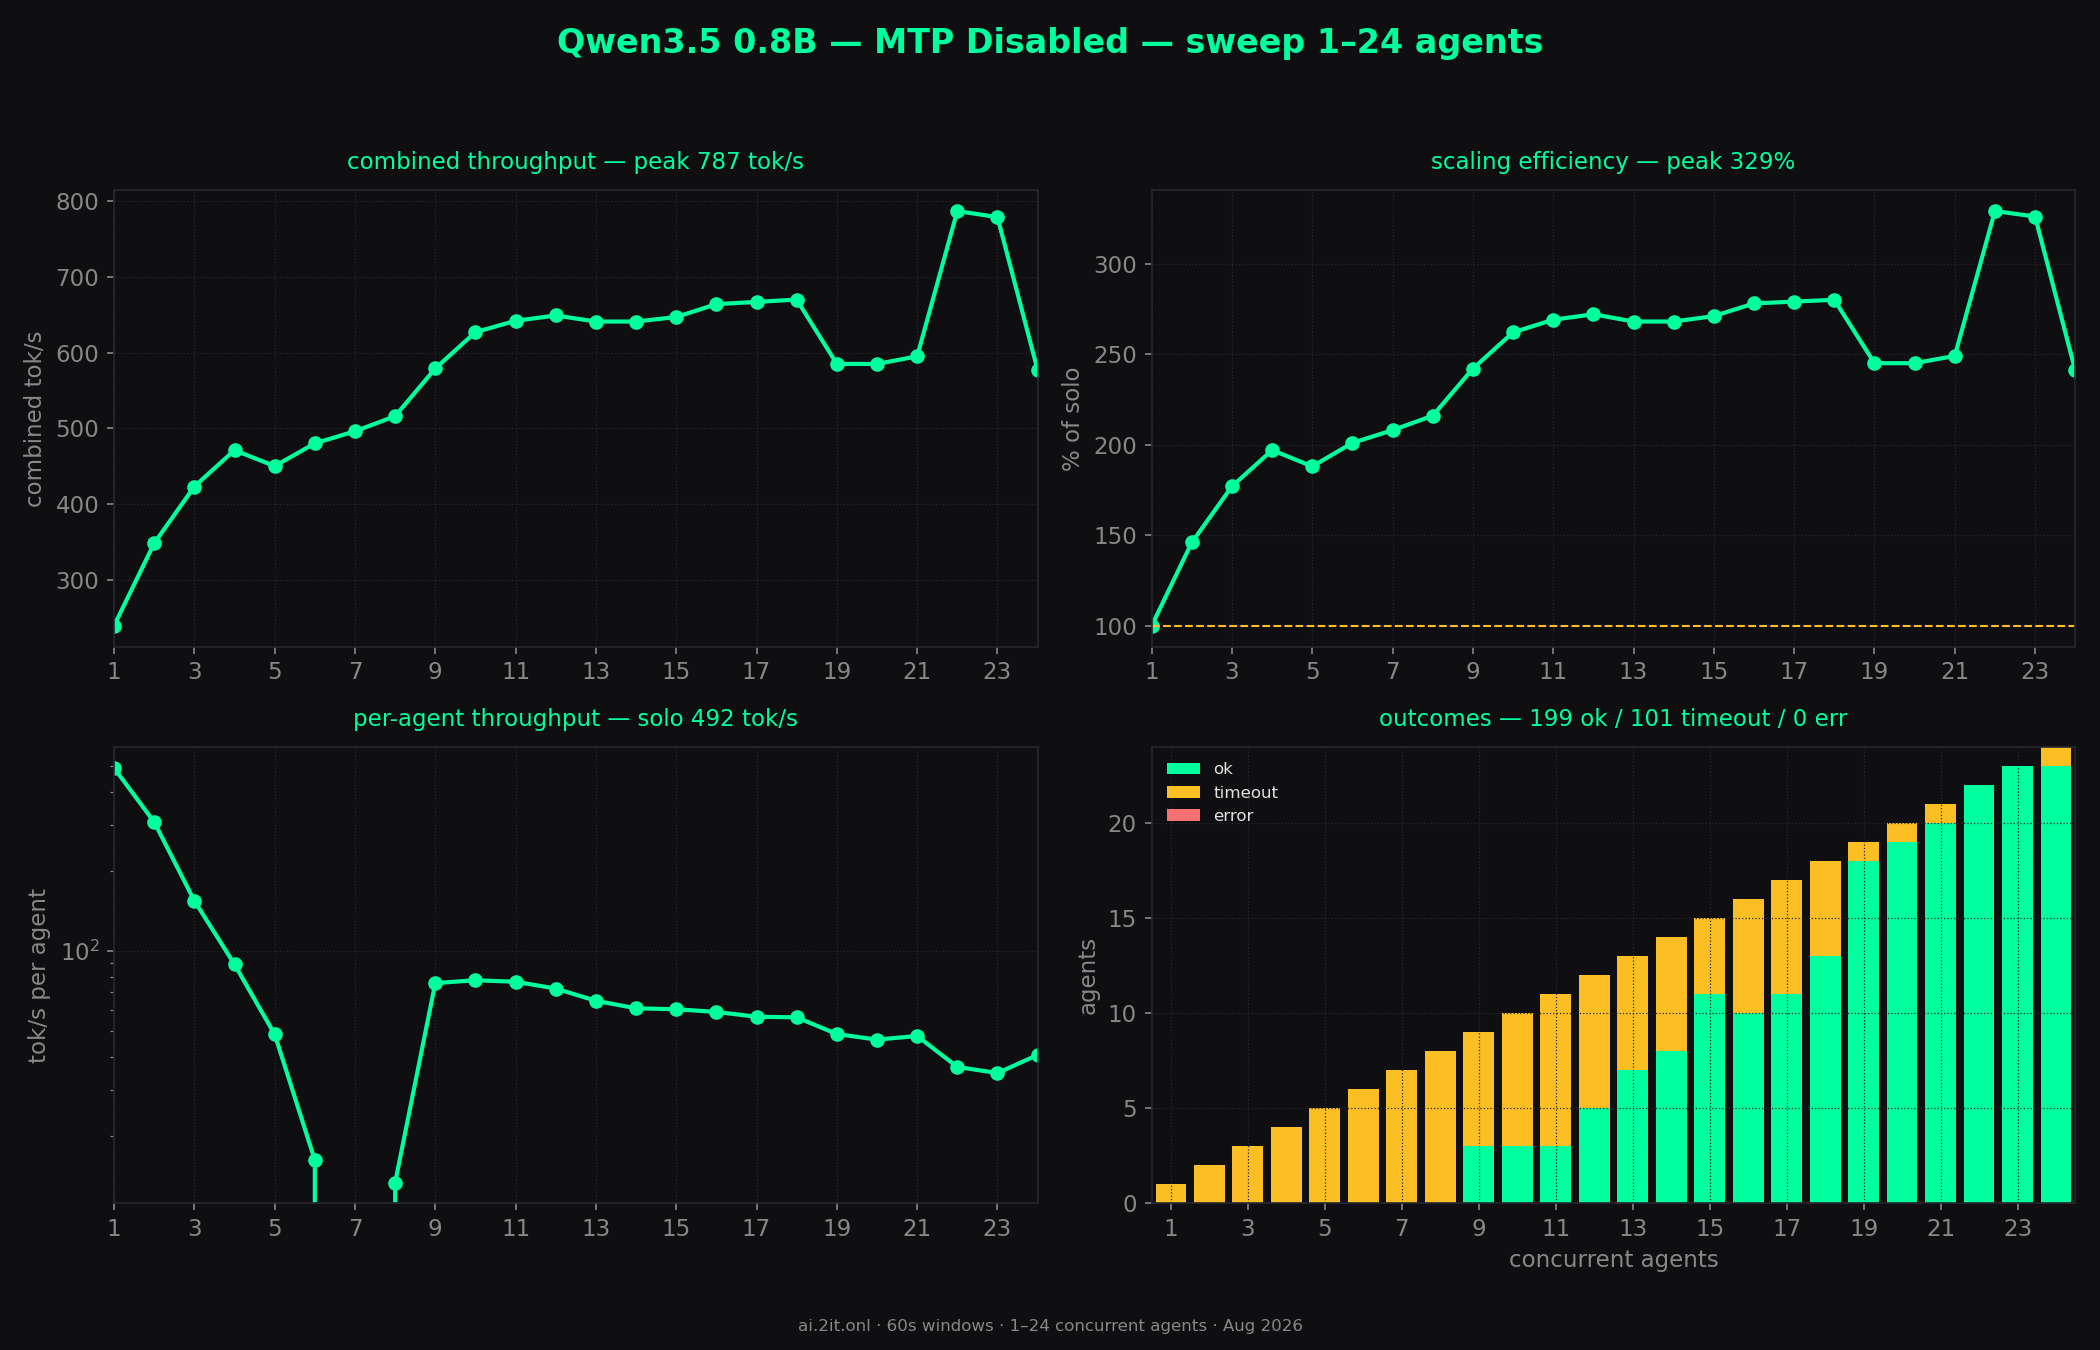
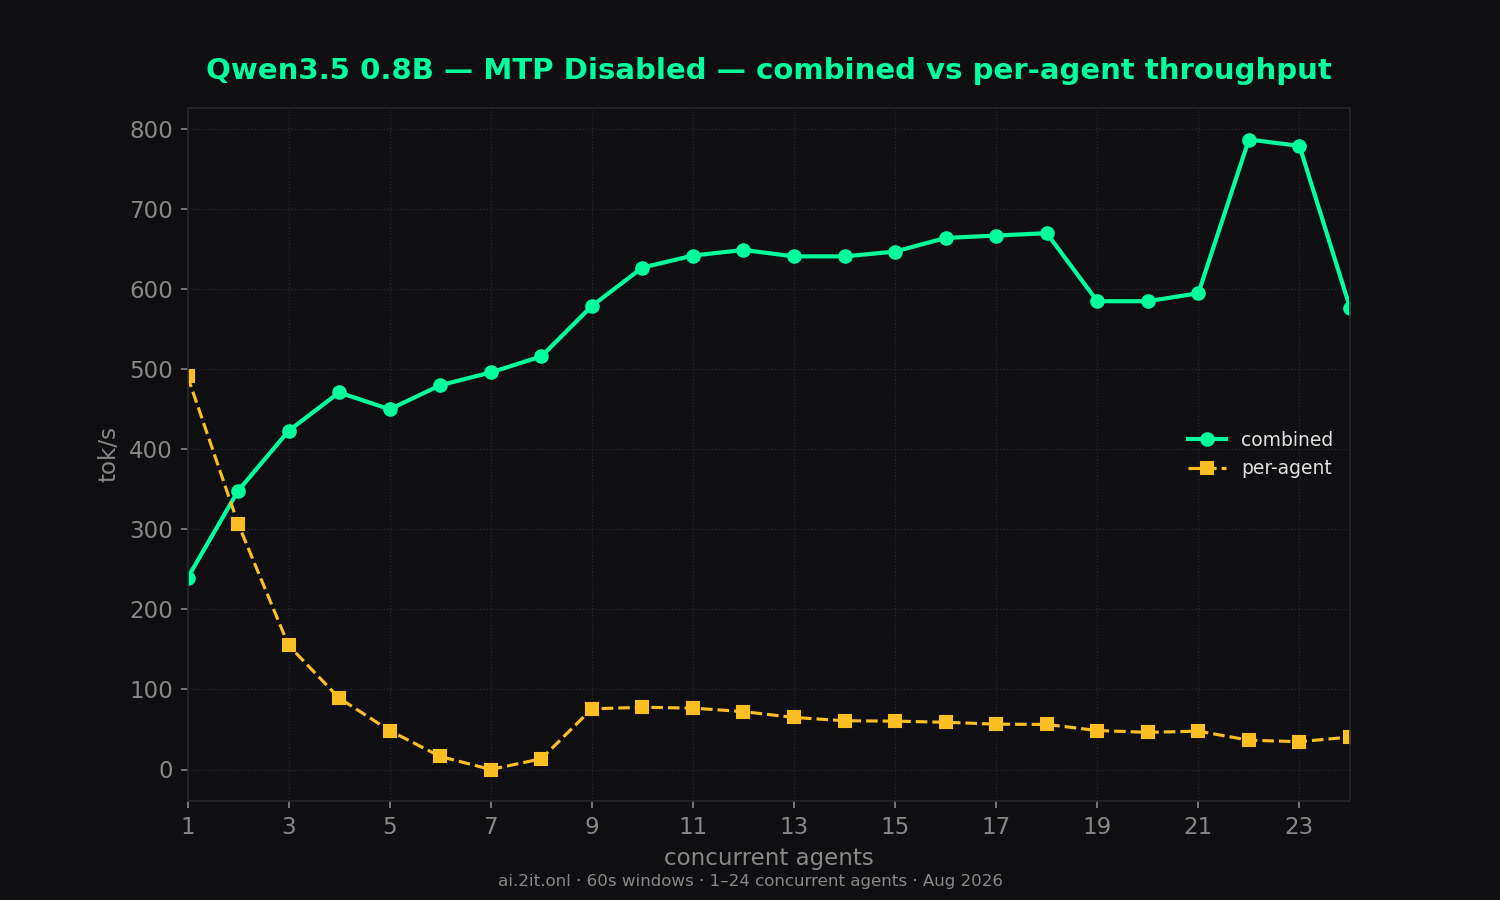
The MTP experiment: with multi-token prediction off, throughput scales 3.3x instead of flatlining at ~180 tok/s.
Key findings
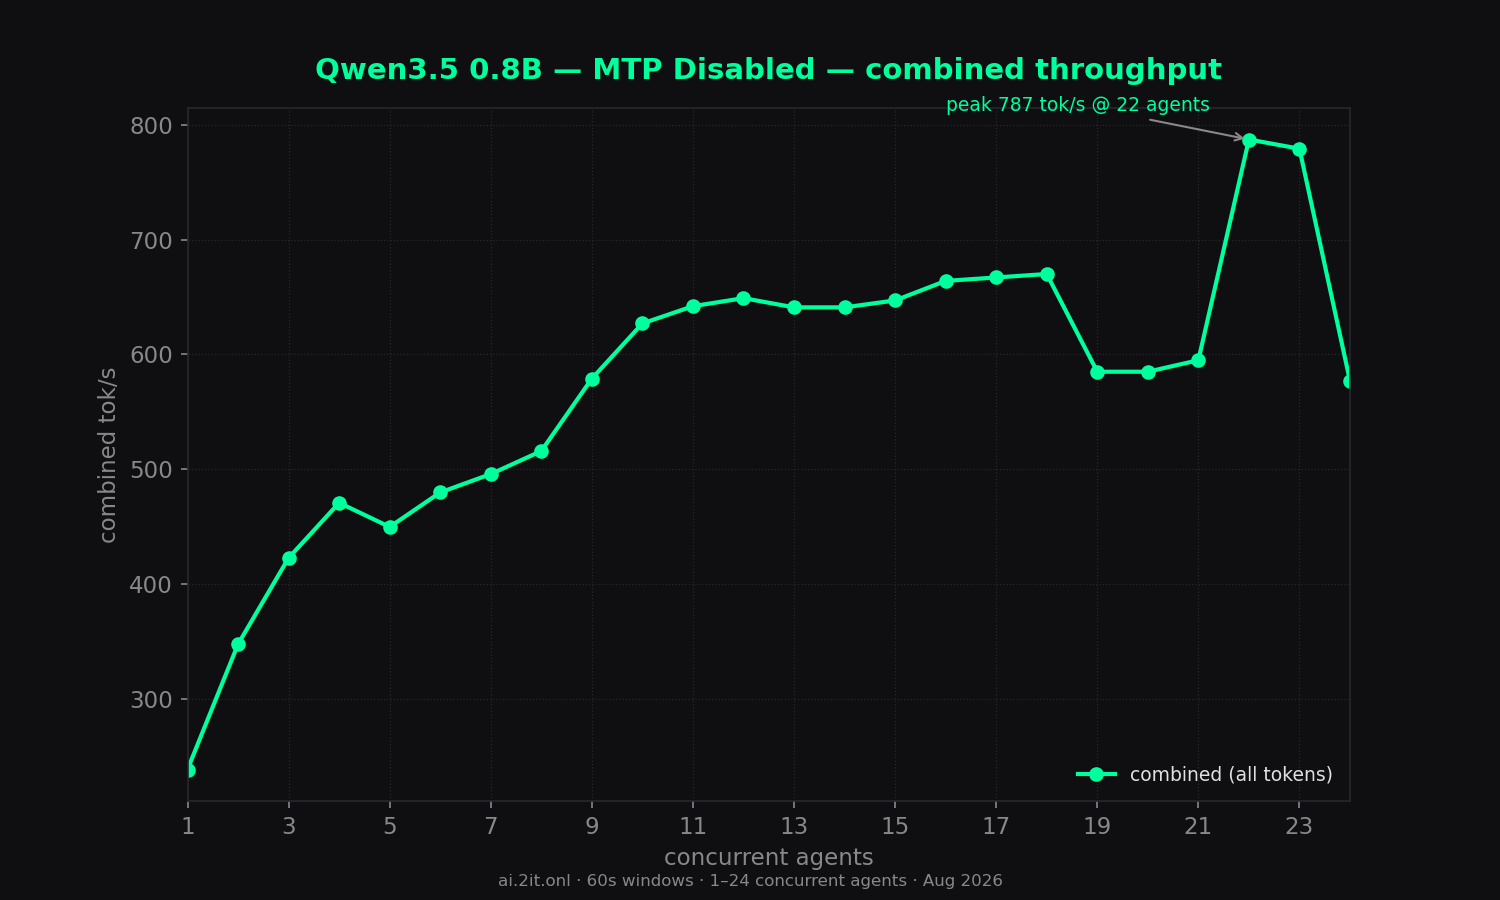
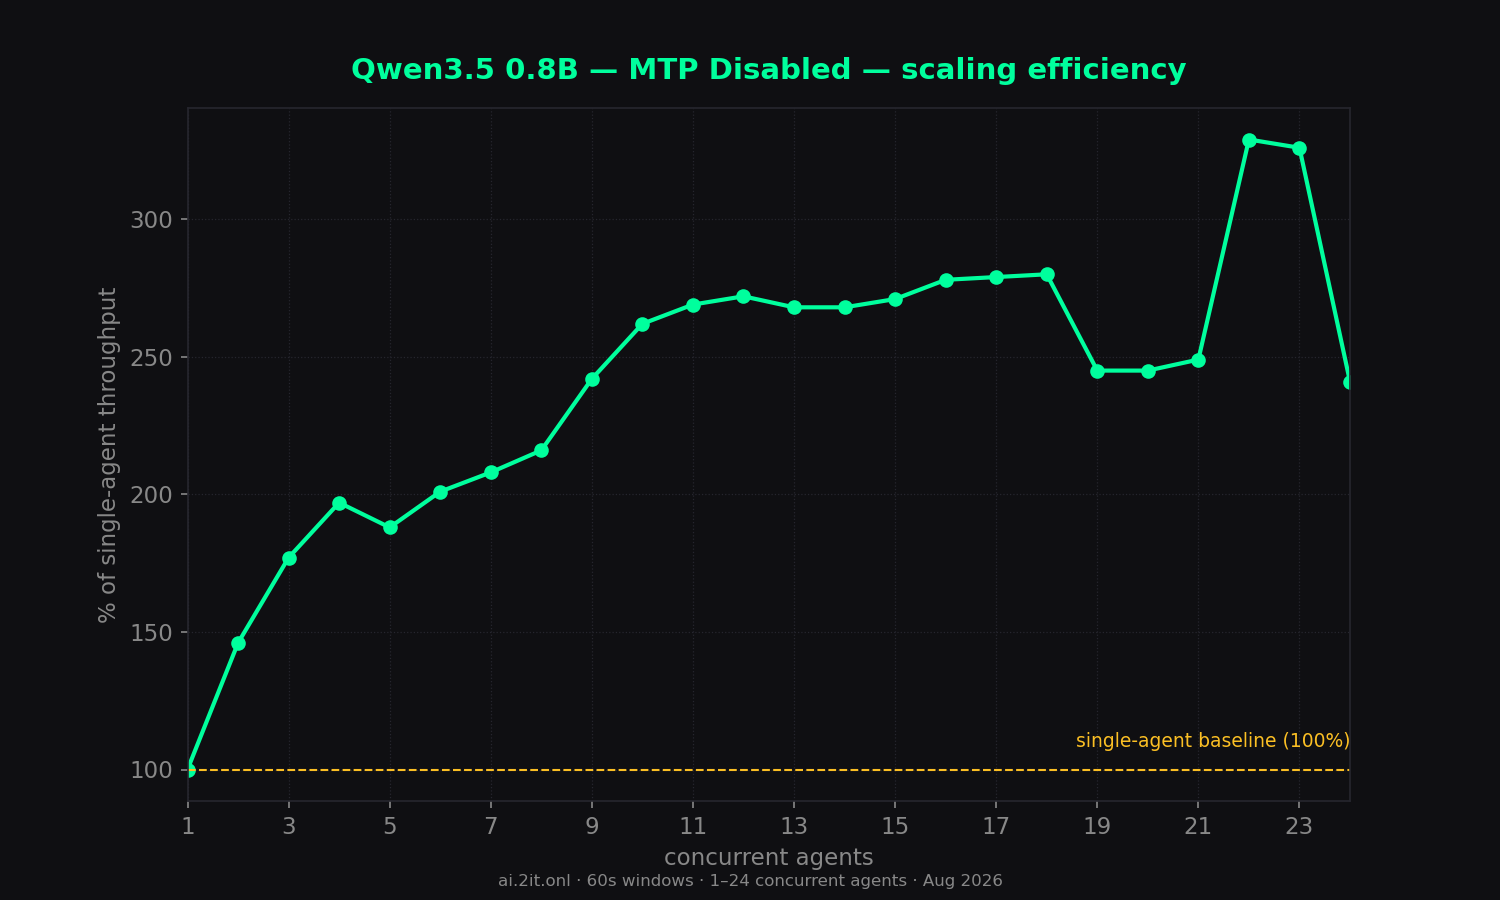
- MTP was the bottleneck — confirmed. Combined throughput now scales with concurrency: 239 tok/s solo → 670 tok/s at 18 agents (2.8x), peaking at 787 tok/s at 22 (3.3x, though that run ended early). Compare the MTP-enabled run, which was flat at ~180 tok/s. Disabling MTP lets LM Studio batch/parallelize this model like the others.
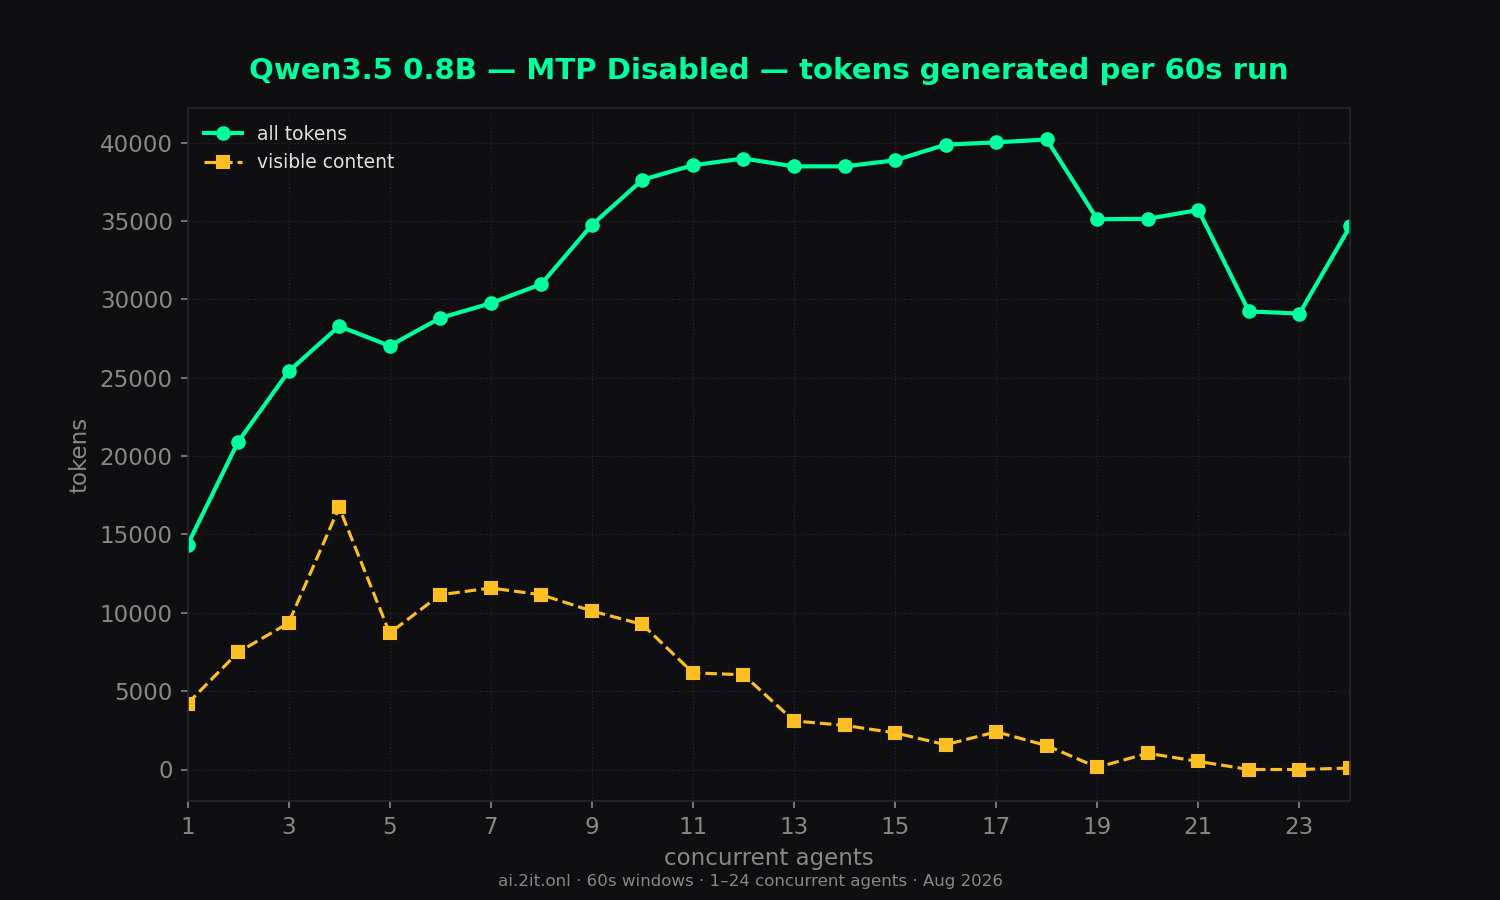
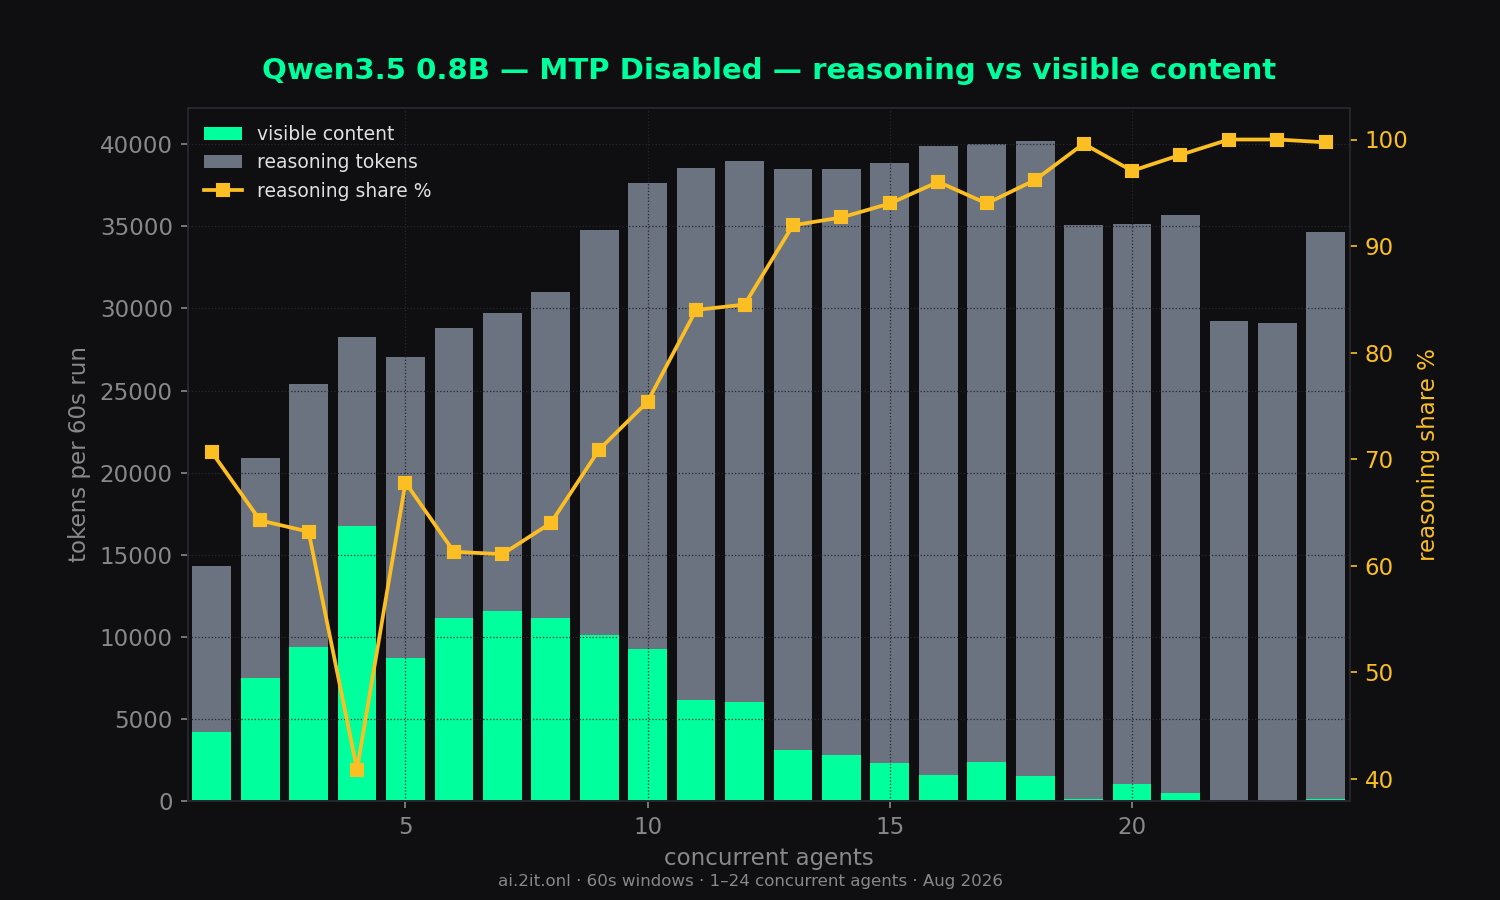
- Still a thinking model: output remains ~70–99%
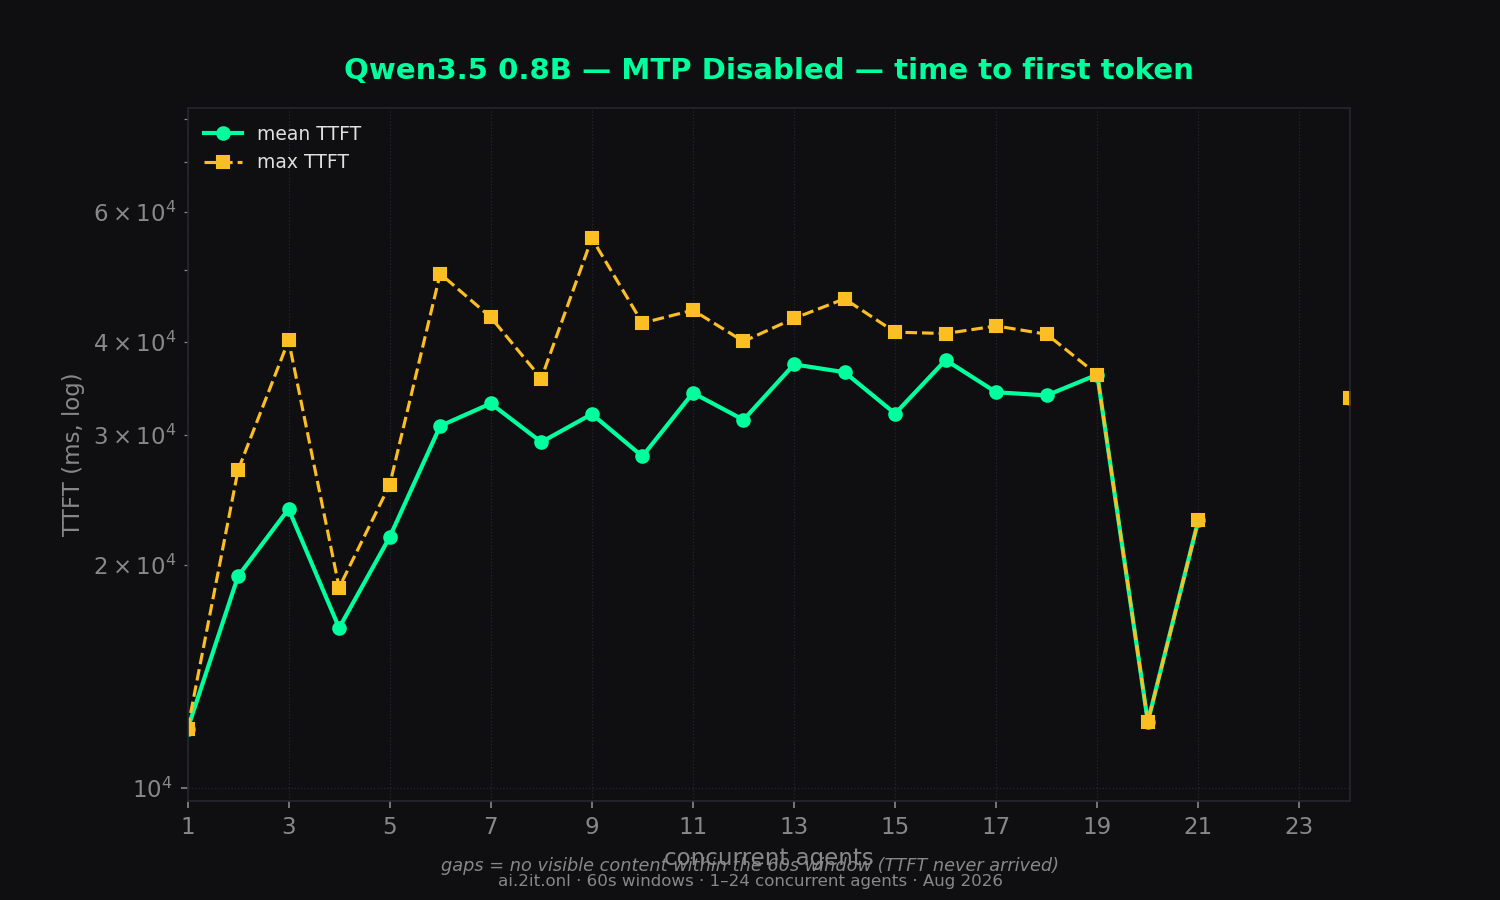
reasoning_content. At low concurrency it now produces substantial visible content (up to 16.7k content tokens at 4 agents), but from ~12 agents up, visible content collapses toward zero as reasoning + queueing consume the 60s window. - Very slow TTFT: 12s solo, 16–55s under load — the reasoning preamble dominates. Runs 22–23 produced zero visible content at all.
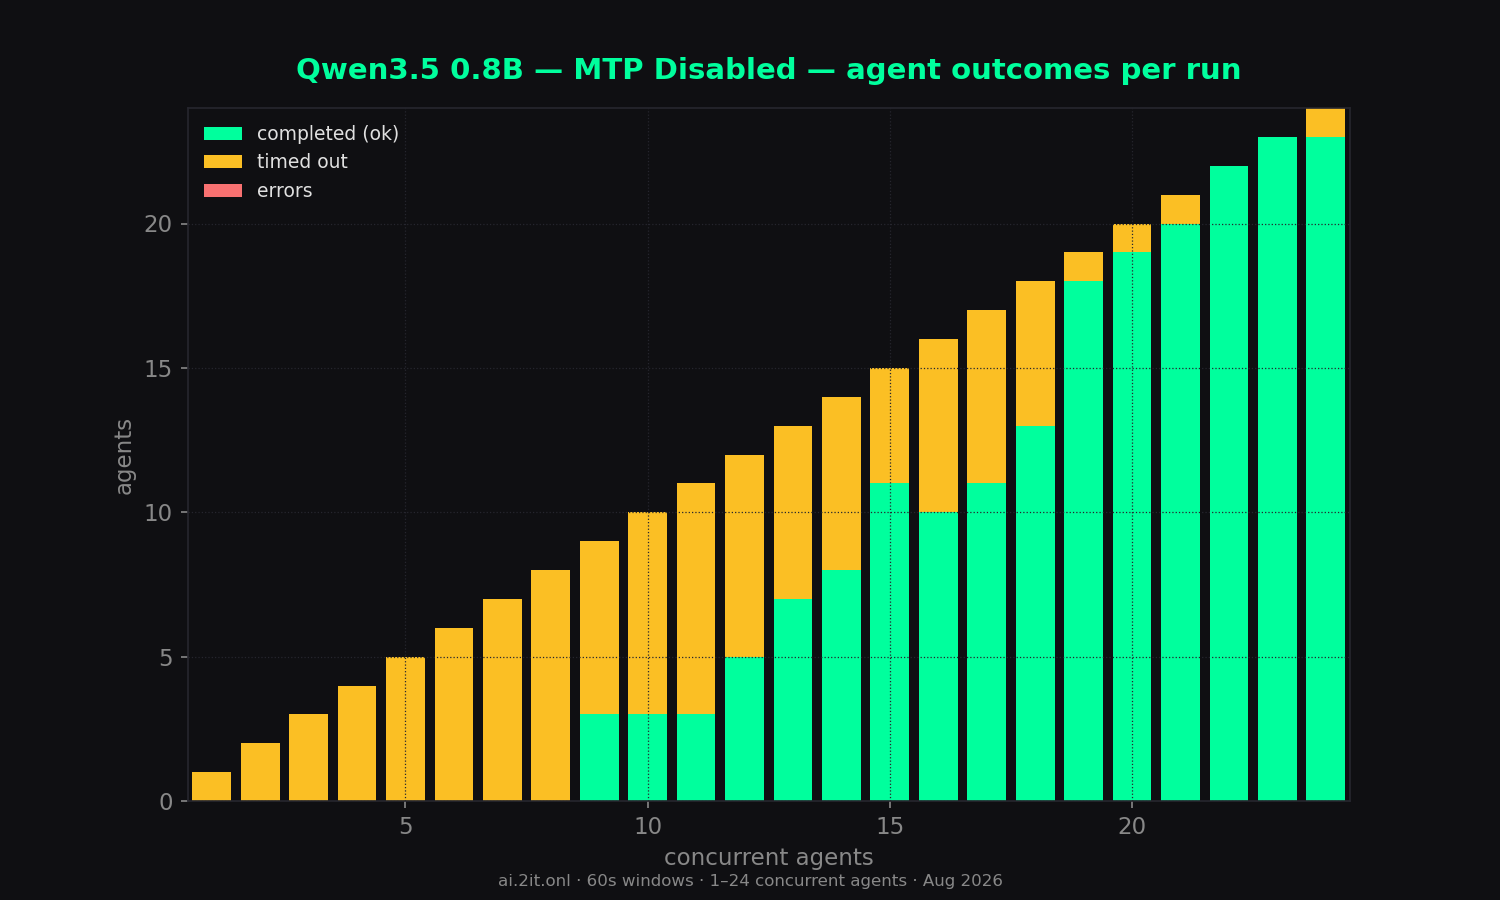
- Errors: 0 across all 24 runs.
Sweep — total concurrency 1–24
| agents | wall (s) | content | reason | total | comb tok/s | comb all | per-agent | per-agent all | scale % | TTFT mean | TTFT max | ok | timeout | err |
|---|---|---|---|---|---|---|---|---|---|---|---|---|---|---|
| 1 | 60.0 | 4,202 | 10,119 | 14,321 | 70 | 239 | 243.7 | 491.5 | 100% | 12.0s | 12.0s | 0 | 1 | 0 |
| 2 | 60.0 | 7,474 | 13,428 | 20,902 | 124 | 348 | 178.8 | 307.1 | 146% | 19.3s | 26.9s | 0 | 2 | 0 |
| 3 | 60.0 | 9,350 | 16,050 | 25,400 | 156 | 423 | 100.2 | 155.1 | 177% | 23.8s | 40.2s | 0 | 3 | 0 |
| 4 | 60.0 | 16,727 | 11,559 | 28,286 | 279 | 471 | 61.8 | 89.2 | 197% | 16.4s | 18.7s | 0 | 4 | 0 |
| 5 | 60.0 | 8,705 | 18,328 | 27,033 | 145 | 450 | 39.5 | 48.6 | 188% | 21.8s | 25.7s | 0 | 5 | 0 |
| 6 | 60.0 | 11,148 | 17,662 | 28,810 | 186 | 480 | 13.7 | 16.3 | 201% | 30.8s | 49.5s | 0 | 6 | 0 |
| 7 | 60.0 | 11,581 | 18,170 | 29,751 | 193 | 496 | 0.0 | 0.0 | 208% | 33.1s | 43.2s | 0 | 7 | 0 |
| 8 | 60.0 | 11,150 | 19,823 | 30,973 | 186 | 516 | 8.7 | 13.4 | 216% | 29.3s | 35.7s | 0 | 8 | 0 |
| 9 | 60.0 | 10,113 | 24,636 | 34,749 | 168 | 579 | 64.2 | 75.8 | 242% | 32.0s | 55.2s | 3 | 6 | 0 |
| 10 | 60.0 | 9,258 | 28,371 | 37,629 | 154 | 627 | 44.2 | 77.7 | 262% | 28.0s | 42.5s | 3 | 7 | 0 |
| 11 | 60.0 | 6,169 | 32,388 | 38,557 | 103 | 642 | 43.4 | 76.7 | 269% | 34.2s | 44.2s | 3 | 8 | 0 |
| 12 | 60.0 | 6,041 | 32,946 | 38,987 | 101 | 649 | 33.9 | 72.3 | 272% | 31.4s | 40.1s | 5 | 7 | 0 |
| 13 | 60.0 | 3,099 | 35,386 | 38,485 | 52 | 641 | 24.8 | 65.0 | 268% | 37.3s | 43.1s | 7 | 6 | 0 |
| 14 | 60.0 | 2,816 | 35,670 | 38,486 | 47 | 641 | 20.0 | 60.9 | 268% | 36.4s | 45.8s | 8 | 6 | 0 |
| 15 | 60.0 | 2,335 | 36,536 | 38,871 | 39 | 647 | 12.6 | 60.4 | 271% | 32.0s | 41.3s | 11 | 4 | 0 |
| 16 | 60.0 | 1,584 | 38,288 | 39,872 | 26 | 664 | 17.0 | 59.0 | 278% | 37.8s | 41.1s | 10 | 6 | 0 |
| 17 | 60.0 | 2,404 | 37,614 | 40,018 | 40 | 667 | 16.1 | 56.6 | 279% | 34.2s | 42.1s | 11 | 6 | 0 |
| 18 | 60.0 | 1,526 | 38,674 | 40,200 | 25 | 670 | 11.5 | 56.3 | 280% | 33.9s | 41.0s | 13 | 5 | 0 |
| 19 | 60.0 | 139 | 34,971 | 35,110 | 2 | 585 | 2.1 | 48.7 | 245% | 36.2s | 36.2s | 18 | 1 | 0 |
| 20 | 60.0 | 1,034 | 34,104 | 35,138 | 17 | 585 | 2.0 | 46.4 | 245% | 12.3s | 12.3s | 19 | 1 | 0 |
| 21 | 60.0 | 515 | 35,187 | 35,702 | 9 | 595 | 1.8 | 47.9 | 249% | 23.0s | 23.0s | 20 | 1 | 0 |
| 22 peak | 37.1 | 0 | 29,232 | 29,232 | 0 | 787 | 0.0 | 36.6 | 329% | — | — | 22 | 0 | 0 |
| 23 | 37.4 | 0 | 29,091 | 29,091 | 0 | 779 | 0.0 | 34.7 | 326% | — | — | 23 | 0 | 0 |
| 24 | 60.0 | 94 | 34,562 | 34,656 | 2 | 577 | 1.4 | 40.6 | 241% | 33.6s | 33.6s | 23 | 1 | 0 |
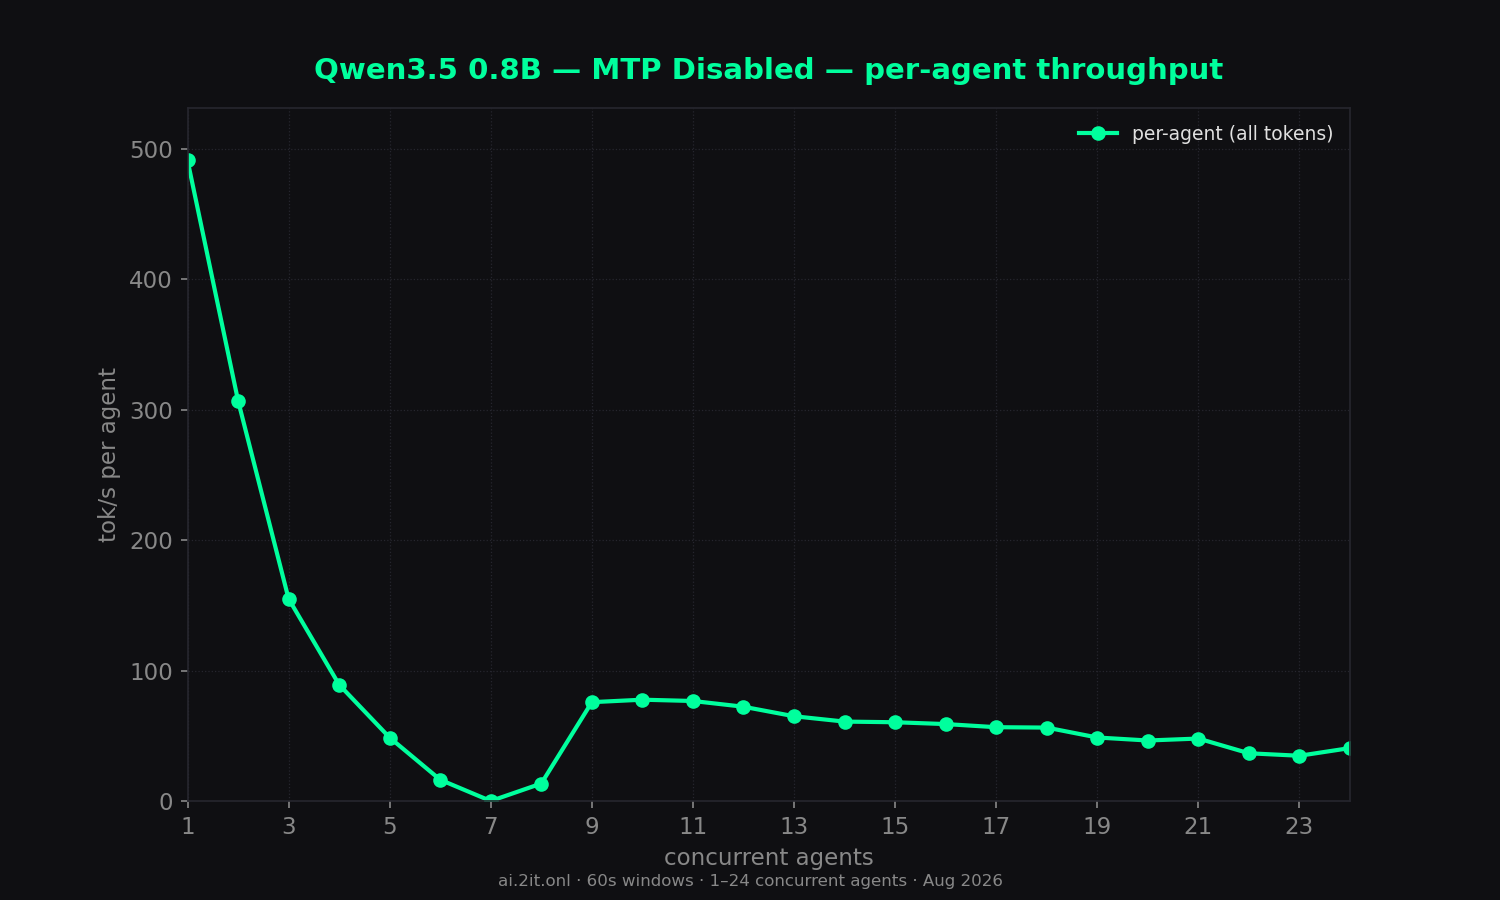
* burst artifact — agents queued ~11–16s then generated in a short burst; the per-agent timer inflates the number. Trust combined throughput and TTFT columns. Peak row = highest combined (all-token) throughput.
Charts
Raw data & downloads
- report.md6 KB
- sweep-summary.csv2 KB
- sweep-summary.json11 KB
- combined_throughput.png130 KB · original matplotlib export
- combined_vs_per_agent.png102 KB · original matplotlib export
- dashboard_1_24.png177 KB · original matplotlib export
- outcome_breakdown.png57 KB · original matplotlib export
- per_agent_throughput.png110 KB · original matplotlib export
- reasoning_vs_content.png66 KB · original matplotlib export
- scaling_efficiency.png86 KB · original matplotlib export
- time_to_first_token.png66 KB · original matplotlib export
- total_tokens_generated.png80 KB · original matplotlib export
/raw/combined_throughput.png)
/raw/combined_vs_per_agent.png)
/raw/dashboard_1_24.png)
/raw/outcome_breakdown.png)
/raw/per_agent_throughput.png)
/raw/reasoning_vs_content.png)
/raw/scaling_efficiency.png)
/raw/time_to_first_token.png)
/raw/total_tokens_generated.png)